
|
||||||
|

Translation Factor: ELAVL4 (NCBI Gene ID:1996) |
|
 Gene Summary |
| Gene Information | Gene Name: ELAVL4 | Gene ID: 1996 | Gene Symbol | ELAVL4 | Gene ID | 1996 |
| Gene Name | ELAV like RNA binding protein 4 | |
| Synonyms | HUD|PNEM | |
| Cytomap | 1p33-p32.3 | |
| Type of Gene | protein-coding | |
| Description | ELAV-like protein 4ELAV (embryonic lethal, abnormal vision, Drosophila)-like 4 (Hu antigen D)ELAV like neuron-specific RNA binding protein 4Hu antigen Dparaneoplastic encephalomyelitis antigen HuD | |
| Modification date | 20200320 | |
| UniProtAcc | P26378 | |
| Child GO biological process term(s) under GO:0006412 |
| GO ID | GO term |
| GO:0006417 | Regulation of translation |
| GO:0005840 | Ribosome |
| GO:0006412 | Translation |
| Gene ontology of translaction factor with evidence of Inferred from Direct Assay (IDA) from Entrez |
| Partner | Gene | GO ID | GO term | PubMed ID |
| Inferred gene age of translation factor. |
| Gene | Inferred gene age group among (0 - 67.6], (67.6 - 355.7], (355.7 - 733], (733 - 1119.25], >1119.25 |
| ELAVL4 | (0 - 67.6] |
Top |
|
| We searched PubMed using 'ELAVL4[title] AND translation [title] AND human.' |
| Gene | Title | PMID |
| ELAVL4 | . | . |
Top |
|
| Skipped exons in TCGA and GTEx based on Ensembl gene isoform structure. * Click on the image to open the UCSC genome browser with custom track showing this image in a new window. For more annotations, please visit our ExonSkipDB. |
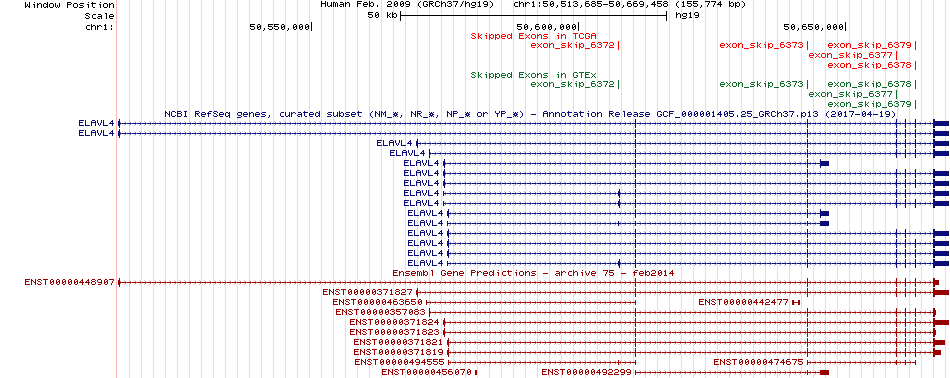 |
| Open reading frame (ORF) analsis of exon skipping events based on Ensembl gene isoform structure. * Click on the break point to see the gene structure around the break point region using the UCSC Genome Browser. |
| ENST | Exon skip start (DNA) | Exon Skip end (DNA) | ORF |
| ENST00000371823 | 50642760 | 50642864 | Frame-shift |
| ENST00000371823 | 50659436 | 50659590 | Frame-shift |
| ENST00000371823 | 50663100 | 50663139 | In-frame |
| Exon skipping position in the amino acid sequence. |
| ENST | Exon skip start (DNA) | Exon Skip end (DNA) | Len(transcript seq) | Exon skip start (mRNA) | Exon Skip end (mRNA) | Len(amino acid seq) | Exon skip start (AA) | Exon Skip end (AA) |
| ENST00000371823 | 50663100 | 50663139 | 1608 | 959 | 997 | 380 | 245 | 257 |
| Potentially (partially) lost protein functional features of UniProt. |
| UniProtAcc | Exon skip start (AA) | Exon Skip end (AA) | Function feature start (AA) | Function feature end (AA) | Functional feature type | Functional feature desc. |
| P26378 | 245 | 257 | 1 | 380 | Chain | ID=PRO_0000081583;Note=ELAV-like protein 4 |
Top |
|
| Gene expression level across TCGA pancancer |
 |
| Gene expression level across GTEx pantissue |
 |
| Expression level of gene isoforms across TCGA pancancer |
 |
| Expression level of gene isoforms across GTEx pantissue |
 |
| Cancer(tissue) type-specific expression level of Translation factor using z-score distriution |
 |
| Differential expression between tumor and matched normal (in the cancer types with more than 10 matched samples) |
 |
| Cancer type | Translation factor | FC | adj.pval |
| STAD | ELAVL4 | -4.8156917527045 | 0.00879816571250558 |
| KIRC | ELAVL4 | -1.00392229844369 | 5.67077560181782e-08 |
| LUAD | ELAVL4 | -3.36373499023005 | 6.5815976201703e-06 |
Top |
|
| Translation factor expression regulation through miRNA binding |
| Cancer type | Gene | miRNA | TargetScan binding score (Context++ score percentile) | Coefficient | Pvalue |
| Translation factor expression regulation through methylation in the promoter of Translation factor |
 |
| Cancer type | Gene | methyl group b | methyl group a | DEG pval | avg methyl in b | avg methyl in a | avg exp in b | avg exp in a |
| LGG | ELAVL4 | 2 | 3 | 0.0225771605203018 | 0.545617612183213 | 0.669975611611104 | -0.194268287393171 | -0.275818335724168 |
| LUAD | ELAVL4 | 2 | 3 | 0.00500578915107706 | 0.527880494821634 | 0.666390393356644 | -0.159213638709565 | -0.0458339064799172 |
| Translation factor expression regulation through methylation in the gene body of Translation factor (positive regulation) |
 |
| Cancer type | Gene | methyl group b | methyl group a | DEG pval | avg methyl in b | avg methyl in a | avg exp in b | avg exp in a |
| PRAD | ELAVL4 | 3 | 2 | 0.00977432016947184 | 0.664489387464387 | 0.483625 | -0.12606664160476 | -0.39004258524631 |
| Translation factor expression regulation through copy number variation of Translation factor |
 |
| Cancer type | Gene | Coefficient | Pvalue |
| SKCM | ELAVL4 | -0.021802303 | 0.024972724 |
| THYM | ELAVL4 | -0.049540085 | 0.025044505 |
Top |
|
| Strongly correlated genes belong to cellular important gene groups with ELAVL4 (coefficient>0.8, pval<0.05, node color based on FC between tumor and matched normal). Significantly associated important genes in the individual cancer types. * Cell metabolism gene: cell metabolism genes from REACTOME (black edge), IUPHAR: drug target genes from IUPHAR (blue edge), Kinase: human kinase genes (brown edge), CGC: cancer gene census genes (orange edge), TSG: tumor suppresor genes (purple edge), Epifactor: epigenetic factors (light blue edge), TF: transcription factors (green) |
 |
| Cancer type | Gene group | Translation factor | Correlated gene | Coefficient | Pvalue |
| COAD | Cell metabolism gene | ELAVL4 | SNAP25 | 0.801970724 | 3.71E-75 |
| COAD | Cell metabolism gene | ELAVL4 | GNAO1 | 0.805557589 | 2.58E-76 |
| COAD | Cell metabolism gene | ELAVL4 | ST8SIA3 | 0.859116233 | 3.80E-97 |
| COAD | CGC | ELAVL4 | CTNND2 | 0.800489292 | 1.10E-74 |
| COAD | CGC | ELAVL4 | PHOX2B | 0.885286817 | 9.29E-111 |
| COAD | CGC | ELAVL4 | ATP2B3 | 0.811273226 | 3.26E-78 |
| COAD | CGC | ELAVL4 | CDH10 | 0.807939496 | 4.25E-77 |
| COAD | IUPHAR | ELAVL4 | SLC7A14 | 0.88737437 | 5.51E-112 |
| COAD | IUPHAR | ELAVL4 | PTPRZ1 | 0.804195766 | 7.14E-76 |
| COAD | IUPHAR | ELAVL4 | PCSK2 | 0.85009185 | 4.45E-93 |
| COAD | IUPHAR | ELAVL4 | ATP2B3 | 0.811273226 | 3.26E-78 |
| COAD | IUPHAR | ELAVL4 | GABRG2 | 0.831627256 | 1.56E-85 |
| COAD | IUPHAR | ELAVL4 | SLC5A7 | 0.842172747 | 1.01E-89 |
| COAD | IUPHAR | ELAVL4 | SLC18A3 | 0.832499084 | 7.21E-86 |
| COAD | TF | ELAVL4 | FOXD3 | 0.807728493 | 4.99E-77 |
| COAD | TF | ELAVL4 | PHOX2A | 0.862116574 | 1.46E-98 |
| COAD | TF | ELAVL4 | SOX10 | 0.832340479 | 8.30E-86 |
| COAD | TF | ELAVL4 | PHOX2B | 0.885286817 | 9.29E-111 |
| COAD | TSG | ELAVL4 | PHOX2A | 0.862116574 | 1.46E-98 |
| COAD | TSG | ELAVL4 | FOXD3 | 0.807728493 | 4.99E-77 |
| COAD | TSG | ELAVL4 | CMTM5 | 0.812297715 | 1.47E-78 |
| GBM | Epifactor | ELAVL4 | ACTL6B | 0.819315004 | 6.34E-43 |
| GBM | TF | ELAVL4 | SCRT1 | 0.822733763 | 1.46E-43 |
| PAAD | Cell metabolism gene | ELAVL4 | SNAP25 | 0.811440507 | 4.38E-44 |
| PAAD | Cell metabolism gene | ELAVL4 | GNAO1 | 0.840235761 | 5.41E-50 |
| PAAD | Cell metabolism gene | ELAVL4 | GPR119 | 0.809704368 | 9.22E-44 |
| PAAD | CGC | ELAVL4 | FAM135B | 0.815483518 | 7.50E-45 |
| PAAD | CGC | ELAVL4 | CDH10 | 0.805998157 | 4.41E-43 |
| PAAD | Epifactor | ELAVL4 | ACTL6B | 0.811591698 | 4.10E-44 |
| PAAD | IUPHAR | ELAVL4 | CACNA1B | 0.852984086 | 5.36E-53 |
| PAAD | IUPHAR | ELAVL4 | GRIA2 | 0.861398375 | 3.86E-55 |
| PAAD | IUPHAR | ELAVL4 | SLC7A14 | 0.883238978 | 1.97E-61 |
| PAAD | IUPHAR | ELAVL4 | CHRNB2 | 0.886370651 | 1.95E-62 |
| PAAD | IUPHAR | ELAVL4 | SLC4A10 | 0.801814699 | 2.48E-42 |
| PAAD | IUPHAR | ELAVL4 | GJD2 | 0.815386702 | 7.82E-45 |
| PAAD | IUPHAR | ELAVL4 | GPR119 | 0.809704368 | 9.22E-44 |
| PAAD | IUPHAR | ELAVL4 | KCNB2 | 0.809747752 | 9.05E-44 |
| PAAD | IUPHAR | ELAVL4 | PCSK2 | 0.811126948 | 5.01E-44 |
| PAAD | IUPHAR | ELAVL4 | SLC6A17 | 0.811374736 | 4.50E-44 |
| PAAD | IUPHAR | ELAVL4 | GRIA3 | 0.814712741 | 1.05E-44 |
| PAAD | IUPHAR | ELAVL4 | SLC6A4 | 0.807969644 | 1.93E-43 |
| PAAD | IUPHAR | ELAVL4 | MAP3K15 | 0.815540481 | 7.31E-45 |
| PAAD | IUPHAR | ELAVL4 | GABRG2 | 0.818349466 | 2.09E-45 |
| PAAD | IUPHAR | ELAVL4 | KCNH6 | 0.805562664 | 5.29E-43 |
| PAAD | Kinase | ELAVL4 | MAP3K15 | 0.815540481 | 7.31E-45 |
| PAAD | TF | ELAVL4 | NEUROD1 | 0.807516872 | 2.33E-43 |
| PAAD | TF | ELAVL4 | RFX6 | 0.862921514 | 1.53E-55 |
| PAAD | TF | ELAVL4 | ST18 | 0.85904602 | 1.58E-54 |
| PAAD | TF | ELAVL4 | MYT1L | 0.830842325 | 6.06E-48 |
| PAAD | TF | ELAVL4 | INSM1 | 0.804779886 | 7.32E-43 |
| PAAD | TSG | ELAVL4 | DUSP26 | 0.805742434 | 4.90E-43 |
| READ | CGC | ELAVL4 | PHOX2B | 0.846098042 | 6.62E-30 |
| READ | IUPHAR | ELAVL4 | CNGA3 | 0.802758753 | 7.26E-25 |
| READ | IUPHAR | ELAVL4 | SLC7A14 | 0.843396646 | 1.51E-29 |
| READ | IUPHAR | ELAVL4 | SLC5A7 | 0.831180339 | 5.20E-28 |
| READ | TF | ELAVL4 | PHOX2B | 0.846098042 | 6.62E-30 |
| READ | TF | ELAVL4 | SOX10 | 0.839508299 | 4.80E-29 |
| READ | TF | ELAVL4 | PHOX2A | 0.819717968 | 1.12E-26 |
| READ | TSG | ELAVL4 | FHL1 | 0.816456252 | 2.59E-26 |
| READ | TSG | ELAVL4 | PHOX2A | 0.819717968 | 1.12E-26 |
Top |
|
| Protein 3D structure Visit iCn3D. |
Top |
|
| Protein-protein interaction networks * Overlap between up-regulated DEGs (log2FC<-1 and adj.P<0.05) and STRING PPI network (center: Translation factor, node: DEGs, edges: weighted by -log2(adj.P)) |
 |
| Overlap between down-regulated DEGs (log2FC>1 and adj.P<0.05) and STRING PPI network (center: Translation factor, node: DEGs, edges: weighted by -log2(adj.P)) |
 |
 * Edge colors based on TCGA cancer types. |
| * Overlap between DEGs (log2FC>1 and adj.P<0.05) and STRING PPI network per cancer (center: Translation factor, node: DEGs, node color: log2FC, edges: weighted by -log2(adj.P)) |
 |
| Cancer type | Translation factor | Interacting protein coding gene | FC | adj.pval |
| BRCA | ELAVL4 | CSF2RA | -2.51006529885605 | 0.000111245050869078 |
| HNSC | ELAVL4 | G3BP1 | 1.15470167292163 | 0.000481783007217019 |
| BLCA | ELAVL4 | GNG3 | -2.0595779213728 | 0.002838134765625 |
| THCA | ELAVL4 | CSF2RA | -1.23391067811326 | 0.00492925389458784 |
| THCA | ELAVL4 | USP24 | 1.05550382024404 | 0.00650758354344202 |
| CHOL | ELAVL4 | GAP43 | -1.65061283677245 | 0.01171875 |
| UCEC | ELAVL4 | LGALS4 | 1.36665298781971 | 0.015625 |
| HNSC | ELAVL4 | GAP43 | -5.42580454145074 | 0.0291841810949336 |
| ESCA | ELAVL4 | EIF4A1 | -1.24538073199285 | 0.0419921875 |
| KIRC | ELAVL4 | USP24 | -1.91855601947194 | 1.38674564399926e-11 |
| PRAD | ELAVL4 | G3BP1 | -4.29883961189402 | 2.3360983838936e-06 |
| LUAD | ELAVL4 | GAP43 | -1.37717814606977 | 3.39403697895003e-06 |
| LUSC | ELAVL4 | CSF2RA | -7.73687062613045 | 4.28240904037329e-08 |
| THCA | ELAVL4 | NRN1 | 1.87891824458944 | 4.34082003868401e-07 |
| BRCA | ELAVL4 | NRN1 | -2.78079620697682 | 5.43746186277972e-31 |
| STAD | ELAVL4 | G3BP1 | -3.96377290273826 | 6.0301274061203e-05 |
| BRCA | ELAVL4 | IGF2BP1 | -1.119264636586 | 6.55843695441879e-13 |
| BRCA | ELAVL4 | GNG3 | -1.26523755136054 | 6.77131714453856e-09 |
| KICH | ELAVL4 | EIF4A1 | 1.14485583309571 | 8.16583633422851e-06 |
| LUSC | ELAVL4 | NRN1 | -1.88041807180197 | 9.83302840544139e-05 |
| Protein-protein interactors with this translation factor (BIOGRID-3.4.160) |
| PPI interactors with ELAVL4 |
| EWSR1, NXF1, PHF20L1, DGUOK, NTRK1, Hnrnph1, Sfpq, G3bp1, Igf2bp1, IGF2BP1, SART3, STAU1, FBXW11, SYNCRIP, VCP, PPT1, CSK, Smn1, ATP8B4, ADAMTS18, CSNK2A1, TUB, RNF41, CCDC140, FAU, RPL26L1, ZC3H11A, E4F1, PNRC2, GOLGA8A, H2AFB2, RPL19, |
Top |
|
| Clinically associated variants from ClinVar. |
| Gene | Chr | Position | RefSeq | VarSeq | RefSeeq | VarType | Pathogenic | Disease | VarInfo |
| ELAVL4 | chr1 | 50610767 | G | A | single_nucleotide_variant | Uncertain_significance | High_myopia | SO:0001583|missense_variant,SO:0001619|non-coding_transcript_variant | SO:0001583|missense_variant,SO:0001619|non-coding_transcript_variant |
| nsSNVs with sample frequency (size of circle) from TCGA 33 cancers. |
 |
| SNVs and Indels |
| Gene | Cancer type | Chromosome | Start | End | RefSeeq | MutSeq | Mutation type | AAchange | # samples |
| Copy number variation (CNV) of ELAVL4 * Click on the image to open the original image in a new window. |
 |
| Fusion gene breakpoints (product of the structural variants (SVs)) across ELAVL4 * Click on the image to open the UCSC genome browser with custom track showing this image in a new window. |
 |
| Fusion genes with this translation factor from FusionGDB2.0. |
| FusionGDB2 ID | Disease | Sample | Hgene | Hchr | Hbp | Hstrand | Tgene | Tchr | Tbp | Tstrand |
| 100632 | N/A | BY798206 | CDR1 | chrX | 139866259 | + | ELAVL4 | chr1 | 50666827 | + |
| 100632 | BRCA | TCGA-E2-A1LS-01A | FOXJ3 | chr1 | 42776721 | - | ELAVL4 | chr1 | 50642761 | + |
| 100632 | N/A | CD652387 | WDHD1 | chr14 | 55457973 | - | ELAVL4 | chr1 | 50519494 | - |
| 100635 | BRCA | TCGA-D8-A1JA-01A | ZCCHC11 | chr1 | 53018603 | - | ELAVL4 | chr1 | 50642761 | + |
Top |
|
| Kaplan-Meier plots with logrank tests of overall survival (OS) |
 |
| Cancer type | Translation factor | Coefficent | Hazard ratio | Wald test pval | Likelihool ratio pval | Logrank test pval | # samples |
Top |
|
| Differential gene expression between female and male. (Wilcoxon test, pval<0.05) |
 |
| Cancer type | Translation factor | pval | adj.p |
| LUSC | ELAVL4 | 0.00517697948330493 | 0.14 |
| HNSC | ELAVL4 | 0.00712430737617619 | 0.19 |
| ACC | ELAVL4 | 0.0145353791245345 | 0.38 |
| TGCT | ELAVL4 | 0.0154003621562019 | 0.39 |
| THYM | ELAVL4 | 0.0216801125409602 | 0.52 |
| KIRP | ELAVL4 | 0.0421586237353492 | 0.97 |
Top |
|
| Differential gene expression between young and old age groups (Wilcoxon test, pval<0.05) |
 |
| Cancer type | Translation factor | pval | adj.p |
| GBM | ELAVL4 | 0.00846537398370798 | 0.27 |
| LGG | ELAVL4 | 0.00170885768062573 | 0.056 |
| SKCM | ELAVL4 | 0.0487665768678095 | 1 |
| CESC | ELAVL4 | 0.0483963496203318 | 1 |
Top |
|
| Drugs targeting genes involved in this translation factor. (DrugBank Version 5.1.8 2021-05-08) |
| UniProtAcc | DrugBank ID | Drug name | Drug activity | Drug type | Drug status |
Top |
|
| Diseases associated with this translation factor. (DisGeNet 4.0) |
| Disease ID | Disease Name | # PubMeds | Disease source |
 Copyright 2021-Present -The University of Texas Health Science Center at Houston
(UTHealth)
Web File Viewing | Emergency Information |Campus Carry|Site Policies