
|
||||||
|

Translation Factor: MKNK2 (NCBI Gene ID:2872) |
|
 Gene Summary |
| Gene Information | Gene Name: MKNK2 | Gene ID: 2872 | Gene Symbol | MKNK2 | Gene ID | 2872 |
| Gene Name | MAPK interacting serine/threonine kinase 2 | |
| Synonyms | GPRK7|MNK2 | |
| Cytomap | 19p13.3 | |
| Type of Gene | protein-coding | |
| Description | MAP kinase-interacting serine/threonine-protein kinase 2G protein-coupled receptor kinase 7MAP kinase interacting serine/threonine kinase 2MAP kinase signal-integrating kinase 2MAPK signal-integrating kinase 2 | |
| Modification date | 20200313 | |
| UniProtAcc | Q9HBH9 | |
| Child GO biological process term(s) under GO:0006412 |
| GO ID | GO term |
| GO:0006417 | Regulation of translation |
| GO:0006412 | Translation |
| Gene ontology of translaction factor with evidence of Inferred from Direct Assay (IDA) from Entrez |
| Partner | Gene | GO ID | GO term | PubMed ID |
| Hgene | MKNK2 | GO:0006468 | protein phosphorylation | 11463832 |
| Hgene | MKNK2 | GO:0030097 | hemopoiesis | 21149447 |
| Hgene | MKNK2 | GO:0035556 | intracellular signal transduction | 11463832 |
| Hgene | MKNK2 | GO:0071243 | cellular response to arsenic-containing substance | 18299328 |
| Inferred gene age of translation factor. |
| Gene | Inferred gene age group among (0 - 67.6], (67.6 - 355.7], (355.7 - 733], (733 - 1119.25], >1119.25 |
| MKNK2 | (67.6 - 355.7] |
Top |
|
| We searched PubMed using 'MKNK2[title] AND translation [title] AND human.' |
| Gene | Title | PMID |
| MKNK2 | . | . |
Top |
|
| Skipped exons in TCGA and GTEx based on Ensembl gene isoform structure. * Click on the image to open the UCSC genome browser with custom track showing this image in a new window. For more annotations, please visit our ExonSkipDB. |
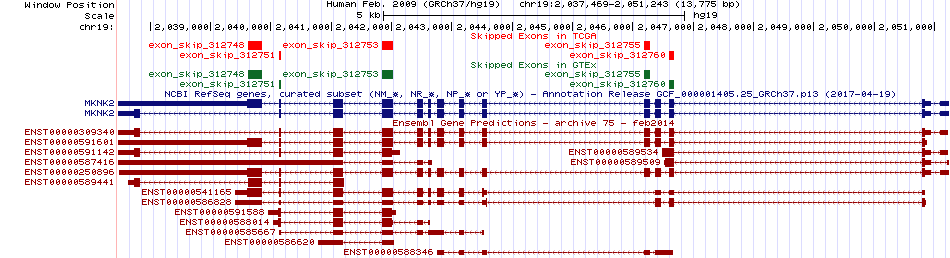 |
| Open reading frame (ORF) analsis of exon skipping events based on Ensembl gene isoform structure. * Click on the break point to see the gene structure around the break point region using the UCSC Genome Browser. |
| ENST | Exon skip start (DNA) | Exon Skip end (DNA) | ORF |
| ENST00000250896 | 2041838 | 2042033 | In-frame |
| ENST00000591601 | 2041838 | 2042033 | In-frame |
| ENST00000250896 | 2046184 | 2046282 | Frame-shift |
| ENST00000591601 | 2046184 | 2046282 | Frame-shift |
| ENST00000250896 | 2046602 | 2046690 | Frame-shift |
| ENST00000591601 | 2046602 | 2046690 | Frame-shift |
| Exon skipping position in the amino acid sequence. |
| ENST | Exon skip start (DNA) | Exon Skip end (DNA) | Len(transcript seq) | Exon skip start (mRNA) | Exon Skip end (mRNA) | Len(amino acid seq) | Exon skip start (AA) | Exon Skip end (AA) |
| ENST00000591601 | 2041838 | 2042033 | 3593 | 787 | 981 | 465 | 250 | 315 |
| ENST00000250896 | 2041838 | 2042033 | 3791 | 996 | 1190 | 465 | 250 | 315 |
| Potentially (partially) lost protein functional features of UniProt. |
| UniProtAcc | Exon skip start (AA) | Exon Skip end (AA) | Function feature start (AA) | Function feature end (AA) | Functional feature type | Functional feature desc. |
| Q9HBH9 | 250 | 315 | 1 | 465 | Chain | ID=PRO_0000086336;Note=MAP kinase-interacting serine/threonine-protein kinase 2 |
| Q9HBH9 | 250 | 315 | 1 | 465 | Chain | ID=PRO_0000086336;Note=MAP kinase-interacting serine/threonine-protein kinase 2 |
| Q9HBH9 | 250 | 315 | 84 | 388 | Domain | Note=Protein kinase;Ontology_term=ECO:0000255;evidence=ECO:0000255|PROSITE-ProRule:PRU00159 |
| Q9HBH9 | 250 | 315 | 84 | 388 | Domain | Note=Protein kinase;Ontology_term=ECO:0000255;evidence=ECO:0000255|PROSITE-ProRule:PRU00159 |
| Q9HBH9 | 250 | 315 | 299 | 299 | Metal binding | Note=Zinc;Ontology_term=ECO:0000269,ECO:0000269;evidence=ECO:0000269|PubMed:16216586,ECO:0000269|PubMed:16917500;Dbxref=PMID:16216586,PMID:16917500 |
| Q9HBH9 | 250 | 315 | 299 | 299 | Metal binding | Note=Zinc;Ontology_term=ECO:0000269,ECO:0000269;evidence=ECO:0000269|PubMed:16216586,ECO:0000269|PubMed:16917500;Dbxref=PMID:16216586,PMID:16917500 |
| Q9HBH9 | 250 | 315 | 311 | 311 | Metal binding | Note=Zinc;Ontology_term=ECO:0000269,ECO:0000269;evidence=ECO:0000269|PubMed:16216586,ECO:0000269|PubMed:16917500;Dbxref=PMID:16216586,PMID:16917500 |
| Q9HBH9 | 250 | 315 | 311 | 311 | Metal binding | Note=Zinc;Ontology_term=ECO:0000269,ECO:0000269;evidence=ECO:0000269|PubMed:16216586,ECO:0000269|PubMed:16917500;Dbxref=PMID:16216586,PMID:16917500 |
| Q9HBH9 | 250 | 315 | 314 | 314 | Metal binding | Note=Zinc;Ontology_term=ECO:0000269,ECO:0000269;evidence=ECO:0000269|PubMed:16216586,ECO:0000269|PubMed:16917500;Dbxref=PMID:16216586,PMID:16917500 |
| Q9HBH9 | 250 | 315 | 314 | 314 | Metal binding | Note=Zinc;Ontology_term=ECO:0000269,ECO:0000269;evidence=ECO:0000269|PubMed:16216586,ECO:0000269|PubMed:16917500;Dbxref=PMID:16216586,PMID:16917500 |
| Q9HBH9 | 250 | 315 | 261 | 261 | Sequence conflict | Note=V->L;Ontology_term=ECO:0000305;evidence=ECO:0000305 |
| Q9HBH9 | 250 | 315 | 261 | 261 | Sequence conflict | Note=V->L;Ontology_term=ECO:0000305;evidence=ECO:0000305 |
| Q9HBH9 | 250 | 315 | 254 | 256 | Helix | Ontology_term=ECO:0000244;evidence=ECO:0000244|PDB:2AC3 |
| Q9HBH9 | 250 | 315 | 254 | 256 | Helix | Ontology_term=ECO:0000244;evidence=ECO:0000244|PDB:2AC3 |
| Q9HBH9 | 250 | 315 | 259 | 264 | Helix | Ontology_term=ECO:0000244;evidence=ECO:0000244|PDB:2AC3 |
| Q9HBH9 | 250 | 315 | 259 | 264 | Helix | Ontology_term=ECO:0000244;evidence=ECO:0000244|PDB:2AC3 |
| Q9HBH9 | 250 | 315 | 267 | 272 | Helix | Ontology_term=ECO:0000244;evidence=ECO:0000244|PDB:2AC3 |
| Q9HBH9 | 250 | 315 | 267 | 272 | Helix | Ontology_term=ECO:0000244;evidence=ECO:0000244|PDB:2AC3 |
| Q9HBH9 | 250 | 315 | 273 | 275 | Helix | Ontology_term=ECO:0000244;evidence=ECO:0000244|PDB:2AC3 |
| Q9HBH9 | 250 | 315 | 273 | 275 | Helix | Ontology_term=ECO:0000244;evidence=ECO:0000244|PDB:2AC3 |
| Q9HBH9 | 250 | 315 | 276 | 290 | Helix | Ontology_term=ECO:0000244;evidence=ECO:0000244|PDB:2AC3 |
| Q9HBH9 | 250 | 315 | 276 | 290 | Helix | Ontology_term=ECO:0000244;evidence=ECO:0000244|PDB:2AC3 |
| Q9HBH9 | 250 | 315 | 312 | 324 | Helix | Ontology_term=ECO:0000244;evidence=ECO:0000244|PDB:2AC3 |
| Q9HBH9 | 250 | 315 | 312 | 324 | Helix | Ontology_term=ECO:0000244;evidence=ECO:0000244|PDB:2AC3 |
Top |
|
| Gene expression level across TCGA pancancer |
 |
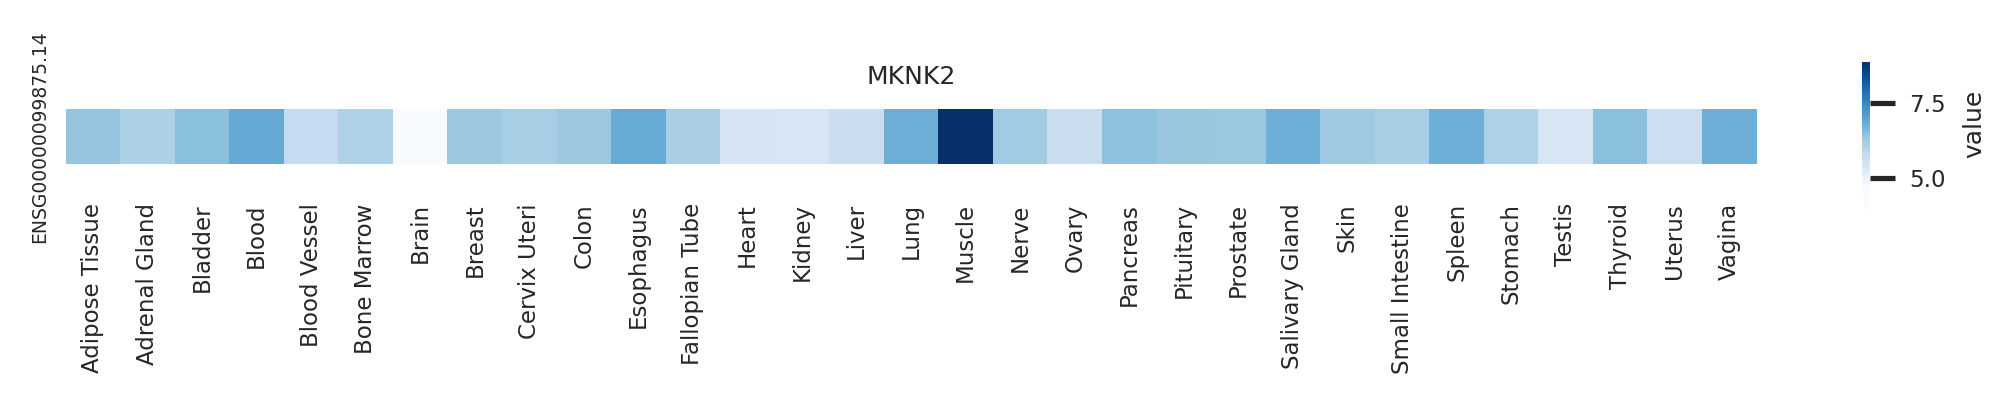
| Gene expression level across GTEx pantissue |
 |
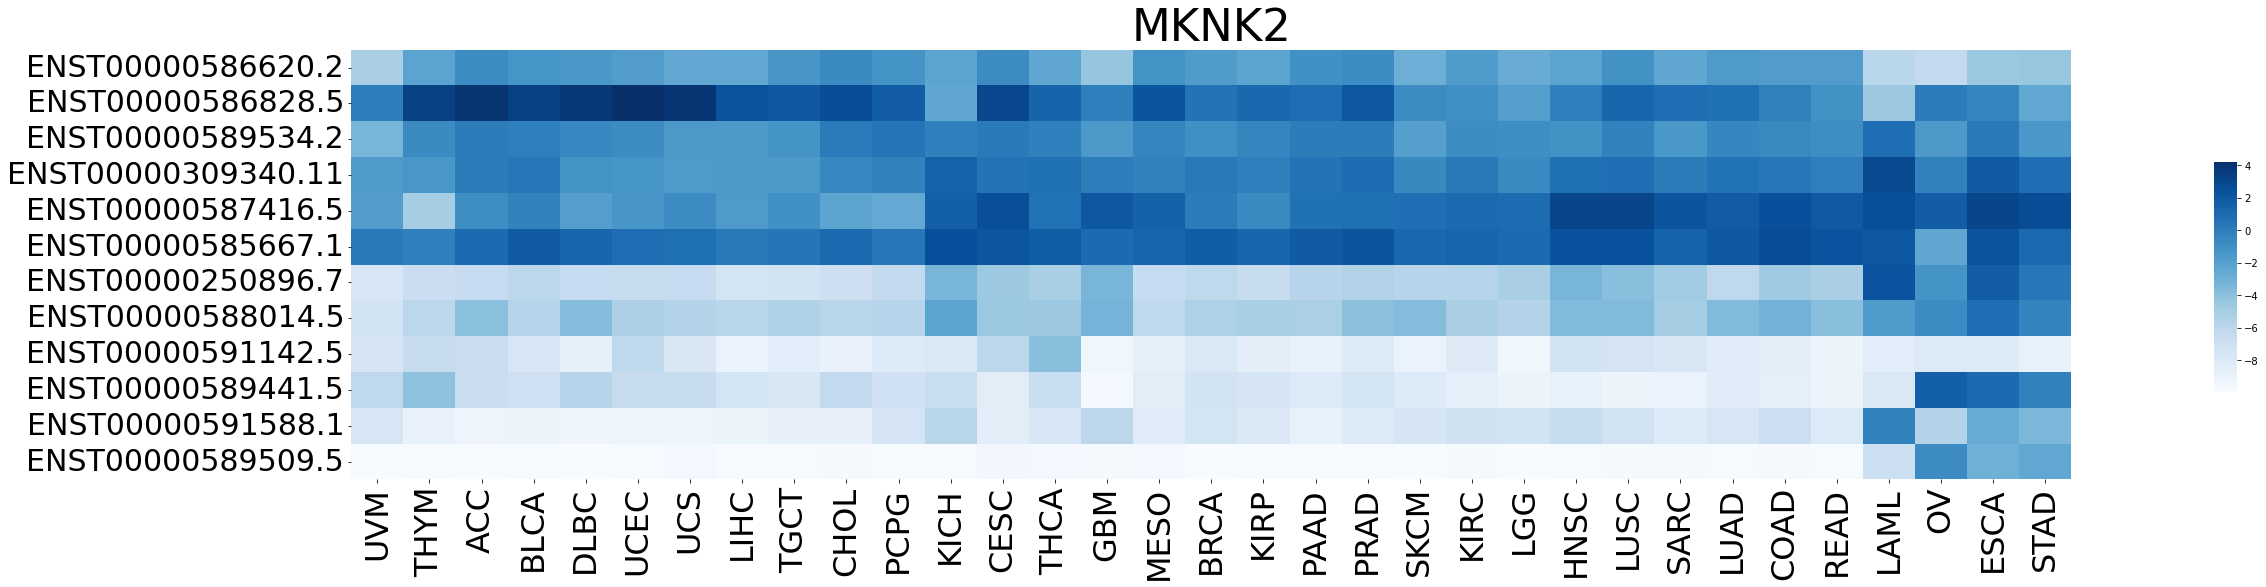
| Expression level of gene isoforms across TCGA pancancer |
 |
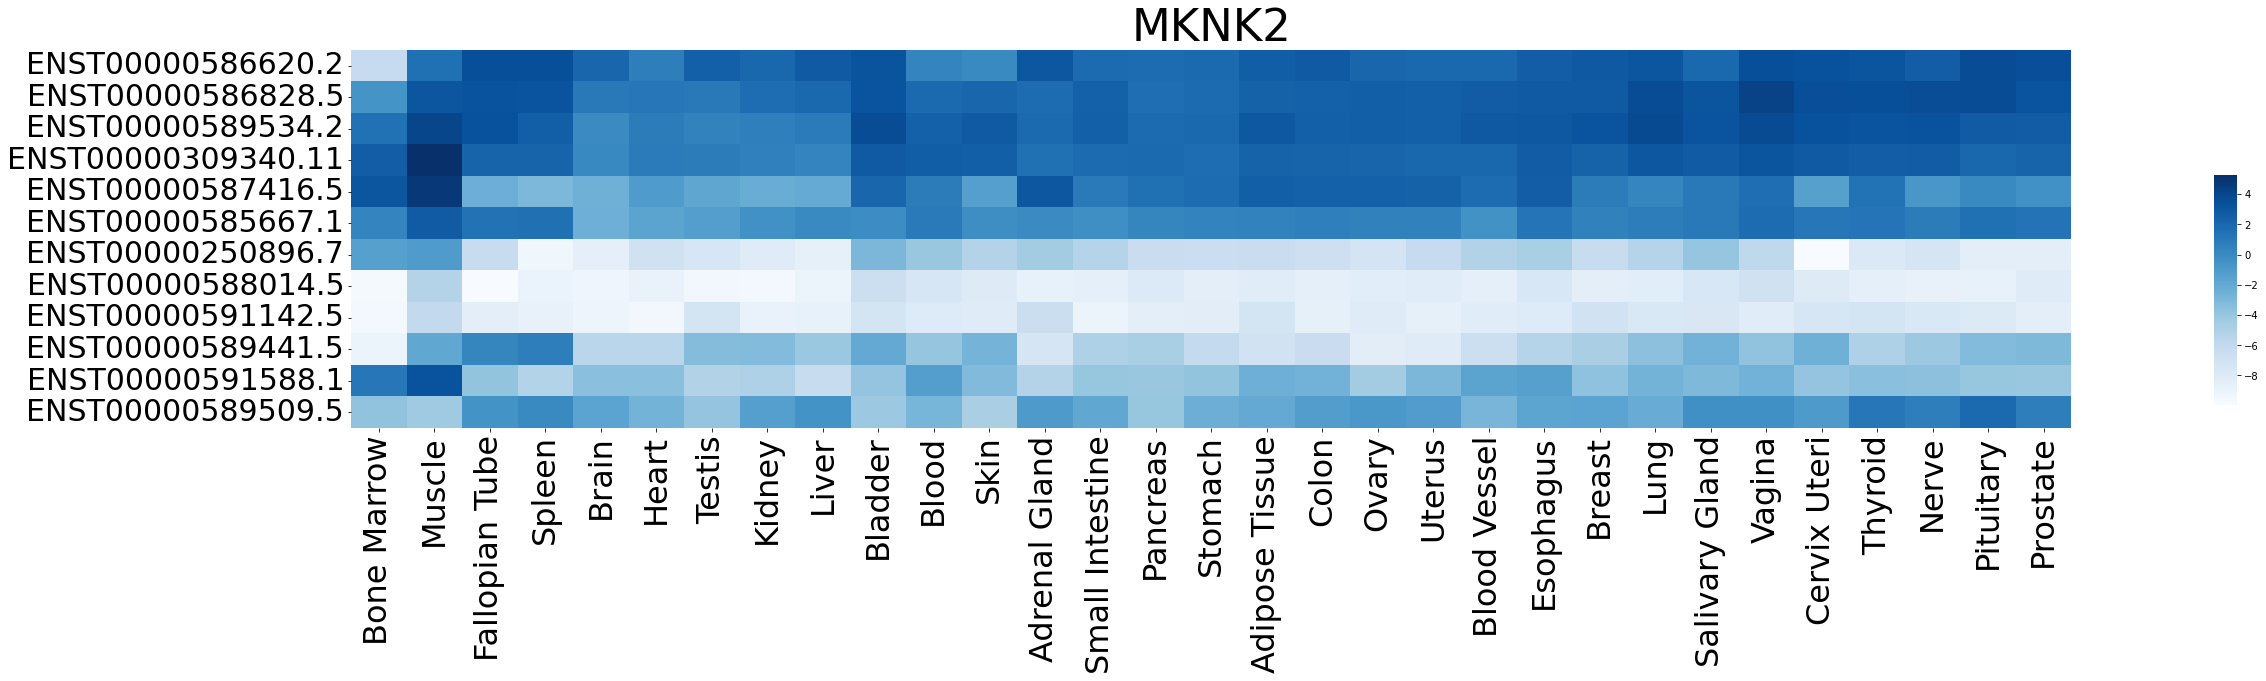
| Expression level of gene isoforms across GTEx pantissue |
 |
| Cancer(tissue) type-specific expression level of Translation factor using z-score distriution |
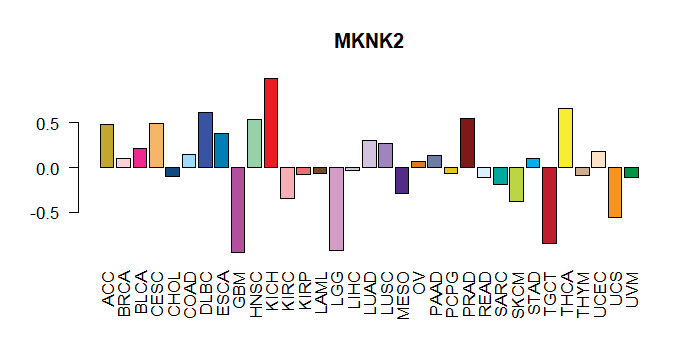 |
| Differential expression between tumor and matched normal (in the cancer types with more than 10 matched samples) |
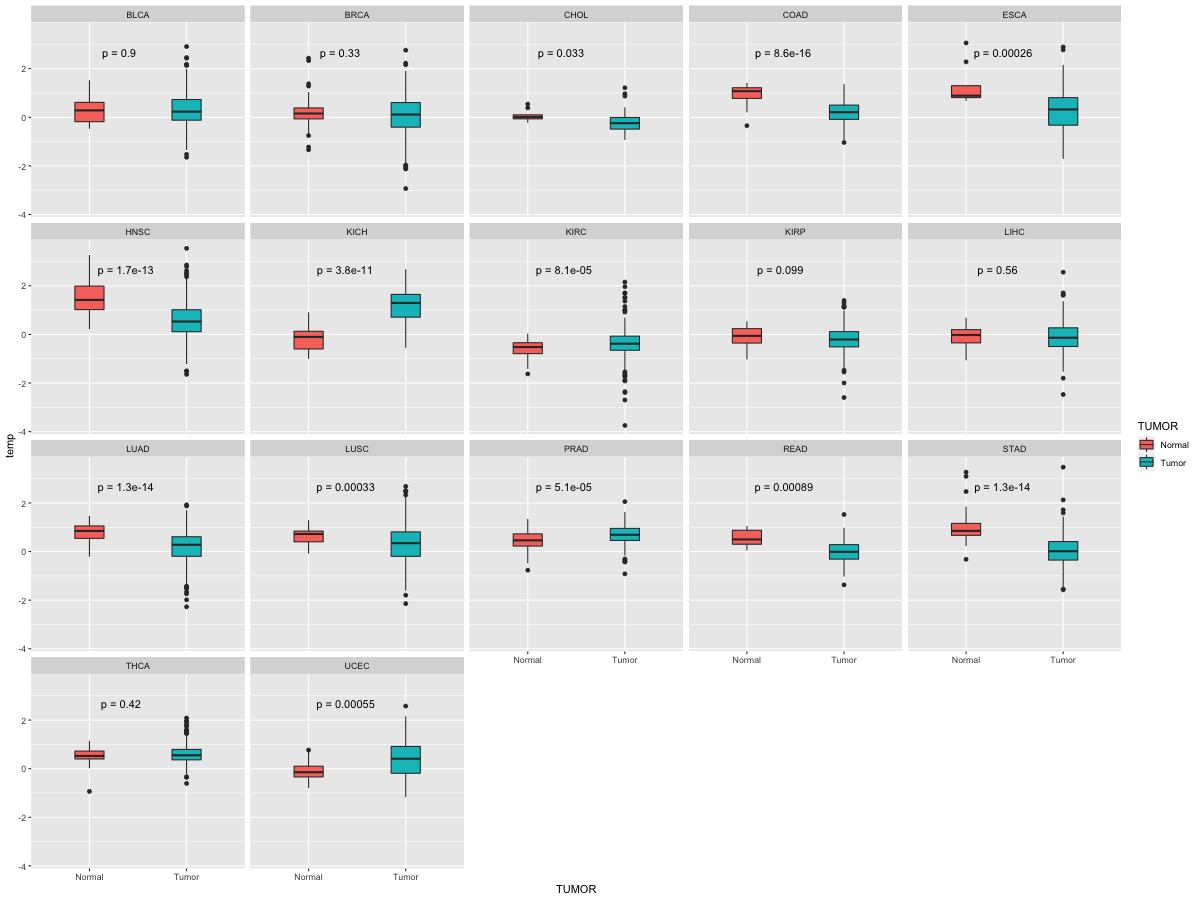 |
| Cancer type | Translation factor | FC | adj.pval |
| LUSC | MKNK2 | -1.00435001691645 | 0.00471185133936548 |
| ESCA | MKNK2 | -2.10810888803662 | 0.0068359375 |
| HNSC | MKNK2 | -1.43064910062775 | 1.00401621239144e-07 |
| LUAD | MKNK2 | -3.27370421058807 | 1.05528520885174e-08 |
| COAD | MKNK2 | -2.35247669824009 | 1.59740447998047e-05 |
| STAD | MKNK2 | -1.43850603759457 | 6.68526627123356e-05 |
Top |
|
| Translation factor expression regulation through miRNA binding |
| Cancer type | Gene | miRNA | TargetScan binding score (Context++ score percentile) | Coefficient | Pvalue |
| GBM | MKNK2 | hsa-miR-6766-3p | 85 | 1 | 0.0166666666666667 |
| OV | MKNK2 | hsa-miR-125b-5p | 72 | -0.447622300008537 | 0.000983975674341324 |
| UCEC | MKNK2 | hsa-miR-125a-5p | 64 | -0.394652406417112 | 0.0215963403964006 |
| UCEC | MKNK2 | hsa-miR-125b-5p | 72 | -0.380595874713522 | 0.0270830484891797 |
| Translation factor expression regulation through methylation in the promoter of Translation factor |
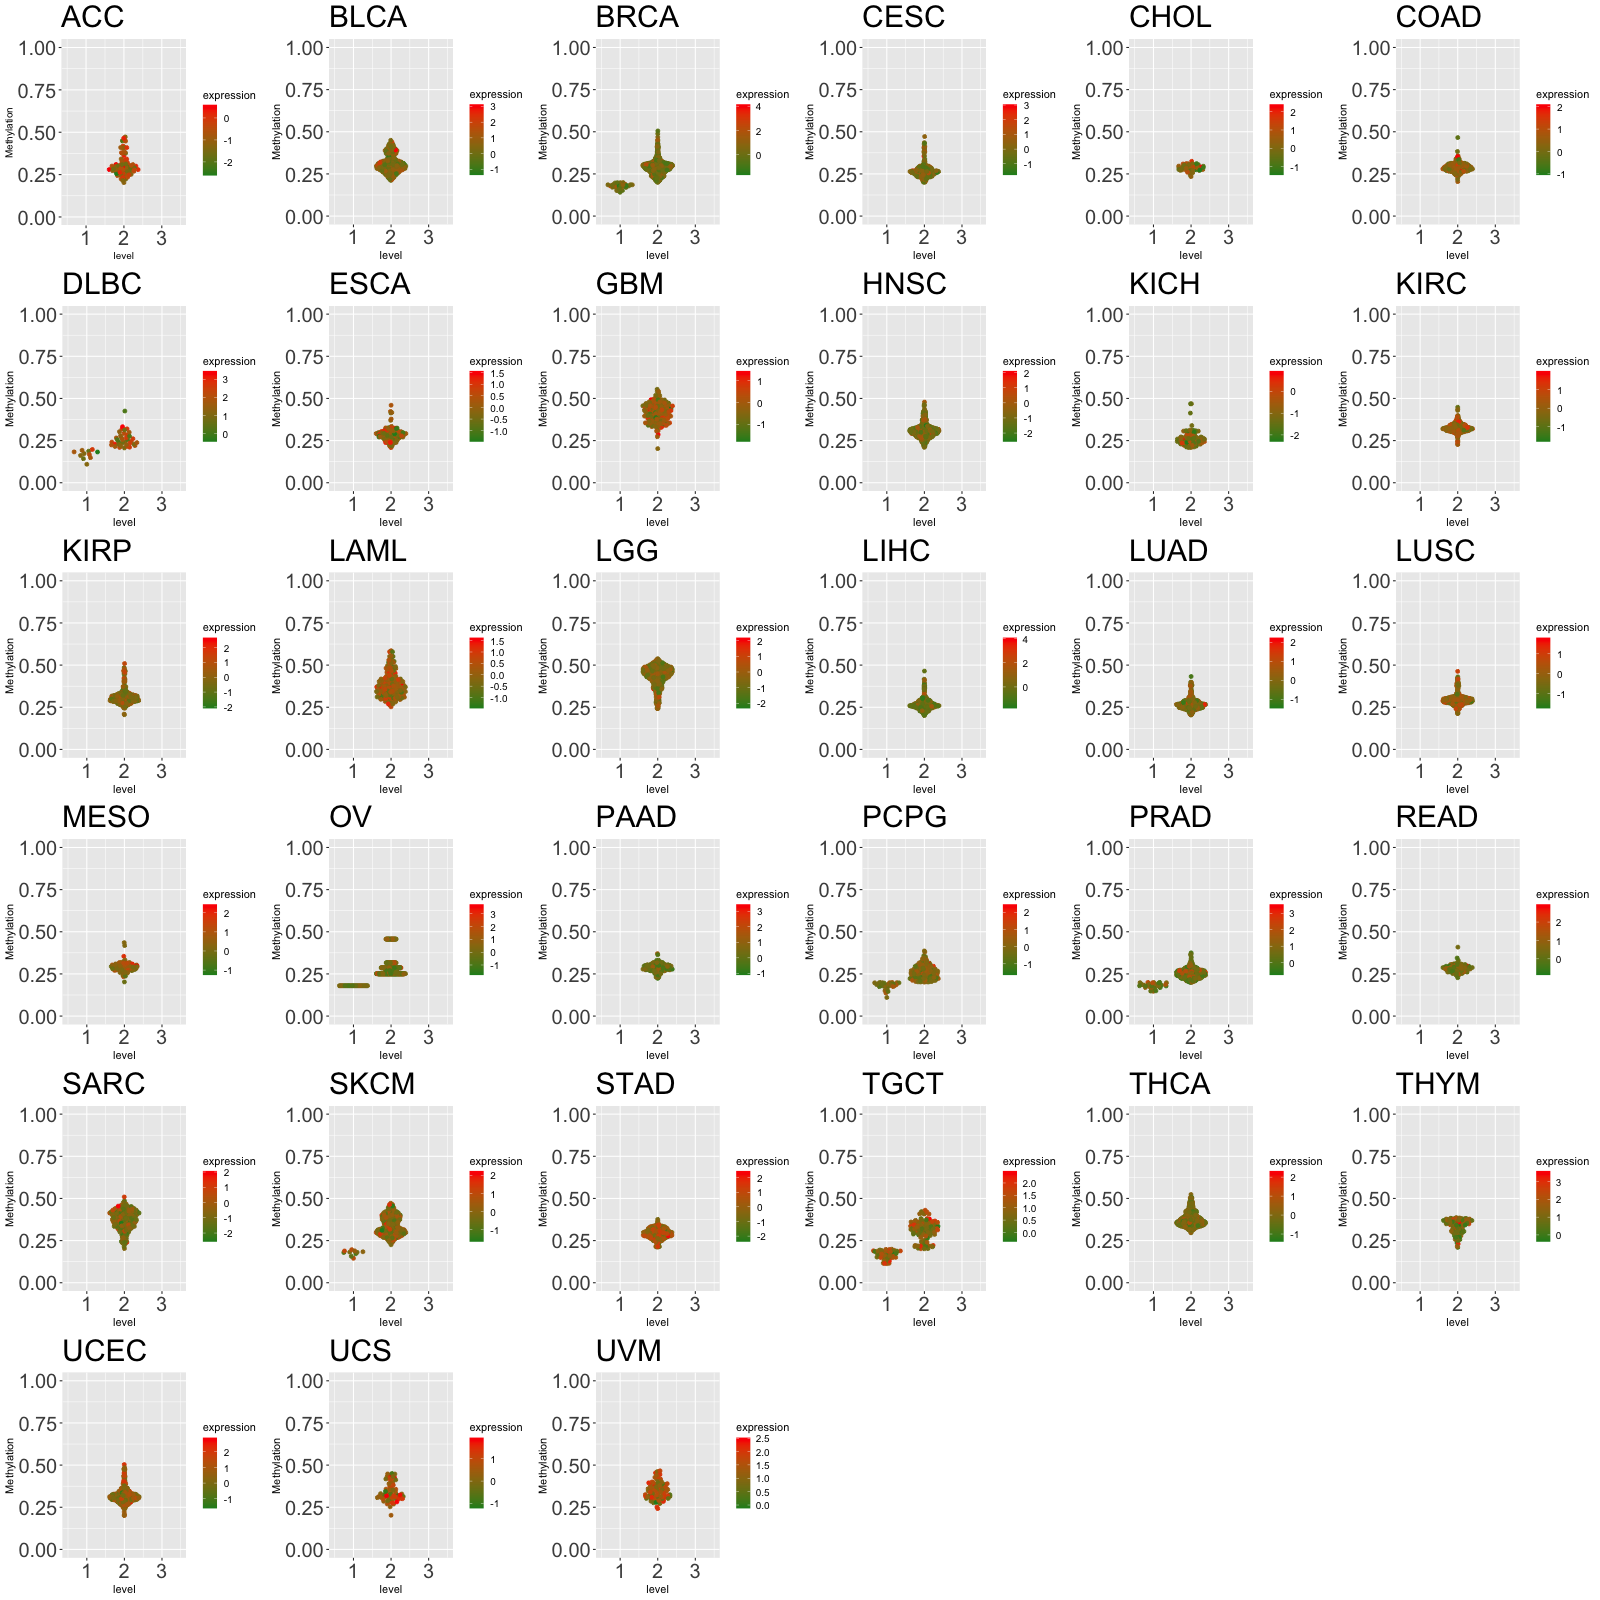 |
| Cancer type | Gene | methyl group b | methyl group a | DEG pval | avg methyl in b | avg methyl in a | avg exp in b | avg exp in a |
| Translation factor expression regulation through methylation in the gene body of Translation factor (positive regulation) |
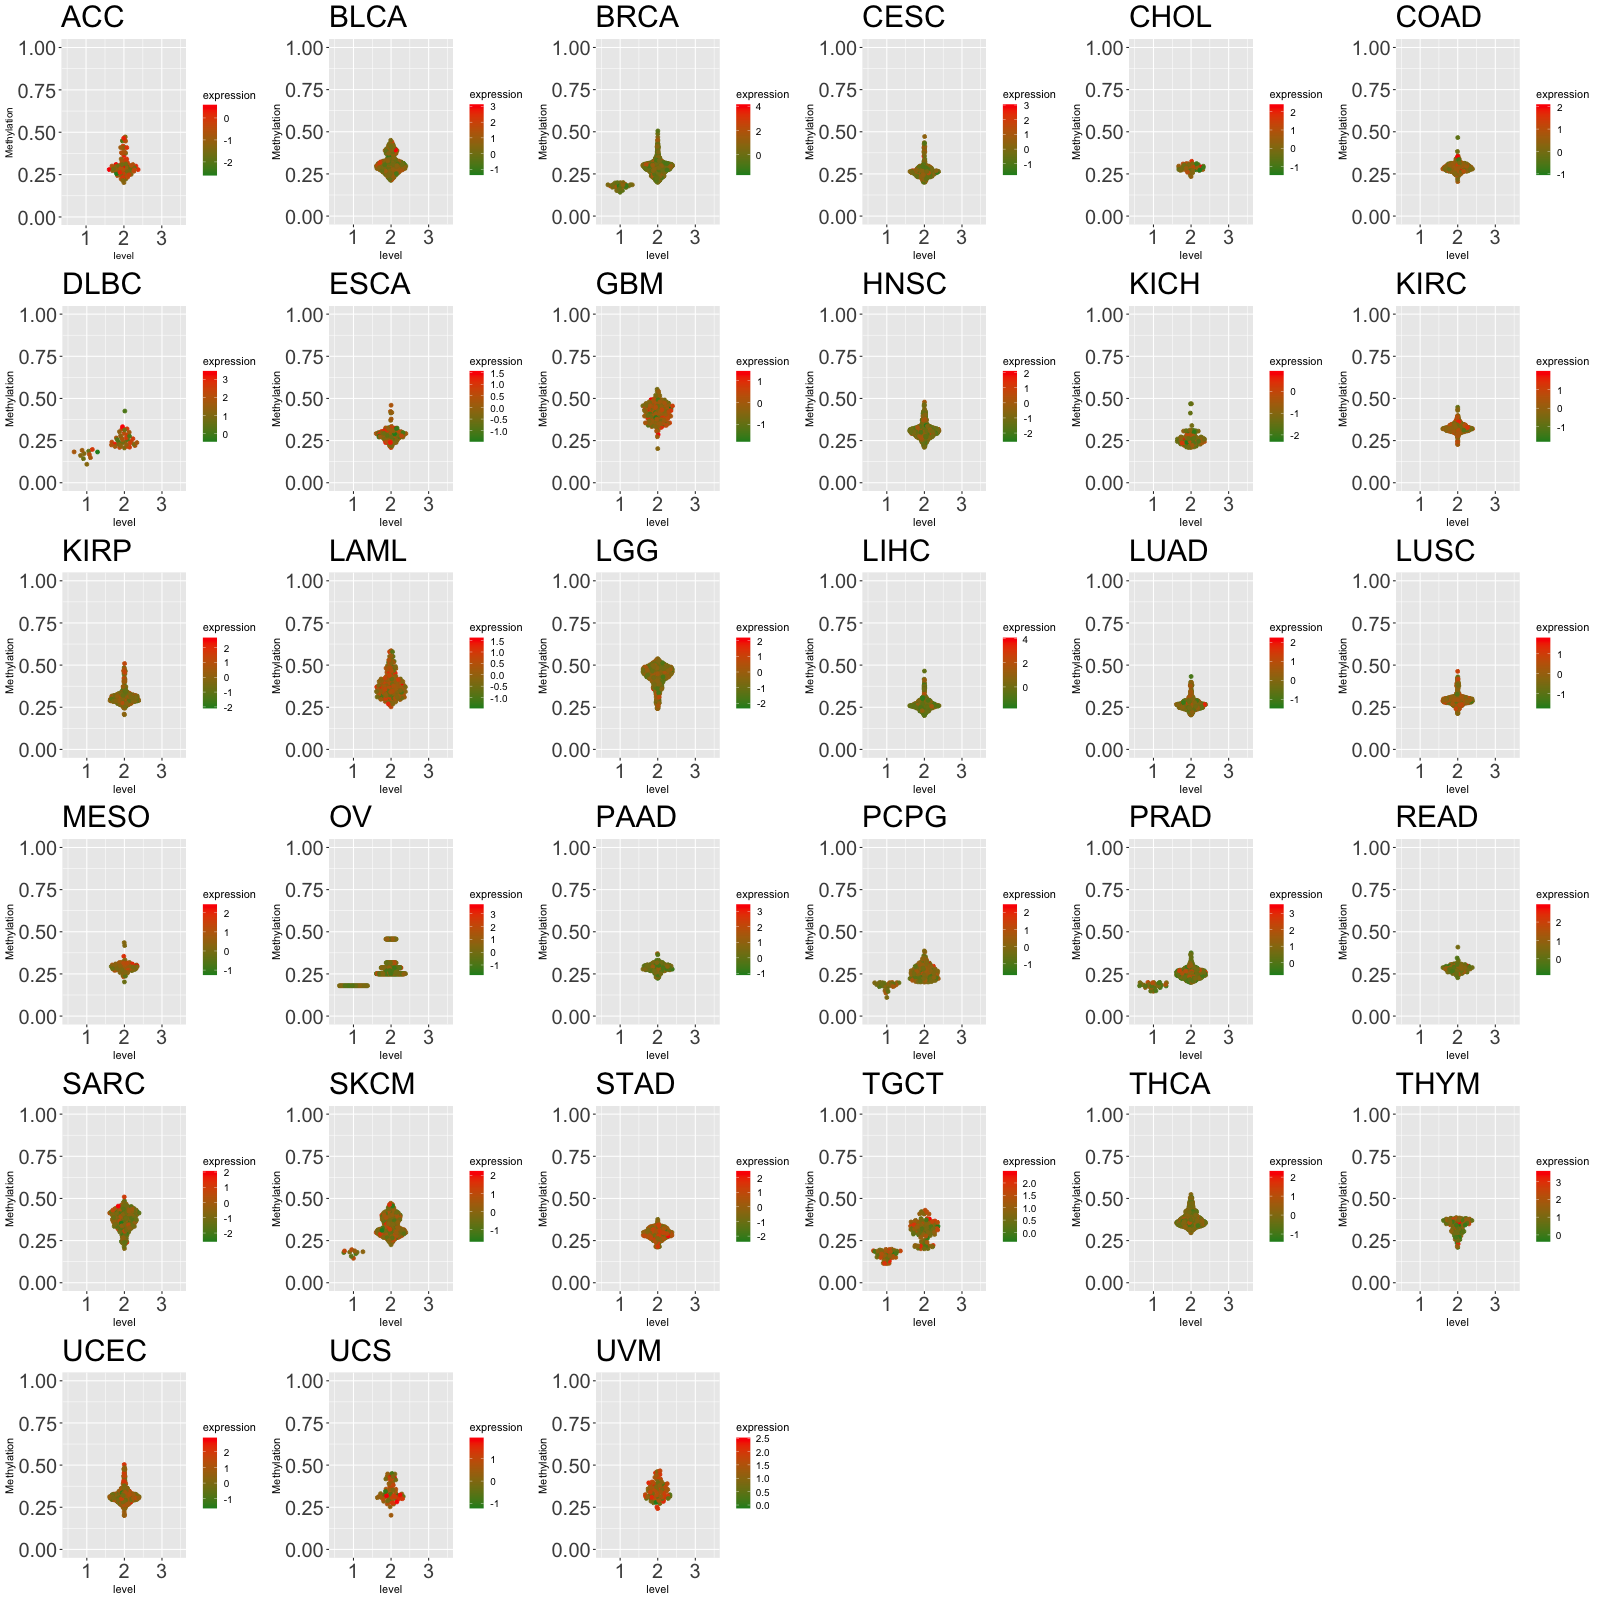 |
| Cancer type | Gene | methyl group b | methyl group a | DEG pval | avg methyl in b | avg methyl in a | avg exp in b | avg exp in a |
| SKCM | MKNK2 | 3 | 2 | 0.0248849255485273 | 0.662332159624413 | 0.389517343485618 | 0.301695883455292 | 0.451261937648395 |
| Translation factor expression regulation through copy number variation of Translation factor |
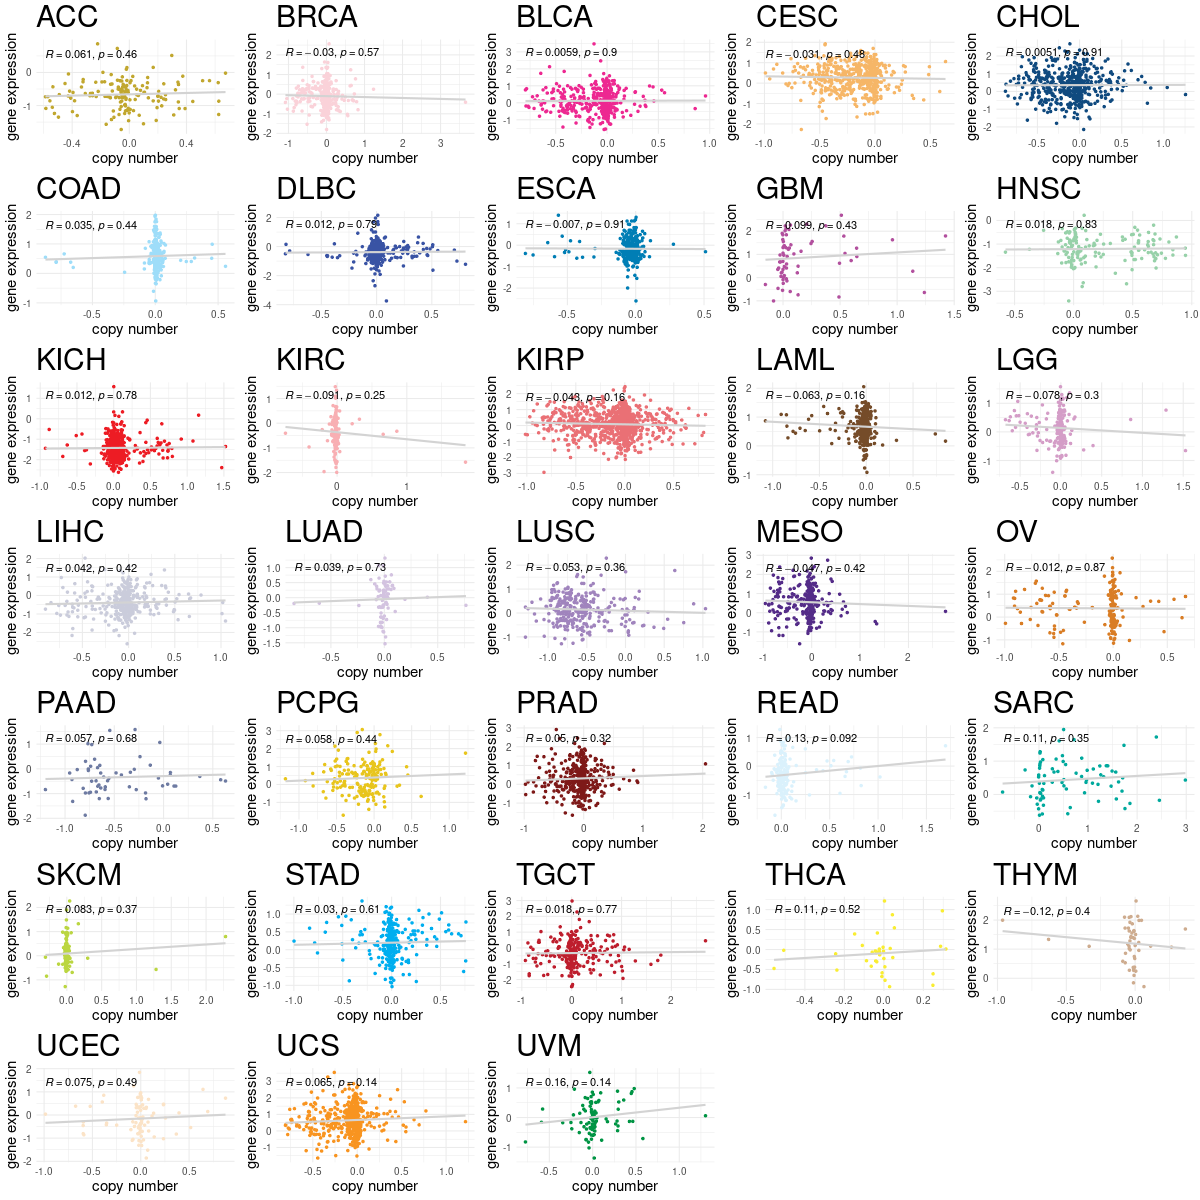 |
| Cancer type | Gene | Coefficient | Pvalue |
Top |
|
| Strongly correlated genes belong to cellular important gene groups with MKNK2 (coefficient>0.8, pval<0.05, node color based on FC between tumor and matched normal). Significantly associated important genes in the individual cancer types. * Cell metabolism gene: cell metabolism genes from REACTOME (black edge), IUPHAR: drug target genes from IUPHAR (blue edge), Kinase: human kinase genes (brown edge), CGC: cancer gene census genes (orange edge), TSG: tumor suppresor genes (purple edge), Epifactor: epigenetic factors (light blue edge), TF: transcription factors (green) |
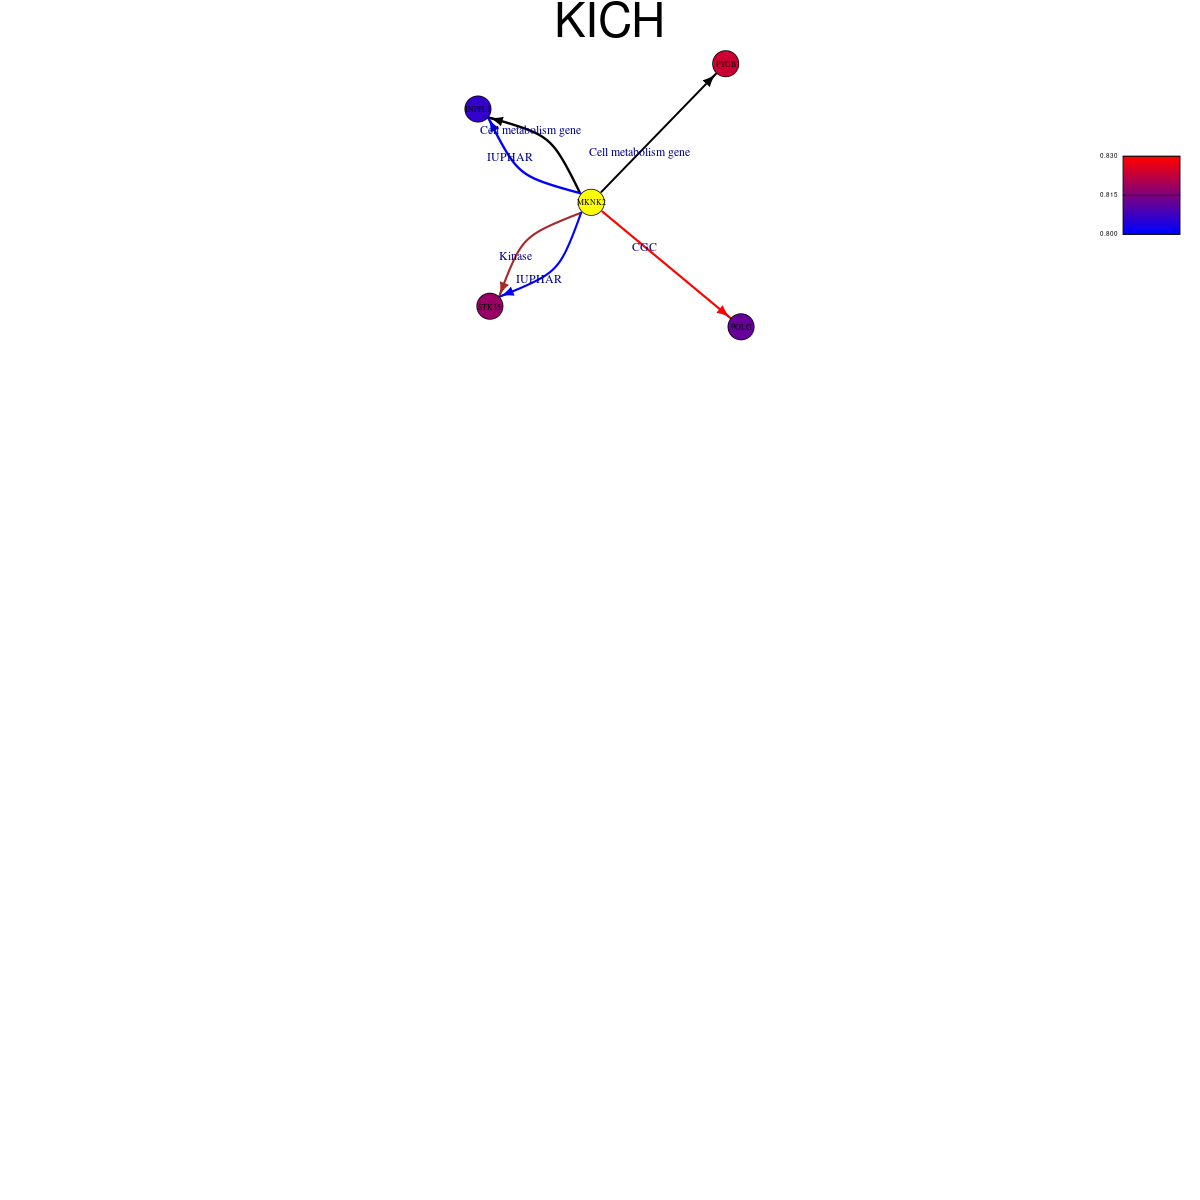 |
| Cancer type | Gene group | Translation factor | Correlated gene | Coefficient | Pvalue |
| KICH | Cell metabolism gene | MKNK2 | INPPL1 | 0.801885516 | 1.29E-21 |
| KICH | Cell metabolism gene | MKNK2 | PYGB | 0.832758781 | 1.41E-24 |
| KICH | CGC | MKNK2 | POLG | 0.818840392 | 3.59E-23 |
| KICH | IUPHAR | MKNK2 | INPPL1 | 0.801885516 | 1.29E-21 |
| KICH | IUPHAR | MKNK2 | STK35 | 0.821352061 | 2.04E-23 |
| KICH | Kinase | MKNK2 | STK35 | 0.821352061 | 2.04E-23 |
Top |
|
| Protein 3D structure Visit iCn3D. |
Top |
|
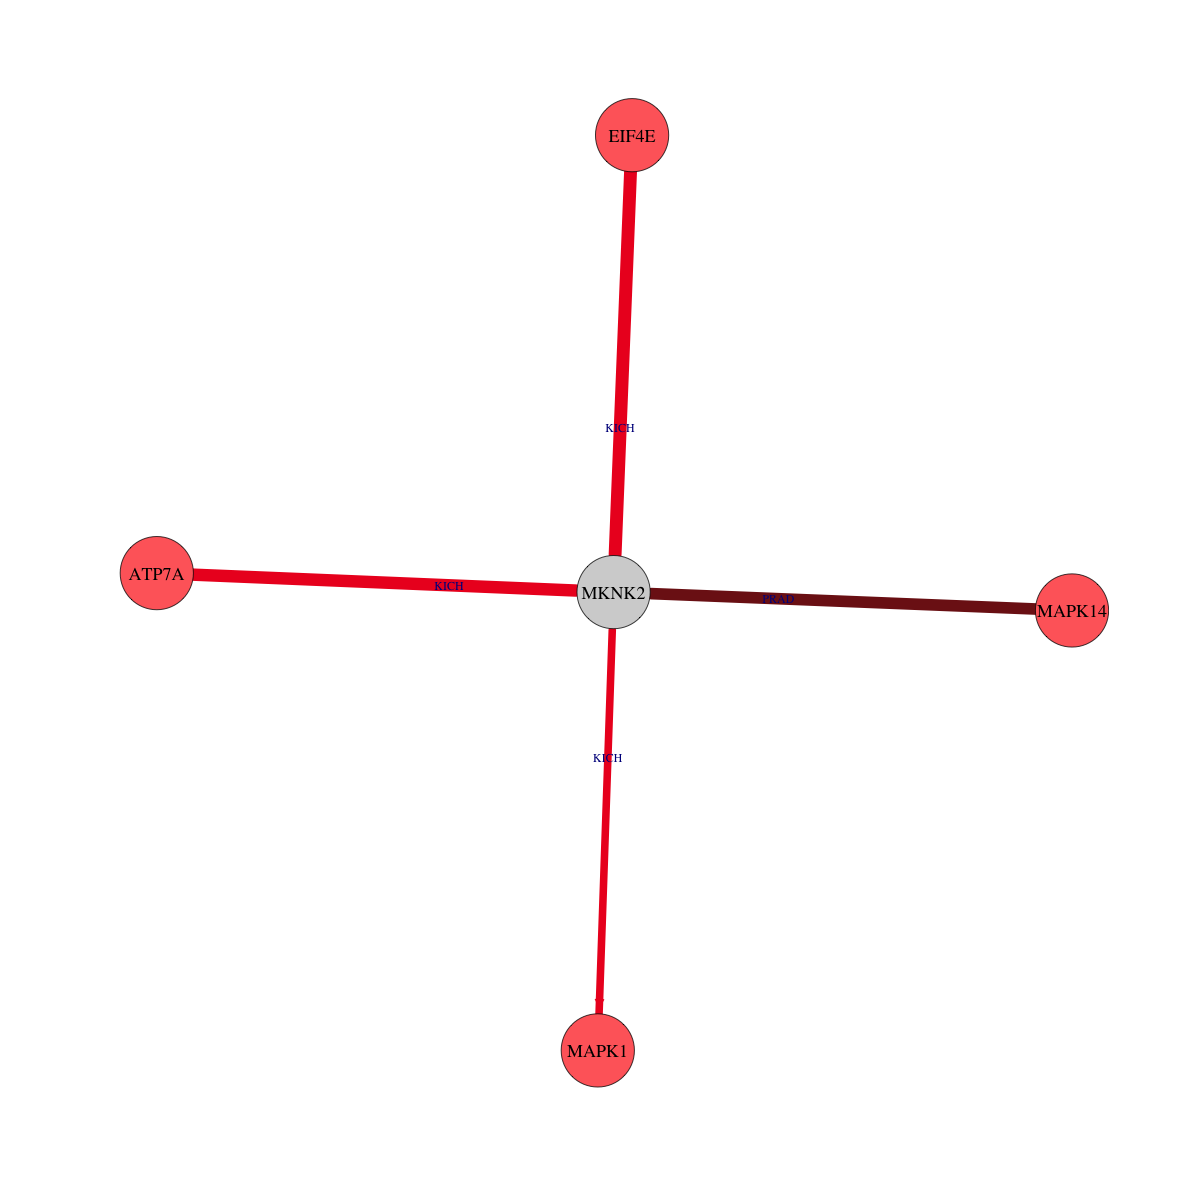
| Protein-protein interaction networks * Overlap between up-regulated DEGs (log2FC<-1 and adj.P<0.05) and STRING PPI network (center: Translation factor, node: DEGs, edges: weighted by -log2(adj.P)) |
 |
| Overlap between down-regulated DEGs (log2FC>1 and adj.P<0.05) and STRING PPI network (center: Translation factor, node: DEGs, edges: weighted by -log2(adj.P)) |
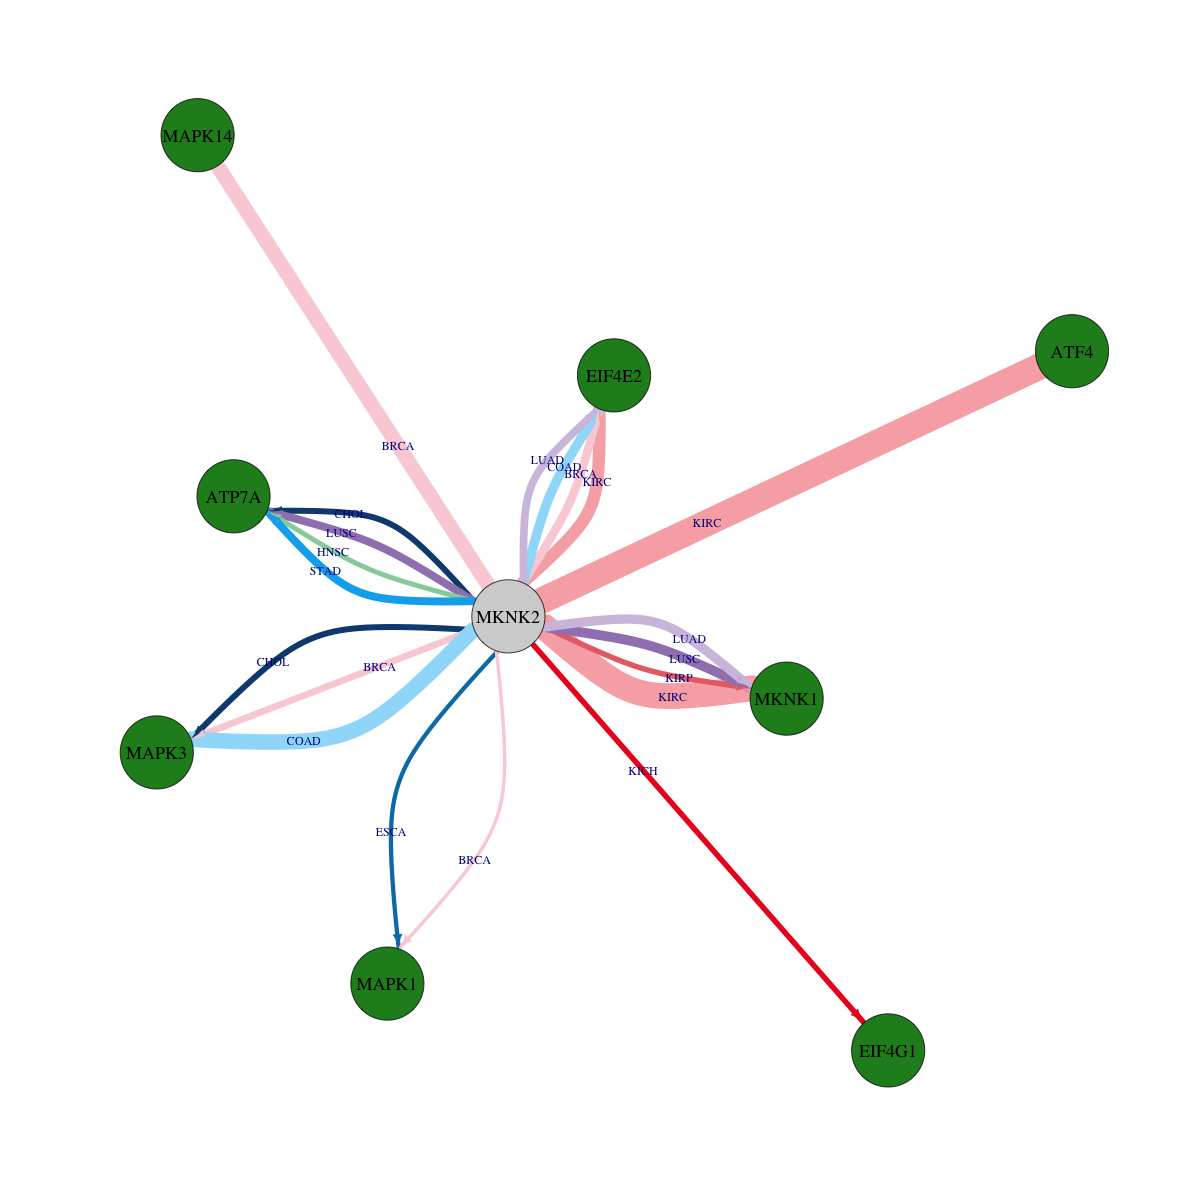 |
 * Edge colors based on TCGA cancer types. |
| * Overlap between DEGs (log2FC>1 and adj.P<0.05) and STRING PPI network per cancer (center: Translation factor, node: DEGs, node color: log2FC, edges: weighted by -log2(adj.P)) |
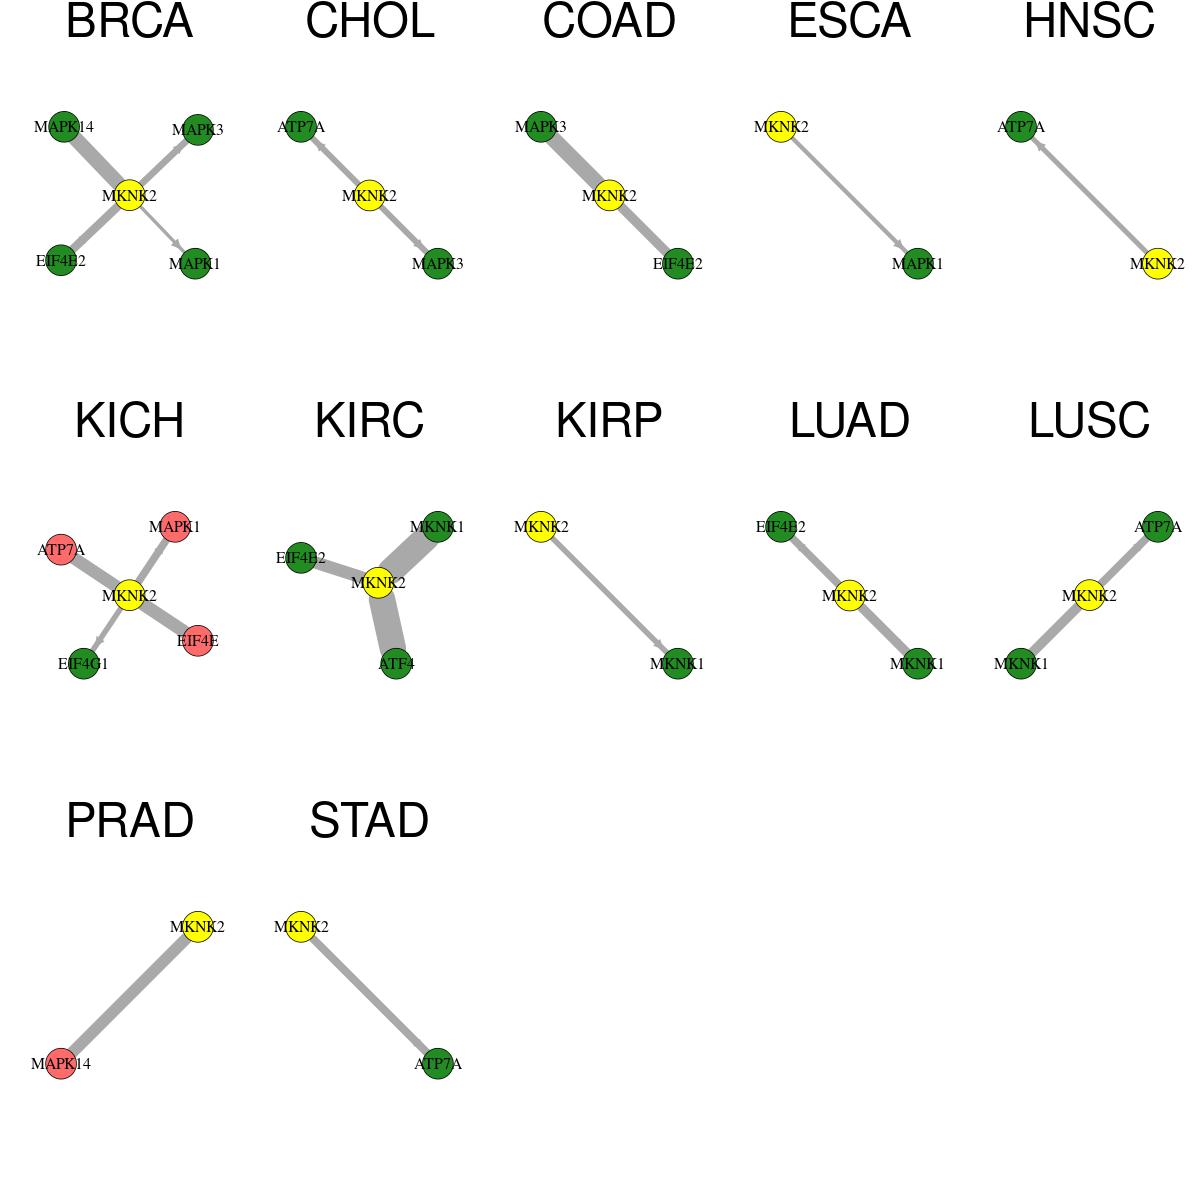 |
| Cancer type | Translation factor | Interacting protein coding gene | FC | adj.pval |
| LUSC | MKNK2 | MKNK1 | -1.7724058315911 | 0.000119179323433261 |
| COAD | MKNK2 | EIF4E2 | -1.6767866186069 | 0.000144809484481812 |
| LUAD | MKNK2 | MKNK1 | -1.64881335054025 | 0.000184346986492713 |
| BRCA | MKNK2 | EIF4E2 | -1.81299600715269 | 0.000370278590179521 |
| STAD | MKNK2 | ATP7A | -3.27464799491988 | 0.000657554250210524 |
| LUSC | MKNK2 | ATP7A | -1.33000555127291 | 0.000679097693381554 |
| LUAD | MKNK2 | EIF4E2 | -1.75169025615215 | 0.000823732994424591 |
| KICH | MKNK2 | MAPK1 | 1.27319002595358 | 0.000911891460418701 |
| BRCA | MKNK2 | MAPK3 | -1.61909976139263 | 0.00193136402459222 |
| CHOL | MKNK2 | ATP7A | -1.94531270875576 | 0.00390625 |
| CHOL | MKNK2 | MAPK3 | -1.54068193424676 | 0.00390625 |
| KIRP | MKNK2 | MKNK1 | -1.83550648151309 | 0.00608485564589501 |
| KICH | MKNK2 | EIF4G1 | -1.46656081150743 | 0.00612920522689819 |
| HNSC | MKNK2 | ATP7A | -3.96693658731539 | 0.00965754519575058 |
| ESCA | MKNK2 | MAPK1 | -1.17755474324053 | 0.0185546875 |
| BRCA | MKNK2 | MAPK1 | -1.67954875219151 | 0.0427276834041307 |
| KICH | MKNK2 | ATP7A | 2.04280252549023 | 1.0073184967041e-05 |
| KIRC | MKNK2 | EIF4E2 | -4.19473040895577 | 1.04336657477644e-05 |
| BRCA | MKNK2 | MAPK14 | -1.6928131480761 | 1.08867679255958e-06 |
| PRAD | MKNK2 | MAPK14 | 1.20273850965986 | 2.06740855708439e-05 |
| KIRC | MKNK2 | ATF4 | -2.05004013451381 | 2.37769366427877e-11 |
| KIRC | MKNK2 | MKNK1 | -1.36155431828684 | 4.53899662243056e-11 |
| COAD | MKNK2 | MAPK3 | -1.17173283146352 | 5.66244125366212e-07 |
| KICH | MKNK2 | EIF4E | 1.61675210562671 | 6.55651092529297e-06 |
| Protein-protein interactors with this translation factor (BIOGRID-3.4.160) |
| PPI interactors with MKNK2 |
| EIF4G1, MAPK1, ESR2, MAPK14, RPL7A, ELAVL1, RBX1, VHL, CUL2, VBP1, MAPK8, CSTF2, MIF, RBM4, VCL, BAG6, SYMPK, KHSRP, NOLC1, WDR46, USP15, TRAP1, CELF1, NUDT21, WWP2, EXOC3, RAB11FIP2, PLXNA3, HAUS7, ADCK1, RBM26, BHLHE41, ZCCHC6, ZMYM1, CD99L2, MRRF, TICAM1, RICTOR, TRIM25, CUL4B, MESDC2, PSMA1, DDX58, |
Top |
|
| Clinically associated variants from ClinVar. |
| Gene | Chr | Position | RefSeq | VarSeq | RefSeeq | VarType | Pathogenic | Disease | VarInfo |
| MKNK2 | chr19 | 2042040 | G | A | single_nucleotide_variant | Benign | not_provided | SO:0001627|intron_variant | SO:0001627|intron_variant |
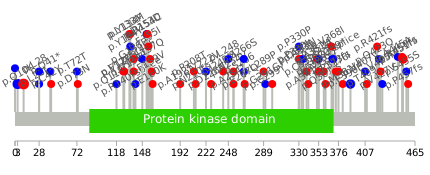
| nsSNVs with sample frequency (size of circle) from TCGA 33 cancers. |
 |
| SNVs and Indels |
| Gene | Cancer type | Chromosome | Start | End | RefSeeq | MutSeq | Mutation type | AAchange | # samples |
| Copy number variation (CNV) of MKNK2 * Click on the image to open the original image in a new window. |
 |
| Fusion gene breakpoints (product of the structural variants (SVs)) across MKNK2 * Click on the image to open the UCSC genome browser with custom track showing this image in a new window. |
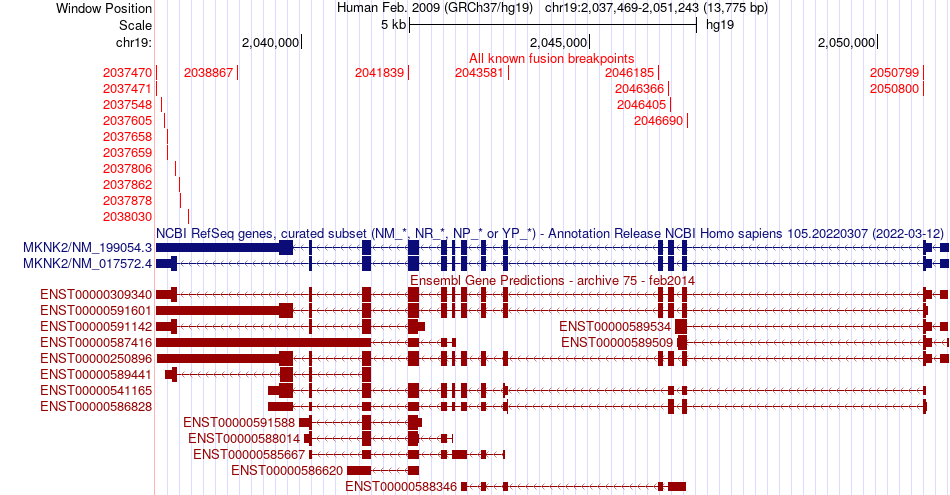 |
| Fusion genes with this translation factor from FusionGDB2.0. |
| FusionGDB2 ID | Disease | Sample | Hgene | Hchr | Hbp | Hstrand | Tgene | Tchr | Tbp | Tstrand |
| 77950 | Non-Cancer | ERR188200 | BTBD2 | chr19 | 2013546 | - | MKNK2 | chr19 | 2043581 | - |
| 77950 | Non-Cancer | ERR188200 | BTBD2 | chr19 | 2015296 | - | MKNK2 | chr19 | 2043581 | - |
| 77950 | N/A | BM145378 | CACNA2D3 | chr3 | 54576003 | + | MKNK2 | chr19 | 2037470 | + |
| 77950 | ESCA | TCGA-L5-A891 | ELL | chr19 | 18569014 | - | MKNK2 | chr19 | 2046690 | - |
| 77950 | ESCA | TCGA-L5-A891 | ELL | chr19 | 18569015 | - | MKNK2 | chr19 | 2046690 | - |
| 77950 | Non-Cancer | ERR315460 | HEATR1 | chr1 | 236713872 | - | MKNK2 | chr19 | 2037806 | - |
| 77950 | N/A | BE720244 | KCNK1 | chr1 | 233802576 | + | MKNK2 | chr19 | 2046405 | + |
| 102739 | OV | TCGA-09-1666 | MKNK2 | chr19 | 2050799 | - | AP3D1 | chr19 | 2102267 | - |
| 102739 | OV | TCGA-09-1666-01A | MKNK2 | chr19 | 2050800 | - | AP3D1 | chr19 | 2102267 | - |
| 78778 | STAD | TCGA-BR-A4IY-01A | MKNK2 | chr19 | 2037605 | - | CNDP2 | chr18 | 72180929 | + |
| 100130 | N/A | BQ027252 | MKNK2 | chr19 | 2037658 | + | CRK | chr17 | 1335764 | + |
| 86725 | BRCA | TCGA-EW-A1PA-01A | MKNK2 | chr19 | 2046185 | - | FAM151A | chr1 | 55076228 | - |
| 77950 | N/A | BU674802 | MKNK2 | chr19 | 2037548 | + | MKNK2 | chr19 | 2037605 | - |
| 101825 | N/A | AI096463 | MKNK2 | chr19 | 2037862 | + | ORC3 | chr6 | 88306179 | - |
| 54111 | N/A | BM148315 | MKNK2 | chr19 | 2037659 | + | PANK4 | chr1 | 2439977 | + |
| 81649 | LAML | TCGA-AB-2897-03A | MKNK2 | chr19 | 2041839 | - | RNF126 | chr19 | 652884 | - |
| 89828 | N/A | BF765876 | MKNK2 | chr19 | 2038867 | + | TOR1AIP2 | chr1 | 179846934 | - |
| 98677 | N/A | BM765288 | MKNK2 | chr19 | 2038030 | - | UBAC2 | chr13 | 100037910 | + |
| 102392 | ESCA | TCGA-L5-A8NR | MKNK2 | chr19 | 2050799 | - | WIZ | chr19 | 15538344 | - |
| 100444 | BRCA | TCGA-BH-A1FD-01A | MKNK2 | chr19 | 2046366 | - | ZFR2 | chr19 | 3852612 | - |
| 77950 | Non-Cancer | ERR315404 | OAZ1 | chr19 | 2269743 | + | MKNK2 | chr19 | 2043581 | - |
| 77951 | N/A | BQ351516 | RPS4Y1 | chrY | 2733263 | + | MKNK2 | chr19 | 2037878 | + |
Top |
|
| Kaplan-Meier plots with logrank tests of overall survival (OS) |
 |
| Cancer type | Translation factor | Coefficent | Hazard ratio | Wald test pval | Likelihool ratio pval | Logrank test pval | # samples |
Top |
|
| Differential gene expression between female and male. (Wilcoxon test, pval<0.05) |
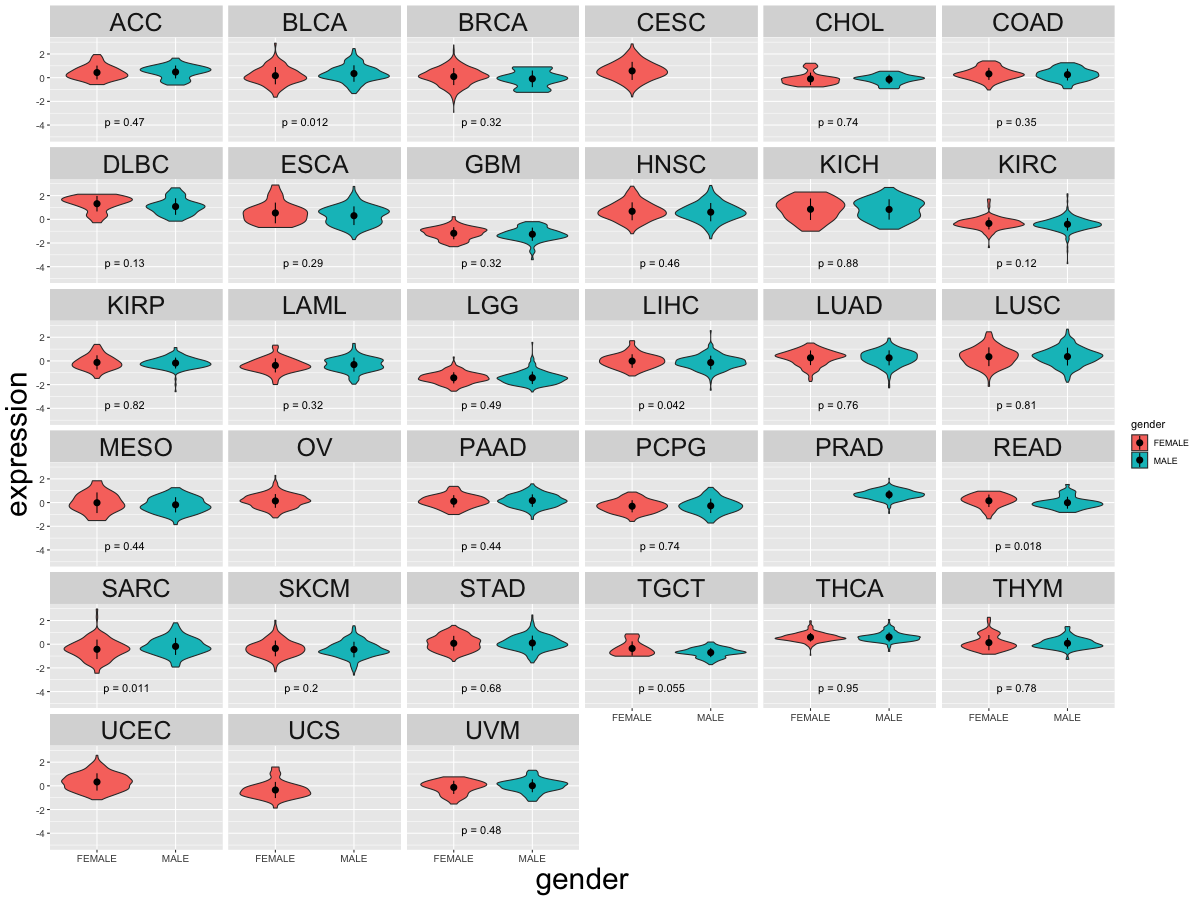 |
| Cancer type | Translation factor | pval | adj.p |
| SARC | MKNK2 | 0.0110322777542027 | 0.31 |
| BLCA | MKNK2 | 0.0116132016229315 | 0.31 |
| READ | MKNK2 | 0.0183777549138365 | 0.48 |
| LIHC | MKNK2 | 0.0421897392659084 | 1 |
Top |
|
| Differential gene expression between young and old age groups (Wilcoxon test, pval<0.05) |
 |
| Cancer type | Translation factor | pval | adj.p |
| GBM | MKNK2 | 0.0171176601652299 | 0.53 |
| LAML | MKNK2 | 0.0468833752476663 | 1 |
| OV | MKNK2 | 0.00425661809340315 | 0.14 |
| SARC | MKNK2 | 0.0114521140530583 | 0.37 |
Top |
|
| Drugs targeting genes involved in this translation factor. (DrugBank Version 5.1.8 2021-05-08) |
| UniProtAcc | DrugBank ID | Drug name | Drug activity | Drug type | Drug status |
Top |
|
| Diseases associated with this translation factor. (DisGeNet 4.0) |
| Disease ID | Disease Name | # PubMeds | Disease source |
 Copyright 2021-Present -The University of Texas Health Science Center at Houston
(UTHealth)
Web File Viewing | Emergency Information |Campus Carry|Site Policies