
|
||||||
|
 | Fusion Gene Summary |
| Fusion Gene ORF analysis |
| Fusion Genomic Features |
| Fusion Protein Features |
| Fusion Gene Sequence |
| Fusion Gene PPI analysis |
| Related Drugs |
| Related Diseases |
Fusion gene:MTOR-LIPE-AS1 (FusionGDB2 ID:55848) |
Fusion Gene Summary for MTOR-LIPE-AS1 |
 Fusion gene summary Fusion gene summary |
| Fusion gene information | Fusion gene name: MTOR-LIPE-AS1 | Fusion gene ID: 55848 | Hgene | Tgene | Gene symbol | MTOR | LIPE-AS1 | Gene ID | 2475 | 100996307 |
| Gene name | mechanistic target of rapamycin kinase | LIPE antisense RNA 1 | |
| Synonyms | FRAP|FRAP1|FRAP2|RAFT1|RAPT1|SKS | - | |
| Cytomap | 1p36.22 | 19q13.2 | |
| Type of gene | protein-coding | ncRNA | |
| Description | serine/threonine-protein kinase mTORFK506 binding protein 12-rapamycin associated protein 2FK506-binding protein 12-rapamycin complex-associated protein 1FKBP-rapamycin associated proteinFKBP12-rapamycin complex-associated protein 1mammalian target o | CTB-50E14.6 | |
| Modification date | 20200329 | 20200313 | |
| UniProtAcc | P42345 | . | |
| Ensembl transtripts involved in fusion gene | ENST00000361445, ENST00000376838, ENST00000495435, | ENST00000457234, ENST00000593491, ENST00000593740, ENST00000594624, ENST00000594688, ENST00000596116, ENST00000597203, ENST00000599276, | |
| Fusion gene scores | * DoF score | 11 X 13 X 7=1001 | 7 X 8 X 1=56 |
| # samples | 13 | 8 | |
| ** MAII score | log2(13/1001*10)=-2.94485844580754 possibly effective Gene in Pan-Cancer Fusion Genes (peGinPCFGs). DoF>8 and MAII<0 | log2(8/56*10)=0.514573172829758 effective Gene in Pan-Cancer Fusion Genes (eGinPCFGs). DoF>8 and MAII>0 | |
| Context | PubMed: MTOR [Title/Abstract] AND LIPE-AS1 [Title/Abstract] AND fusion [Title/Abstract] | ||
| Most frequent breakpoint | MTOR(11315075)-LIPE-AS1(42905110), # samples:1 | ||
| Anticipated loss of major functional domain due to fusion event. | |||
| * DoF score (Degree of Frequency) = # partners X # break points X # cancer types ** MAII score (Major Active Isofusion Index) = log2(# samples/DoF score*10) |
| Gene ontology of each fusion partner gene with evidence of Inferred from Direct Assay (IDA) from Entrez |
| Partner | Gene | GO ID | GO term | PubMed ID |
| Hgene | MTOR | GO:0001558 | regulation of cell growth | 18762023 |
| Hgene | MTOR | GO:0001934 | positive regulation of protein phosphorylation | 20233713 |
| Hgene | MTOR | GO:0006468 | protein phosphorylation | 12150926|15467718|18925875 |
| Hgene | MTOR | GO:0009267 | cellular response to starvation | 28223137 |
| Hgene | MTOR | GO:0010507 | negative regulation of autophagy | 30704899 |
| Hgene | MTOR | GO:0016242 | negative regulation of macroautophagy | 25327288 |
| Hgene | MTOR | GO:0016310 | phosphorylation | 11853878|25327288 |
| Hgene | MTOR | GO:0031667 | response to nutrient levels | 29750193 |
| Hgene | MTOR | GO:0034198 | cellular response to amino acid starvation | 22424946 |
| Hgene | MTOR | GO:0038202 | TORC1 signaling | 28223137 |
| Hgene | MTOR | GO:0043200 | response to amino acid | 18497260 |
| Hgene | MTOR | GO:0045727 | positive regulation of translation | 18762023 |
| Hgene | MTOR | GO:0046777 | protein autophosphorylation | 15467718 |
| Hgene | MTOR | GO:0071230 | cellular response to amino acid stimulus | 22424946 |
| Hgene | MTOR | GO:0071233 | cellular response to leucine | 22424946 |
| Hgene | MTOR | GO:1990253 | cellular response to leucine starvation | 22424946 |
| Fusion gene breakpoints across MTOR (5'-gene) * Click on the image to open the UCSC genome browser with custom track showing this image in a new window. |
| Fusion gene breakpoints across LIPE-AS1 (3'-gene) * Click on the image to open the UCSC genome browser with custom track showing this image in a new window. |
| Fusion gene information from two resources (ChiTars 5.0 and ChimerDB 4.0) * All genome coordinats were lifted-over on hg19. * Click on the break point to see the gene structure around the break point region using the UCSC Genome Browser. |
| Source | Disease | Sample | Hgene | Hchr | Hbp | Hstrand | Tgene | Tchr | Tbp | Tstrand |
| ChiTaRS5.0 | N/A | BE149450 | MTOR | chr1 | 11315075 | + | LIPE-AS1 | chr19 | 42905110 | + |
Top |
Fusion Gene ORF analysis for MTOR-LIPE-AS1 |
| Open reading frame (ORF) analsis of fusion genes based on Ensembl gene isoform structure. * Click on the break point to see the gene structure around the break point region using the UCSC Genome Browser. |
| ORF | Henst | Tenst | Hgene | Hchr | Hbp | Hstrand | Tgene | Tchr | Tbp | Tstrand |
| intron-intron | ENST00000361445 | ENST00000457234 | MTOR | chr1 | 11315075 | + | LIPE-AS1 | chr19 | 42905110 | + |
| intron-intron | ENST00000361445 | ENST00000593491 | MTOR | chr1 | 11315075 | + | LIPE-AS1 | chr19 | 42905110 | + |
| intron-intron | ENST00000361445 | ENST00000593740 | MTOR | chr1 | 11315075 | + | LIPE-AS1 | chr19 | 42905110 | + |
| intron-intron | ENST00000361445 | ENST00000594624 | MTOR | chr1 | 11315075 | + | LIPE-AS1 | chr19 | 42905110 | + |
| intron-intron | ENST00000361445 | ENST00000594688 | MTOR | chr1 | 11315075 | + | LIPE-AS1 | chr19 | 42905110 | + |
| intron-intron | ENST00000361445 | ENST00000596116 | MTOR | chr1 | 11315075 | + | LIPE-AS1 | chr19 | 42905110 | + |
| intron-intron | ENST00000361445 | ENST00000597203 | MTOR | chr1 | 11315075 | + | LIPE-AS1 | chr19 | 42905110 | + |
| intron-intron | ENST00000361445 | ENST00000599276 | MTOR | chr1 | 11315075 | + | LIPE-AS1 | chr19 | 42905110 | + |
| intron-intron | ENST00000376838 | ENST00000457234 | MTOR | chr1 | 11315075 | + | LIPE-AS1 | chr19 | 42905110 | + |
| intron-intron | ENST00000376838 | ENST00000593491 | MTOR | chr1 | 11315075 | + | LIPE-AS1 | chr19 | 42905110 | + |
| intron-intron | ENST00000376838 | ENST00000593740 | MTOR | chr1 | 11315075 | + | LIPE-AS1 | chr19 | 42905110 | + |
| intron-intron | ENST00000376838 | ENST00000594624 | MTOR | chr1 | 11315075 | + | LIPE-AS1 | chr19 | 42905110 | + |
| intron-intron | ENST00000376838 | ENST00000594688 | MTOR | chr1 | 11315075 | + | LIPE-AS1 | chr19 | 42905110 | + |
| intron-intron | ENST00000376838 | ENST00000596116 | MTOR | chr1 | 11315075 | + | LIPE-AS1 | chr19 | 42905110 | + |
| intron-intron | ENST00000376838 | ENST00000597203 | MTOR | chr1 | 11315075 | + | LIPE-AS1 | chr19 | 42905110 | + |
| intron-intron | ENST00000376838 | ENST00000599276 | MTOR | chr1 | 11315075 | + | LIPE-AS1 | chr19 | 42905110 | + |
| intron-intron | ENST00000495435 | ENST00000457234 | MTOR | chr1 | 11315075 | + | LIPE-AS1 | chr19 | 42905110 | + |
| intron-intron | ENST00000495435 | ENST00000593491 | MTOR | chr1 | 11315075 | + | LIPE-AS1 | chr19 | 42905110 | + |
| intron-intron | ENST00000495435 | ENST00000593740 | MTOR | chr1 | 11315075 | + | LIPE-AS1 | chr19 | 42905110 | + |
| intron-intron | ENST00000495435 | ENST00000594624 | MTOR | chr1 | 11315075 | + | LIPE-AS1 | chr19 | 42905110 | + |
| intron-intron | ENST00000495435 | ENST00000594688 | MTOR | chr1 | 11315075 | + | LIPE-AS1 | chr19 | 42905110 | + |
| intron-intron | ENST00000495435 | ENST00000596116 | MTOR | chr1 | 11315075 | + | LIPE-AS1 | chr19 | 42905110 | + |
| intron-intron | ENST00000495435 | ENST00000597203 | MTOR | chr1 | 11315075 | + | LIPE-AS1 | chr19 | 42905110 | + |
| intron-intron | ENST00000495435 | ENST00000599276 | MTOR | chr1 | 11315075 | + | LIPE-AS1 | chr19 | 42905110 | + |
| ORFfinder result based on the fusion transcript sequence of in-frame fusion genes. |
| Henst | Tenst | Hgene | Hchr | Hbp | Hstrand | Tgene | Tchr | Tbp | Tstrand | Seq length (transcript) | BP loci (transcript) | Predicted start (transcript) | Predicted stop (transcript) | Seq length (amino acids) |
| DeepORF prediction of the coding potential based on the fusion transcript sequence of in-frame fusion genes. DeepORF is a coding potential classifier based on convolutional neural network by comparing the real Ribo-seq data. If the no-coding score < 0.5 and coding score > 0.5, then the in-frame fusion transcript is predicted as being likely translated. |
| Henst | Tenst | Hgene | Hchr | Hbp | Hstrand | Tgene | Tchr | Tbp | Tstrand | No-coding score | Coding score |
Top |
Fusion Genomic Features for MTOR-LIPE-AS1 |
| FusionAI prediction of the potential fusion gene breakpoint based on the pre-mature RNA sequence context (+/- 5kb of individual partner genes, total 20kb length sequence). FusionAI is a fusion gene breakpoint classifier based on convolutional neural network by comparing the fusion positive and negative sequence context of ~ 20K fusion gene data. From here, we can have the relative potentency of the 20K genomic sequence how individual sequnce will be likely used as the gene fusion breakpoints. |
| Hgene | Hchr | Hbp | Hstrand | Tgene | Tchr | Tbp | Tstrand | 1-p | p (fusion gene breakpoint) |
| Distribution of 44 human genomic features loci across 20kb length fusion breakpoint regions. We integrated a total of 44 different types of human genomic feature loci information across five big categories including virus integration sites, repeats, structural variants, chromatin states, and gene expression regulation. More details are in help page. |
| Distribution of 44 human genomic features loci across 20kb length fusion breakpoint regions that are ovelapped with the top 1% feature importance score regions. More details are in help page. |
Top |
Fusion Protein Features for MTOR-LIPE-AS1 |
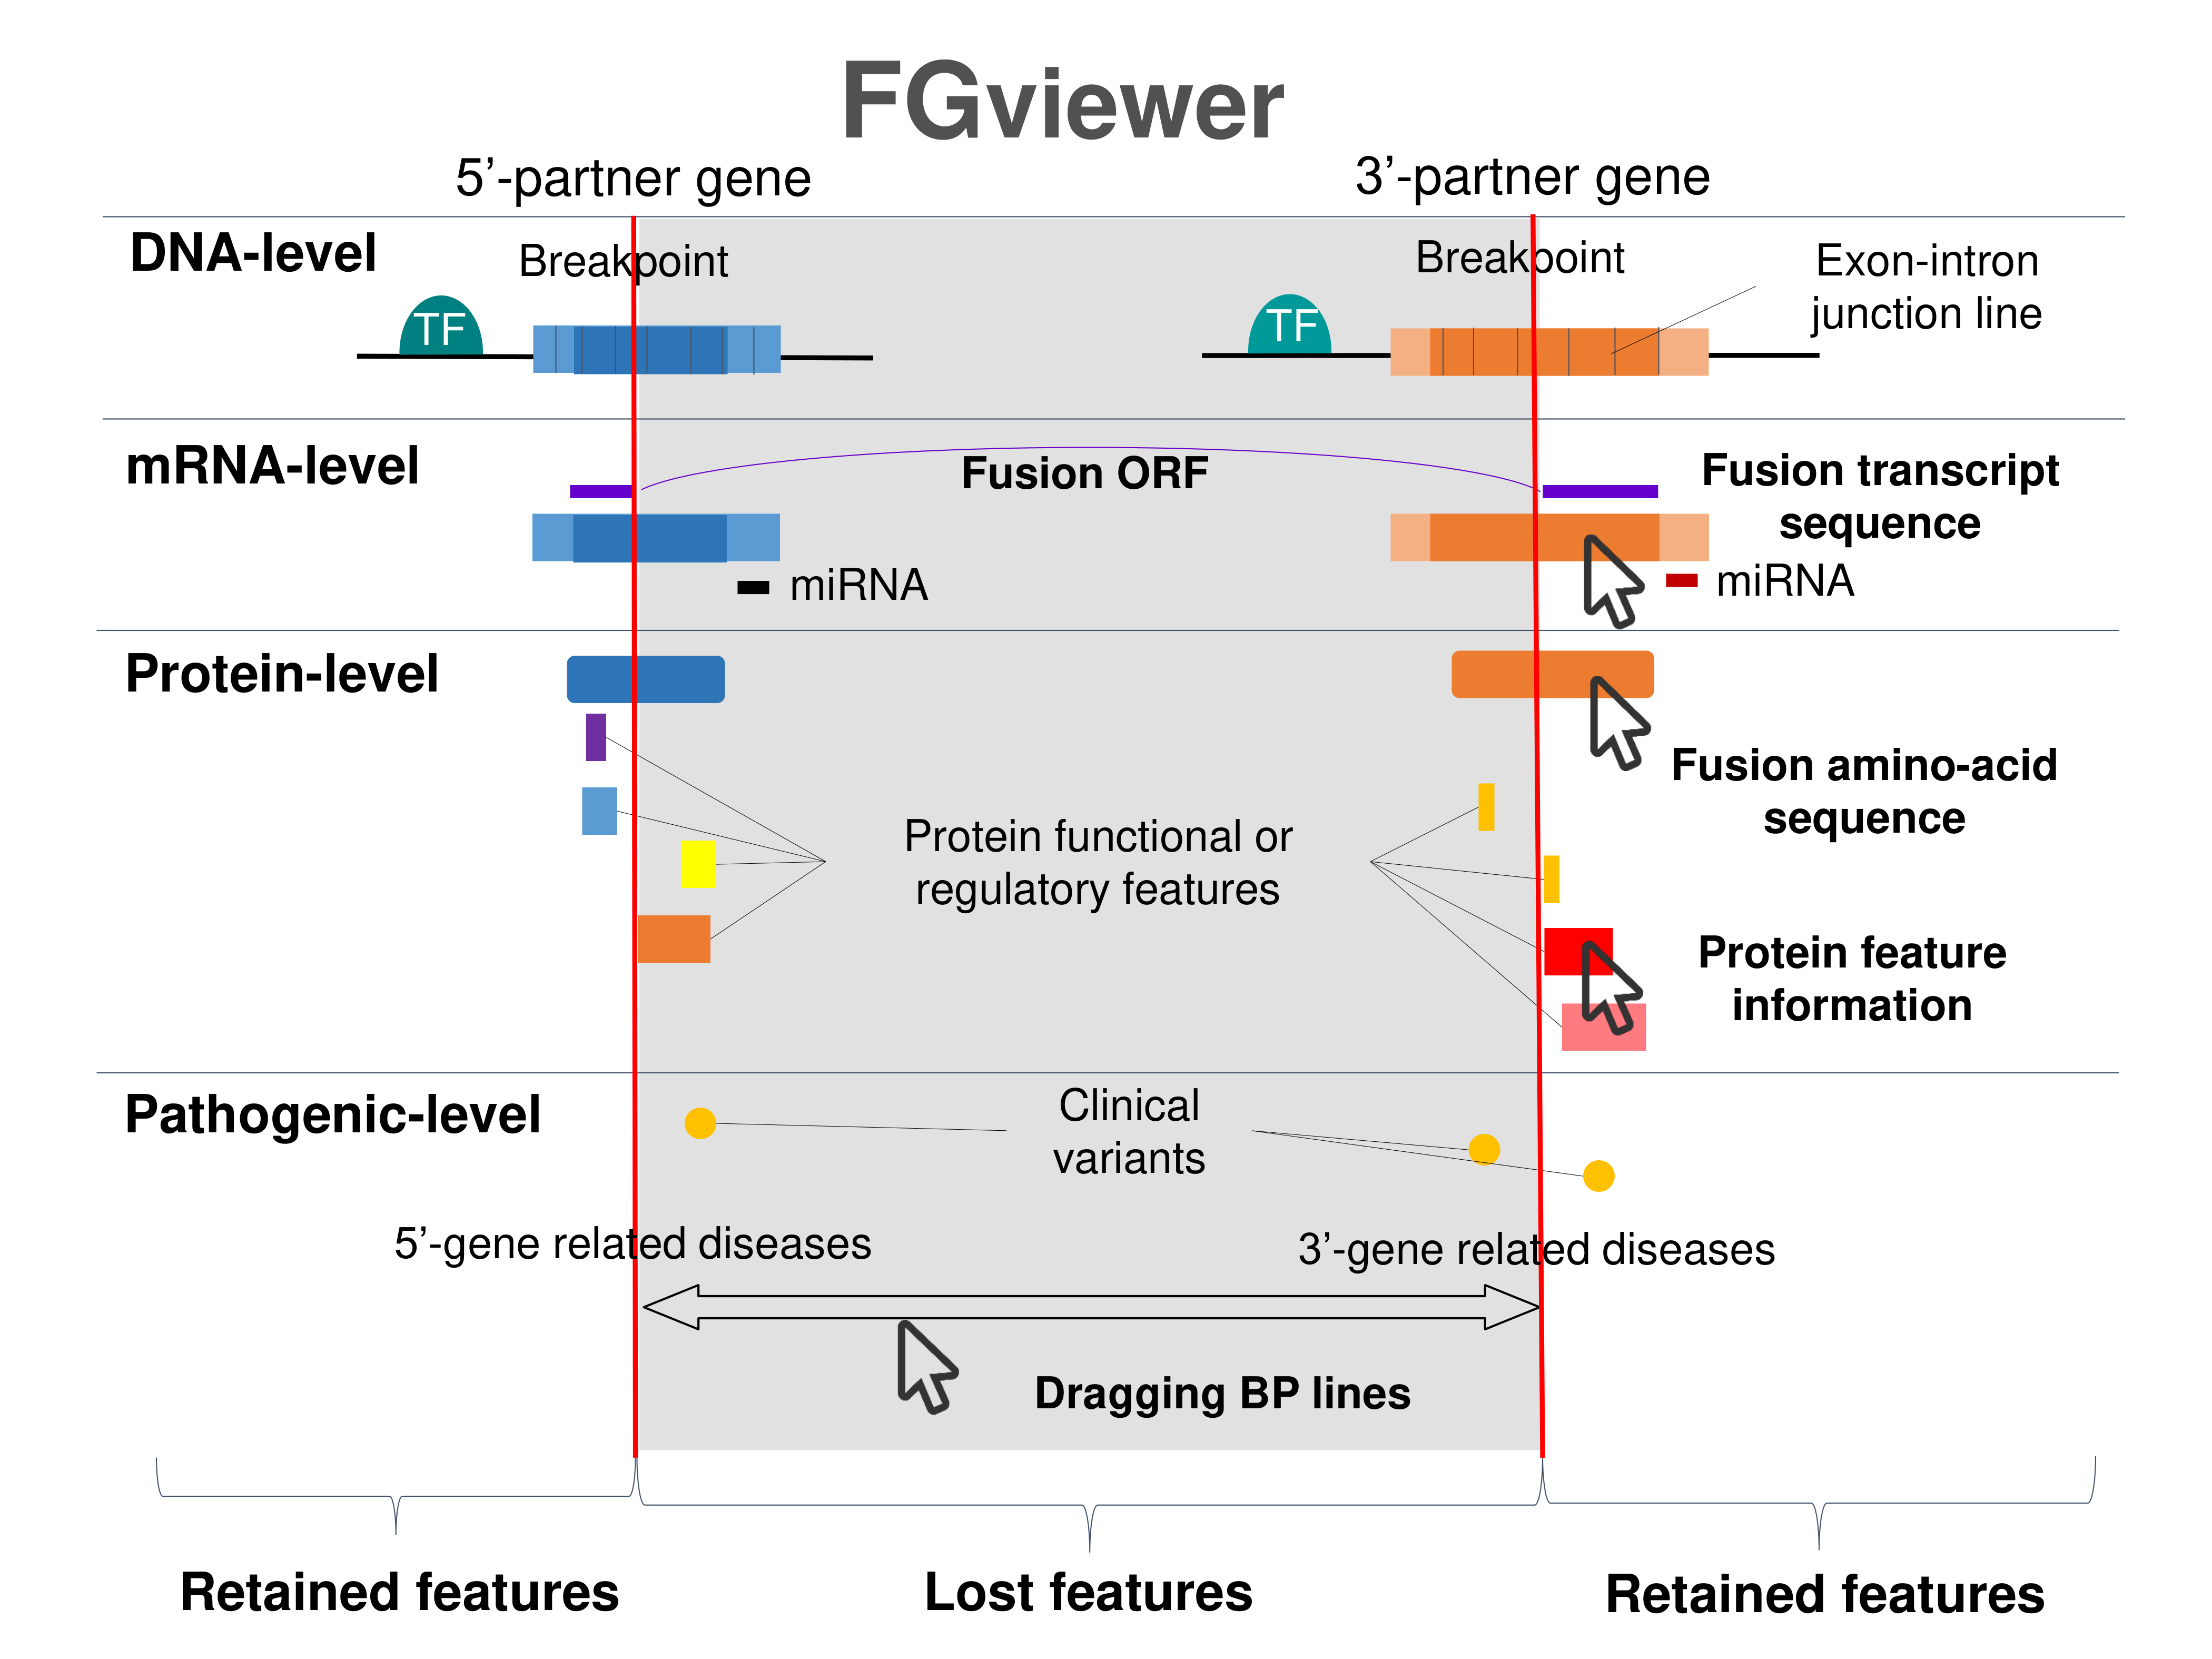
| Four levels of functional features of fusion genes Go to FGviewer search page for the most frequent breakpoint (https://ccsmweb.uth.edu/FGviewer/:11315075/:42905110) - FGviewer provides the online visualization of the retention search of the protein functional features across DNA, RNA, protein, and pathological levels. - How to search 1. Put your fusion gene symbol. 2. Press the tab key until there will be shown the breakpoint information filled. 4. Go down and press 'Search' tab twice. 4. Go down to have the hyperlink of the search result. 5. Click the hyperlink. 6. See the FGviewer result for your fusion gene. |
 |
| Main function of each fusion partner protein. (from UniProt) |
| Hgene | Tgene |
| MTOR | . |
| FUNCTION: Serine/threonine protein kinase which is a central regulator of cellular metabolism, growth and survival in response to hormones, growth factors, nutrients, energy and stress signals (PubMed:12087098, PubMed:12150925, PubMed:12150926, PubMed:12231510, PubMed:12718876, PubMed:14651849, PubMed:15268862, PubMed:15467718, PubMed:15545625, PubMed:15718470, PubMed:18497260, PubMed:18762023, PubMed:18925875, PubMed:20516213, PubMed:20537536, PubMed:21659604, PubMed:23429703, PubMed:23429704, PubMed:25799227, PubMed:26018084). MTOR directly or indirectly regulates the phosphorylation of at least 800 proteins. Functions as part of 2 structurally and functionally distinct signaling complexes mTORC1 and mTORC2 (mTOR complex 1 and 2) (PubMed:15268862, PubMed:15467718, PubMed:18925875, PubMed:18497260, PubMed:20516213, PubMed:21576368, PubMed:21659604, PubMed:23429704). Activated mTORC1 up-regulates protein synthesis by phosphorylating key regulators of mRNA translation and ribosome synthesis (PubMed:12087098, PubMed:12150925, PubMed:12150926, PubMed:12231510, PubMed:12718876, PubMed:14651849, PubMed:15268862, PubMed:15467718, PubMed:15545625, PubMed:15718470, PubMed:18497260, PubMed:18762023, PubMed:18925875, PubMed:20516213, PubMed:20537536, PubMed:21659604, PubMed:23429703, PubMed:23429704, PubMed:25799227, PubMed:26018084). This includes phosphorylation of EIF4EBP1 and release of its inhibition toward the elongation initiation factor 4E (eiF4E) (By similarity). Moreover, phosphorylates and activates RPS6KB1 and RPS6KB2 that promote protein synthesis by modulating the activity of their downstream targets including ribosomal protein S6, eukaryotic translation initiation factor EIF4B, and the inhibitor of translation initiation PDCD4 (PubMed:12150925, PubMed:12087098, PubMed:18925875). This also includes mTORC1 signaling cascade controlling the MiT/TFE factors TFEB and TFE3: in the presence of nutrients, mediates phosphorylation of TFEB and TFE3, promoting their cytosolic retention and inactivation (PubMed:22576015, PubMed:22343943, PubMed:22692423). Upon starvation or lysosomal stress, inhibition of mTORC1 induces dephosphorylation and nuclear translocation of TFEB and TFE3, promoting their transcription factor activity (PubMed:22576015, PubMed:22343943, PubMed:22692423). Stimulates the pyrimidine biosynthesis pathway, both by acute regulation through RPS6KB1-mediated phosphorylation of the biosynthetic enzyme CAD, and delayed regulation, through transcriptional enhancement of the pentose phosphate pathway which produces 5-phosphoribosyl-1-pyrophosphate (PRPP), an allosteric activator of CAD at a later step in synthesis, this function is dependent on the mTORC1 complex (PubMed:23429704, PubMed:23429703). Regulates ribosome synthesis by activating RNA polymerase III-dependent transcription through phosphorylation and inhibition of MAF1 an RNA polymerase III-repressor (PubMed:20516213). In parallel to protein synthesis, also regulates lipid synthesis through SREBF1/SREBP1 and LPIN1 (By similarity). To maintain energy homeostasis mTORC1 may also regulate mitochondrial biogenesis through regulation of PPARGC1A (By similarity). mTORC1 also negatively regulates autophagy through phosphorylation of ULK1 (By similarity). Under nutrient sufficiency, phosphorylates ULK1 at 'Ser-758', disrupting the interaction with AMPK and preventing activation of ULK1 (By similarity). Also prevents autophagy through phosphorylation of the autophagy inhibitor DAP (PubMed:20537536). Also prevents autophagy by phosphorylating RUBCNL/Pacer under nutrient-rich conditions (PubMed:30704899). mTORC1 exerts a feedback control on upstream growth factor signaling that includes phosphorylation and activation of GRB10 a INSR-dependent signaling suppressor (PubMed:21659604). Among other potential targets mTORC1 may phosphorylate CLIP1 and regulate microtubules (PubMed:12231510). As part of the mTORC2 complex MTOR may regulate other cellular processes including survival and organization of the cytoskeleton (PubMed:15268862, PubMed:15467718). Plays a critical role in the phosphorylation at 'Ser-473' of AKT1, a pro-survival effector of phosphoinositide 3-kinase, facilitating its activation by PDK1 (PubMed:15718470). mTORC2 may regulate the actin cytoskeleton, through phosphorylation of PRKCA, PXN and activation of the Rho-type guanine nucleotide exchange factors RHOA and RAC1A or RAC1B (PubMed:15268862). mTORC2 also regulates the phosphorylation of SGK1 at 'Ser-422' (PubMed:18925875). Regulates osteoclastogenesis by adjusting the expression of CEBPB isoforms (By similarity). Plays an important regulatory role in the circadian clock function; regulates period length and rhythm amplitude of the suprachiasmatic nucleus (SCN) and liver clocks (By similarity). Phosphorylates SQSTM1, promoting interaction between SQSTM1 and KEAP1 and subsequent inactivation of the BCR(KEAP1) complex (By similarity). {ECO:0000250|UniProtKB:P42346, ECO:0000250|UniProtKB:Q9JLN9, ECO:0000269|PubMed:12087098, ECO:0000269|PubMed:12150925, ECO:0000269|PubMed:12150926, ECO:0000269|PubMed:12231510, ECO:0000269|PubMed:12718876, ECO:0000269|PubMed:14651849, ECO:0000269|PubMed:15268862, ECO:0000269|PubMed:15467718, ECO:0000269|PubMed:15545625, ECO:0000269|PubMed:15718470, ECO:0000269|PubMed:18497260, ECO:0000269|PubMed:18762023, ECO:0000269|PubMed:18925875, ECO:0000269|PubMed:20516213, ECO:0000269|PubMed:20537536, ECO:0000269|PubMed:21576368, ECO:0000269|PubMed:21659604, ECO:0000269|PubMed:22343943, ECO:0000269|PubMed:22576015, ECO:0000269|PubMed:22692423, ECO:0000269|PubMed:23429703, ECO:0000269|PubMed:23429704, ECO:0000269|PubMed:25799227, ECO:0000269|PubMed:26018084, ECO:0000269|PubMed:30704899}. | FUNCTION: Transcriptional activator which is required for calcium-dependent dendritic growth and branching in cortical neurons. Recruits CREB-binding protein (CREBBP) to nuclear bodies. Component of the CREST-BRG1 complex, a multiprotein complex that regulates promoter activation by orchestrating a calcium-dependent release of a repressor complex and a recruitment of an activator complex. In resting neurons, transcription of the c-FOS promoter is inhibited by BRG1-dependent recruitment of a phospho-RB1-HDAC1 repressor complex. Upon calcium influx, RB1 is dephosphorylated by calcineurin, which leads to release of the repressor complex. At the same time, there is increased recruitment of CREBBP to the promoter by a CREST-dependent mechanism, which leads to transcriptional activation. The CREST-BRG1 complex also binds to the NR2B promoter, and activity-dependent induction of NR2B expression involves a release of HDAC1 and recruitment of CREBBP (By similarity). {ECO:0000250}. |
| Retention analysis result of each fusion partner protein across 39 protein features of UniProt such as six molecule processing features, 13 region features, four site features, six amino acid modification features, two natural variation features, five experimental info features, and 3 secondary structure features. Here, because of limited space for viewing, we only show the protein feature retention information belong to the 13 regional features. All retention annotation result can be downloaded at * Minus value of BPloci means that the break pointn is located before the CDS. |
| - In-frame and retained protein feature among the 13 regional features. |
| Partner | Gene | Hbp | Tbp | ENST | Strand | BPexon | TotalExon | Protein feature loci | *BPloci | TotalLen | Protein feature | Protein feature note |
| - In-frame and not-retained protein feature among the 13 regional features. |
| Partner | Gene | Hbp | Tbp | ENST | Strand | BPexon | TotalExon | Protein feature loci | *BPloci | TotalLen | Protein feature | Protein feature note |
Top |
Fusion Gene Sequence for MTOR-LIPE-AS1 |
| For in-frame fusion transcripts, we provide the fusion transcript sequences and fusion amino acid sequences. To have fusion amino acid sequence, we ran ORFfinder and chose the longest ORF among the all predicted ones. |
Top |
Fusion Gene PPI Analysis for MTOR-LIPE-AS1 |
| Go to ChiPPI (Chimeric Protein-Protein interactions) to see the chimeric PPI interaction in |
| Protein-protein interactors with each fusion partner protein in wild-type (BIOGRID-3.4.160) |
| Hgene | Hgene's interactors | Tgene | Tgene's interactors |
| - Retained PPIs in in-frame fusion. |
| Partner | Gene | Hbp | Tbp | ENST | Strand | BPexon | TotalExon | Protein feature loci | *BPloci | TotalLen | Still interaction with |
| - Lost PPIs in in-frame fusion. |
| Partner | Gene | Hbp | Tbp | ENST | Strand | BPexon | TotalExon | Protein feature loci | *BPloci | TotalLen | Interaction lost with |
| - Retained PPIs, but lost function due to frame-shift fusion. |
| Partner | Gene | Hbp | Tbp | ENST | Strand | BPexon | TotalExon | Protein feature loci | *BPloci | TotalLen | Interaction lost with |
Top |
Related Drugs for MTOR-LIPE-AS1 |
| Drugs targeting genes involved in this fusion gene. (DrugBank Version 5.1.8 2021-05-08) |
| Partner | Gene | UniProtAcc | DrugBank ID | Drug name | Drug activity | Drug type | Drug status |
Top |
Related Diseases for MTOR-LIPE-AS1 |
| Diseases associated with fusion partners. (DisGeNet 4.0) |
| Partner | Gene | Disease ID | Disease name | # pubmeds | Source |
(UTHealth)
Web File Viewing | Emergency Information |Campus Carry|Site Policies