
|
Home |
Download |
Statistics |
Examples |
Help |
Contact |
Terms of Use |
 Navigation
1. Fusion Gene Data Collection.
2. Protean Features Retention Analysis.
3. Genomic Features Analysis.
4. Open Reading Frame (ORF) Analysis
5. Creation of Fusion Transcript and Amino Acid Sequences.
6. Understanding of FusionGDB's Annotation Category.
- Search Page, example: ABL1 involved fusion genes (specifically, BCR-ABL1).
- FusionGene Search Result Page.
- FusionGene Annotation Result Page.
-- 1) Fusion Gene Summary.
-- 2) Fusion Gene ORF Analysis.
-- 3) Fusion Genomic Features.
-- 4) Fusion Prot Features.
-- 5) Fusion Gene Sequences.
-- 6) Fusion Gene PPI Analysis.
-- 7) Related Drugs.
-- 8) Related Diseases.
7. Download Data and Contact Us.
1. Fusion Gene Data Collection
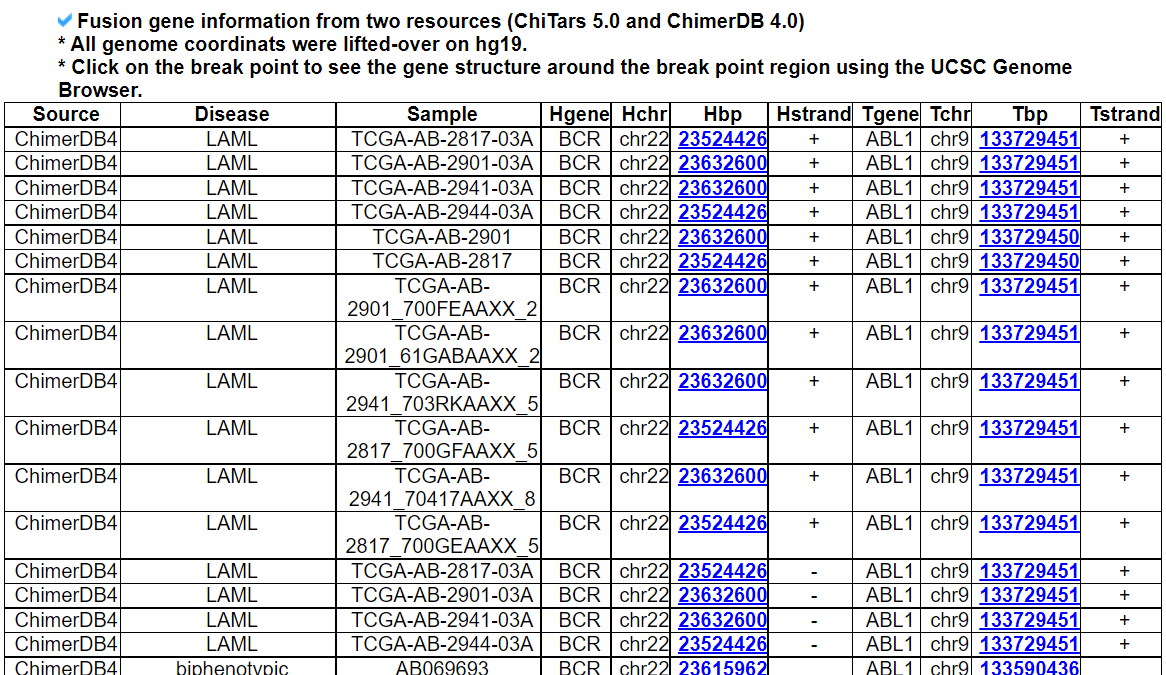
We obtained fusion genes which are validated or predicted from Entrez mRNA sequence libraries and human primary tumor samples of TCGA data from ChiTars 5.0 and ChimerDB 4.0. All genome coordinates of breakpoints were lifted over to hg19. Detailed information is on the statistics page.2. Protein Features Retention Analysis
We searched the retention of 39 protein features of UniProt (six molecule processing features, 13 region features, four site features, six amino acid modification features, two natural variation features, five experimental info features, and 3 secondary structure features) at the fusion amino acid sequence level. Through this process, we also checked the retention of protein-protein interaction (PPI) at the fusion protein. Detailed information about all of the protein features is on the UniProt page.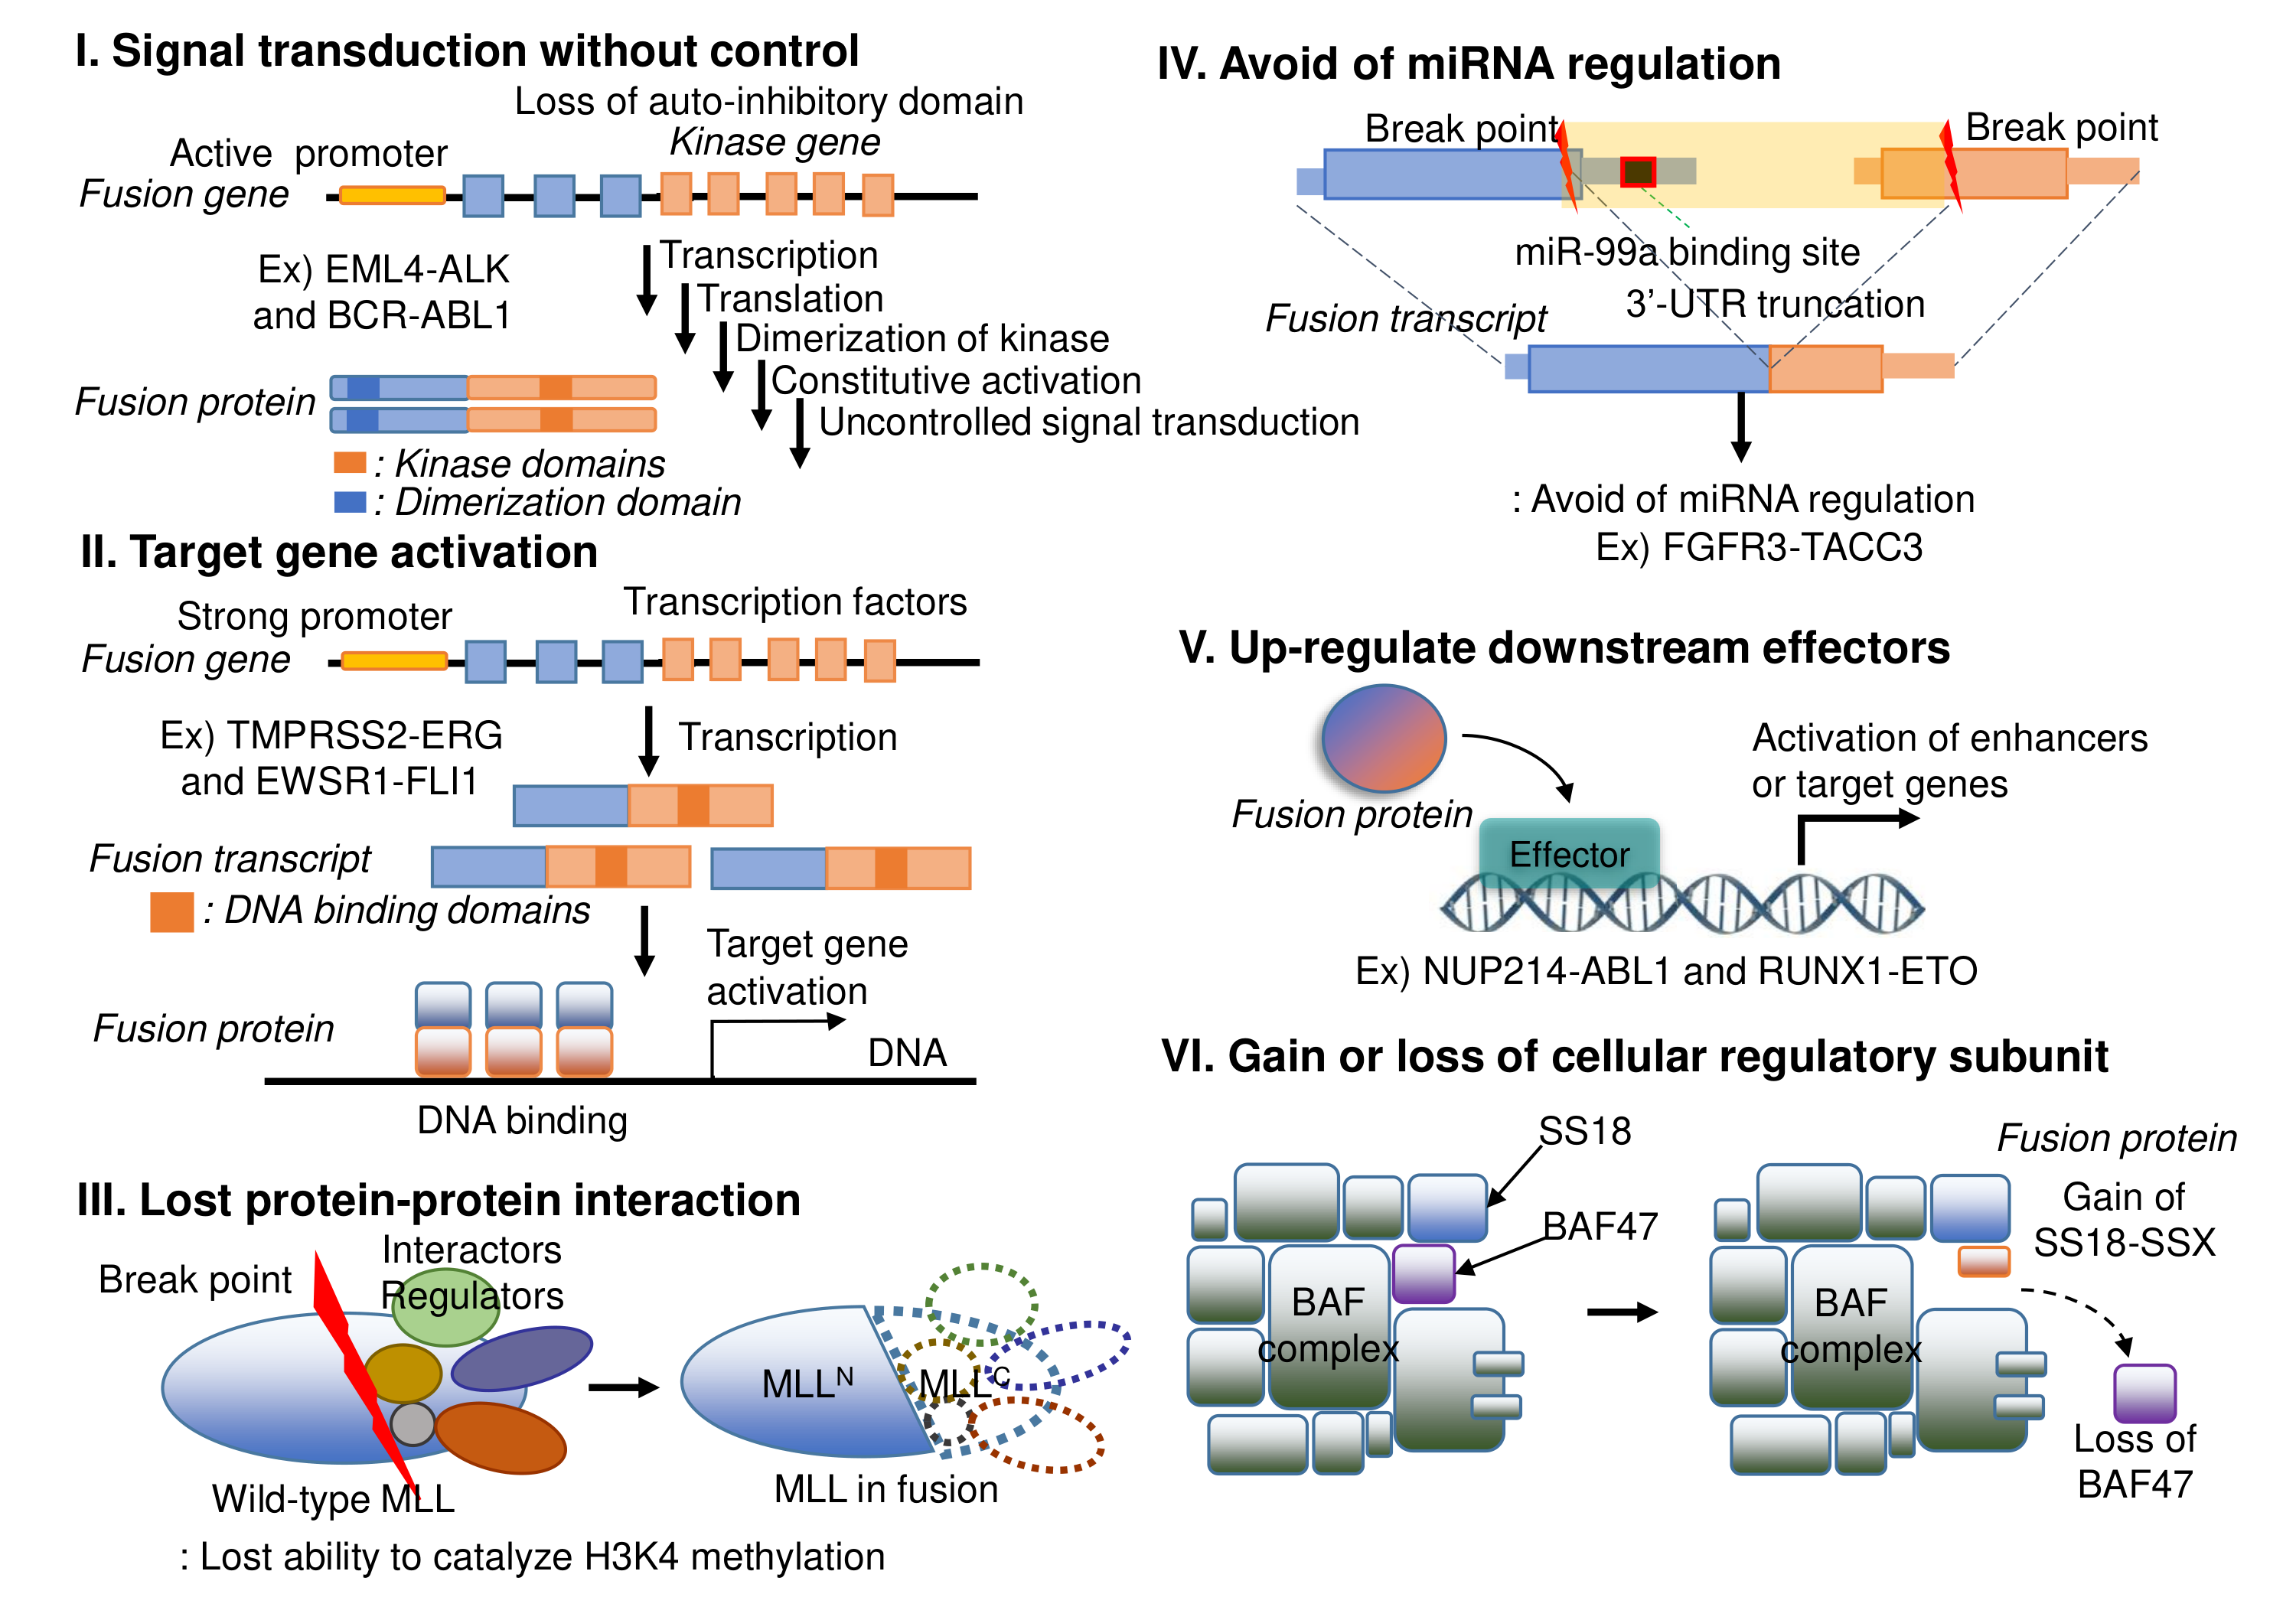
There are diverse categories of mechanisms of action of fusion genes in human diseases as above.
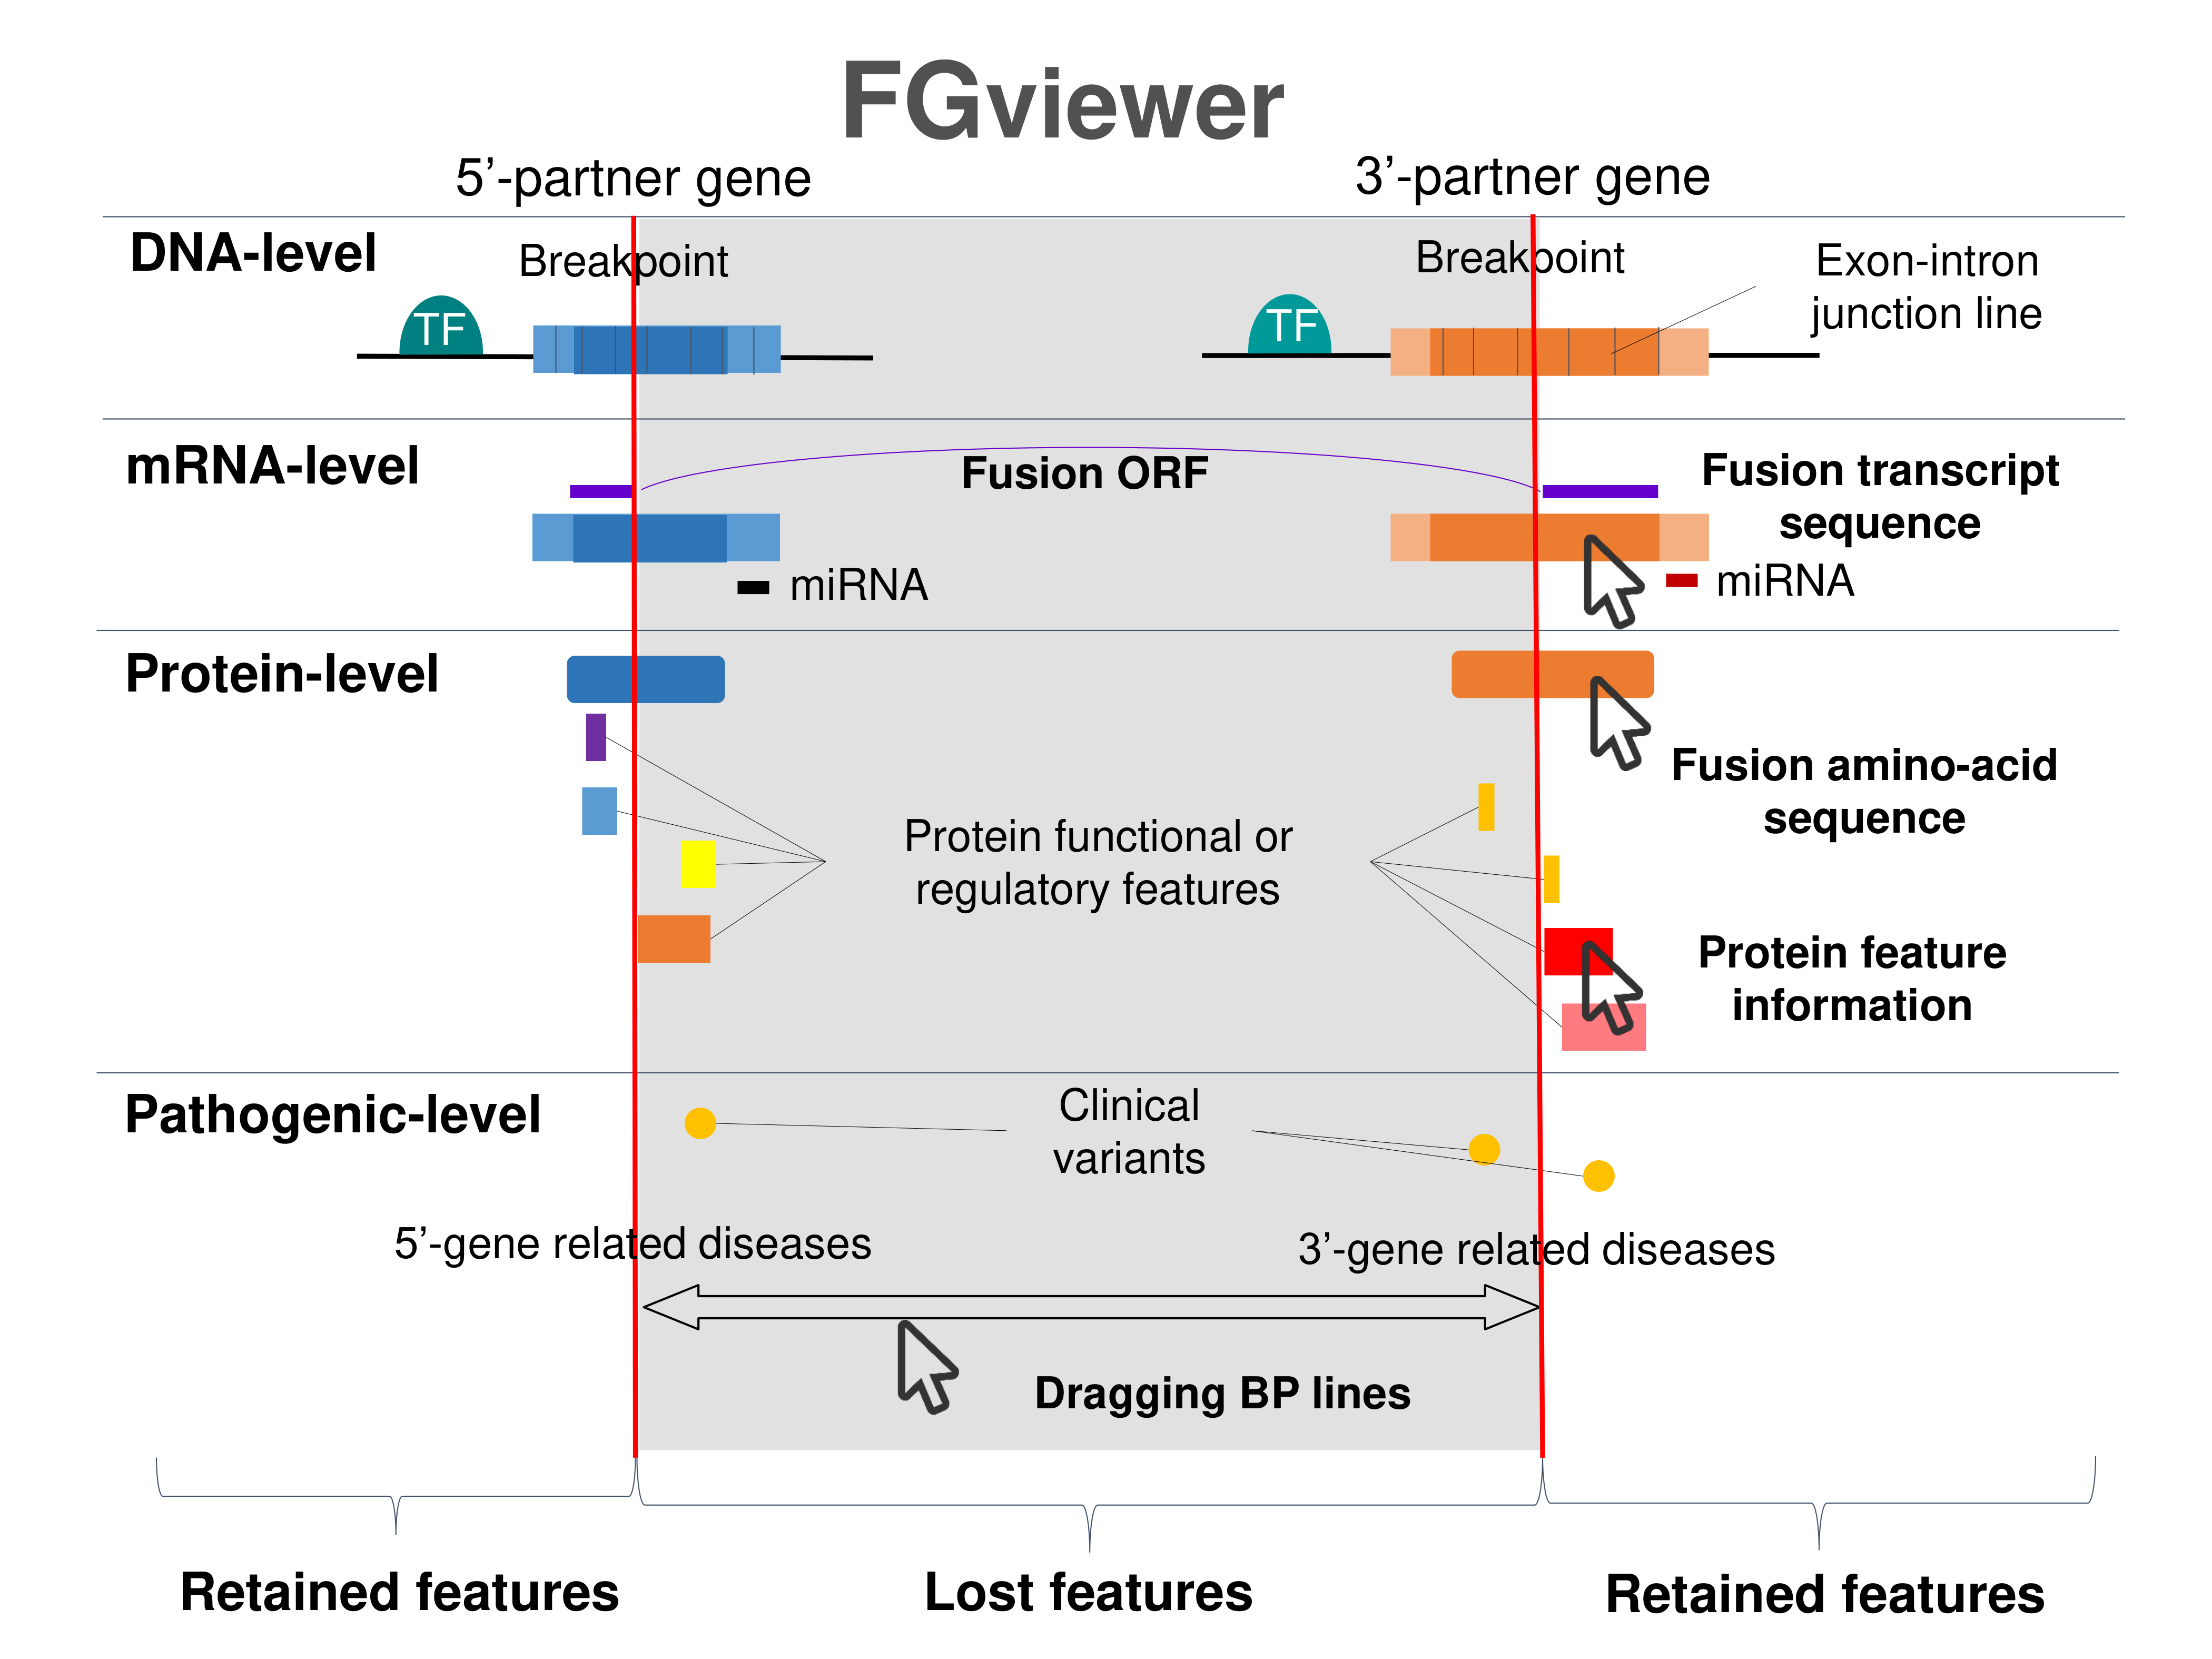
FGviewer provides functional feature annotations at four different levels: DNA-, RNA-, protein-, and pathogenic levels. The same breakpoint line across four tiers will classify between FG involving or non-involving zone with multiple types of functional features.
3. Genomic Features Analysis.
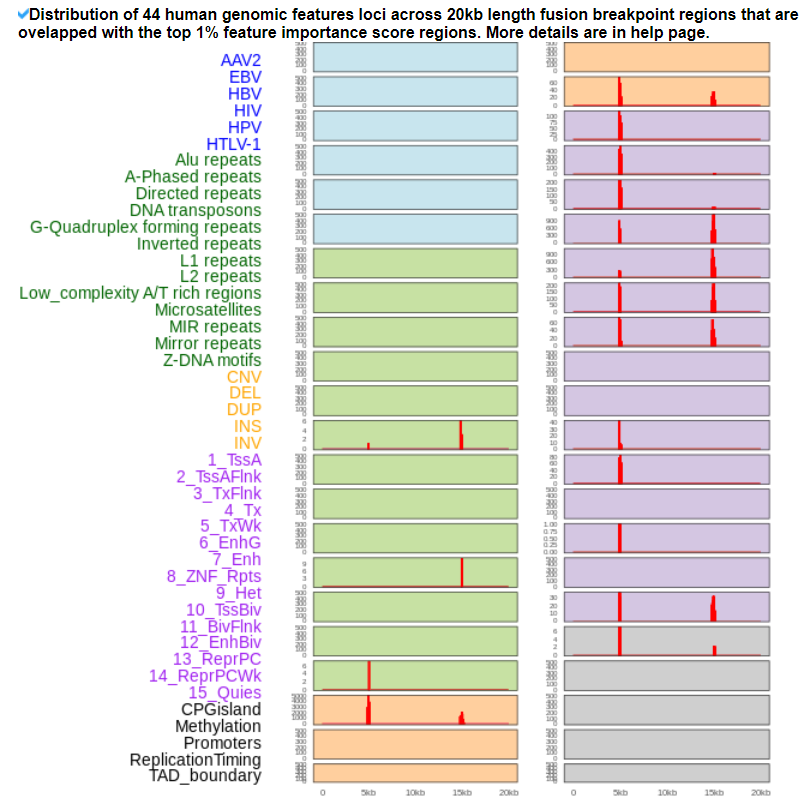
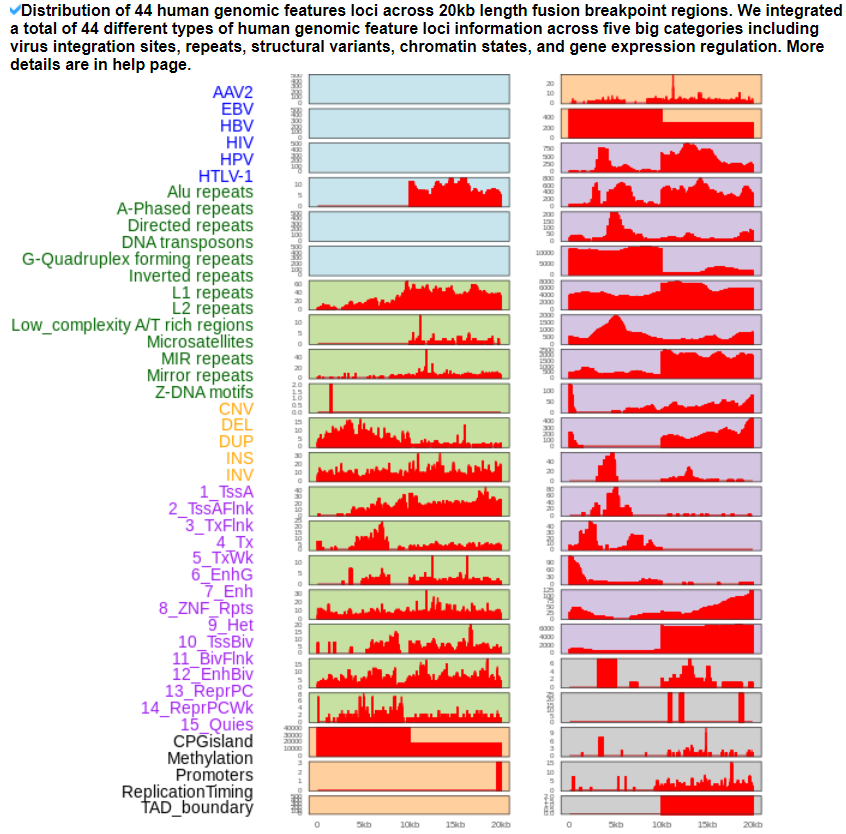
Recently, we developed a deep learning-based classifier between fusion gene and no fusion gene breakpoint sequences (FusionAI). It will be published soon (We will add the link later here). For all fusion transcripts whose breakpoints are located at the exon junction boundaries, we can run FusionAI. We got the FusionAI score whether it is related to the fusion gene breakpoint related features. We also investigated what human genomic sequence features are enriched in the fusion gene breakpoint area. We found the overlap between the fusion gene breakpoint area with the top 1% of the feature importance scored regions among the 20kb sequence of fusion gene breakpoints. To do this, we integrated a total of 44 different types of human genomic feature loci information across five big categories including virus integration sites, repeats, structural variants, chromatin states, and gene expression regulation. First, we downloaded the virus integration site information from the VISDB(Tang et al., 2020) and we lifted it over to the hg19 version using the liftover tool from the UCSC Genome Browser since FusionAI’s training was done based on the sequence of the hg19 version (Navarro Gonzalez et al., 2021). We integrated 13 types of repeats (Alu repeats, A-Phased repeats, Directed repeats, DNA transposons, "G-Quadruplex, forming repeats", Inverted repeats, L1 repeats, L2 repeats, "Low_complexity, A/T rich regions", Microsatellites, MIR repeats, Mirror repeats, and Z-DNA motifs) from RepeatMasker (Jurka, 2000) and MicroSatellite DataBase (MSDB) (Avvaru et al., 2017). For the diverse types of structural variants including the copy number variants, we downloaded the arranged breakpoint information of the structural variants from dbVar (Lappalainen et al., 2013). The chromatin states category include the loci of 15 different types of chromatin states such as 1_TssA, 2_TssAFlnk, 3_TxFlnk, 4_Tx, 5_TxWk, 6_EnhG, 7_Enh, 8_ZNF_Rpts, 9_Het, 10_TssBiv, 11_BivFlnk, 12_EnhBiv, 13_ReprPC, 14_ReprPCWk, and 15_Quies, from the previous study on the chromatin state calls using a 15-state model for 12 cell lines, were obtained from the Roadmap Epigenomics Mapping Consortium (Ernst and Kellis, 2017; Roadmap Epigenomics et al., 2015). The gene expression regulatory category includes five types of features as CPGisland, Methylation, Promoters, ReplicationTiming, and TAD boundaries. The information of the first three feature categories was downloaded from the FANTOM5 collection(Lizio et al., 2019). We downloaded the replication timing-specific peak regions from the ENCODE portal site by selecting the assay type of the replication timing (Davis et al., 2021). We used 2,477 loci of common TAD boundaries from a previous study that made high-resolution chromosome conformation (Hi-C) datasets from five human cell lines based on the (Akdemir et al., 2020a).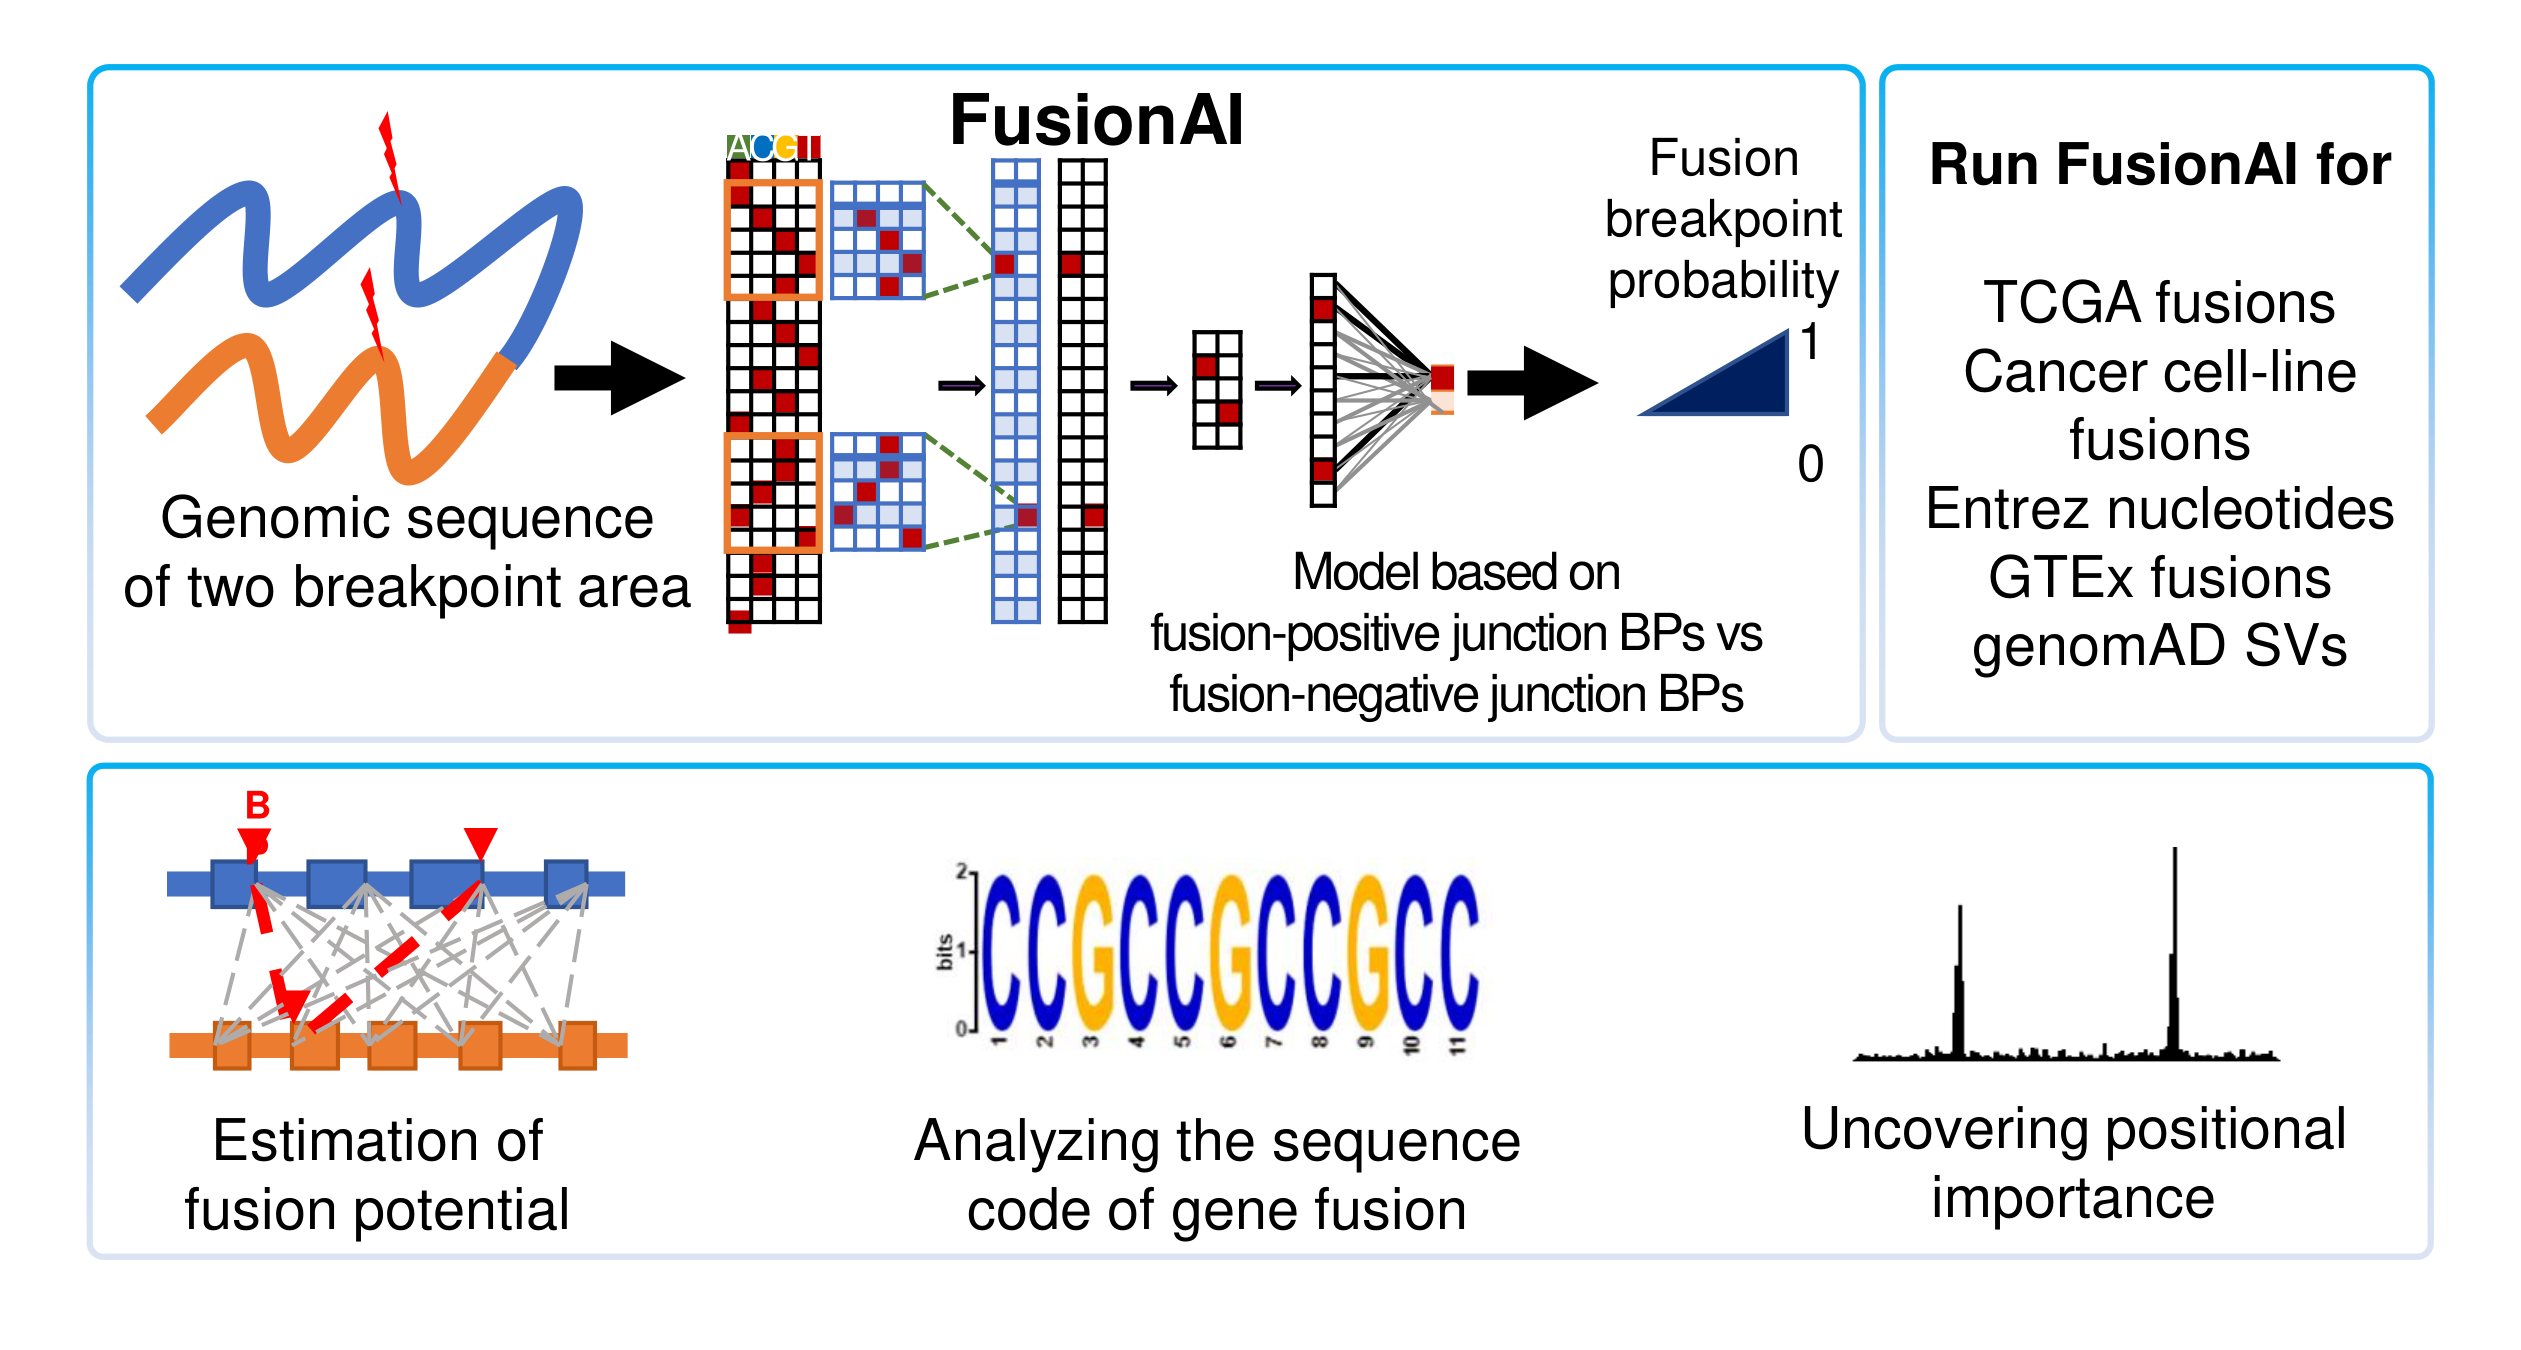
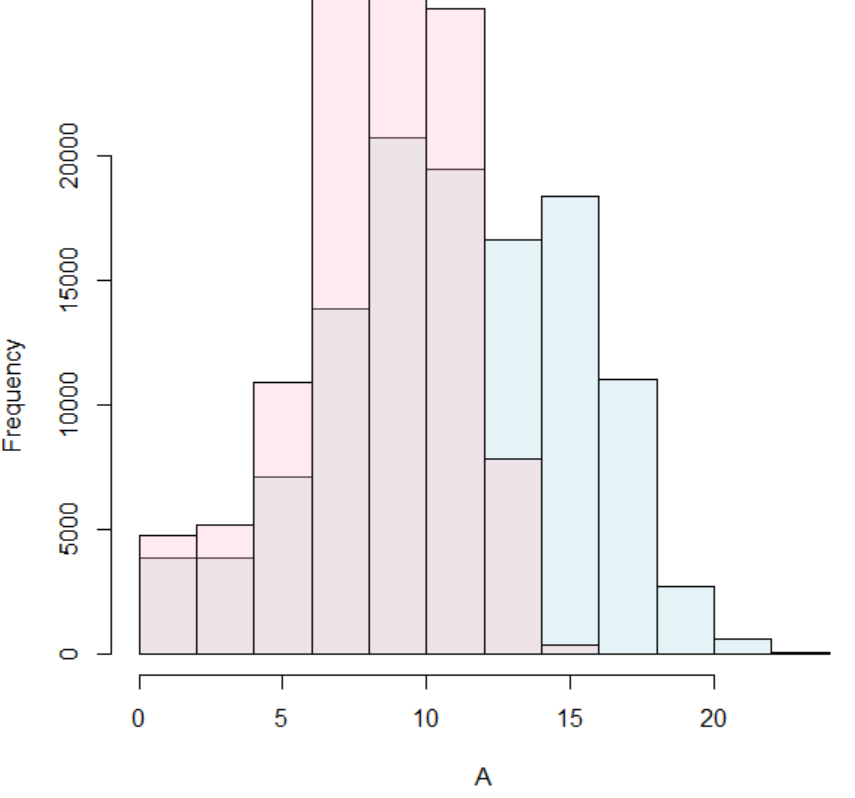
4. Open Reading Frame (ORF) Analysis
To check the coding potential, we analyzed the ORF of the fusion transcript sequences. First, we investigated the ORF whether in-frame or frame-shift if both breakpoints are located in the coding sequence (CDS) area. If not, we reported the location of individual breakpoint is in 5'-UTR, CDS, or 3'-UTR. Second, to have the potential amino acid sequence, we ran ORFfinder by NCBI. Third, we ran the in-house classifier (to be available soon) between the coding genes mapped by Ribo-seq reads with high reliability and non-coding genes not mapped by any Ribo-seq reads.Below shows the distribution comparison of coding potential prediction scores between our method (blue) and RNAsamba (pink).
5. Creation of Fusion Transcript and Amino Acid Sequences
To help experimental research laboratories, we have created the fusion transcript sequence and fusion amino acid sequences of ~ 30k in-frame fusion genes. Here, we considered the matched isoforms for each gene. The users can download the fusion isoform sequences from each annotation page.6. Understanding FusionGDB's Annotation Categories
Search page, example: ABL1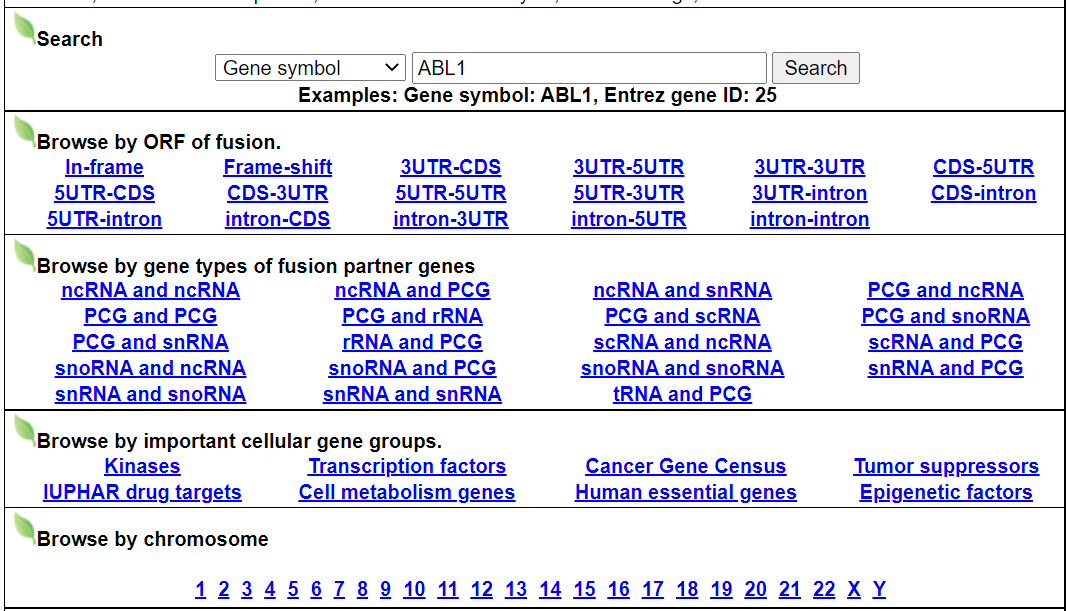
Input query
- Official HUGO gene symbol or Entrez gene ID.
FusionGene Search Result Page
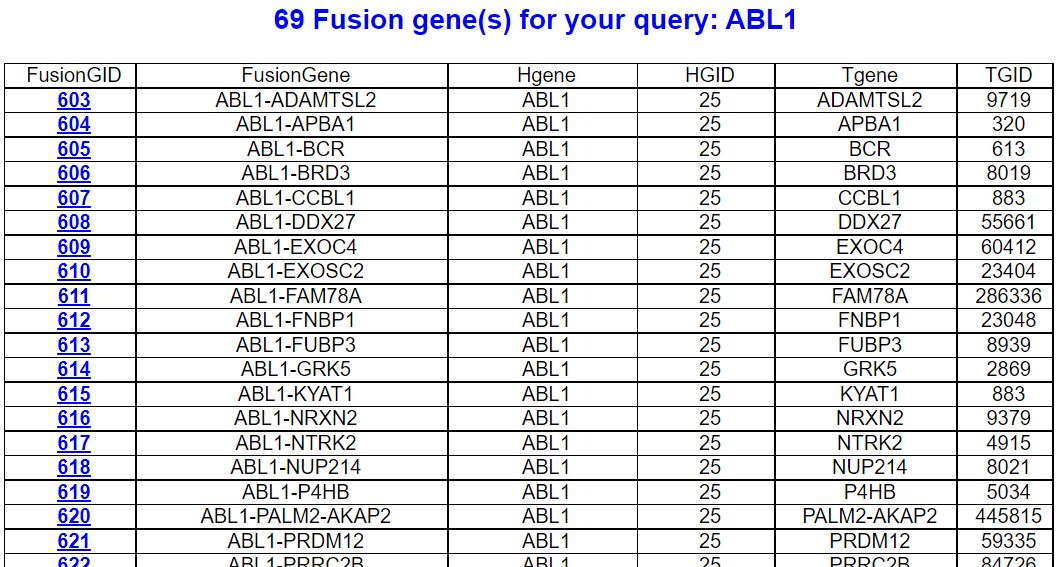
Select your fusion gene from the gene list.
FusionGene Annotation Result Page
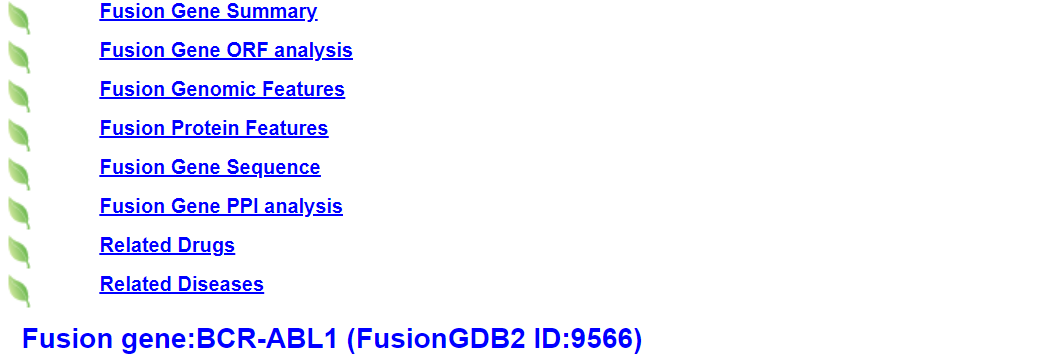
These are FusionGeneDB's annotation categories for your query with links to their corresponding annotation parts.
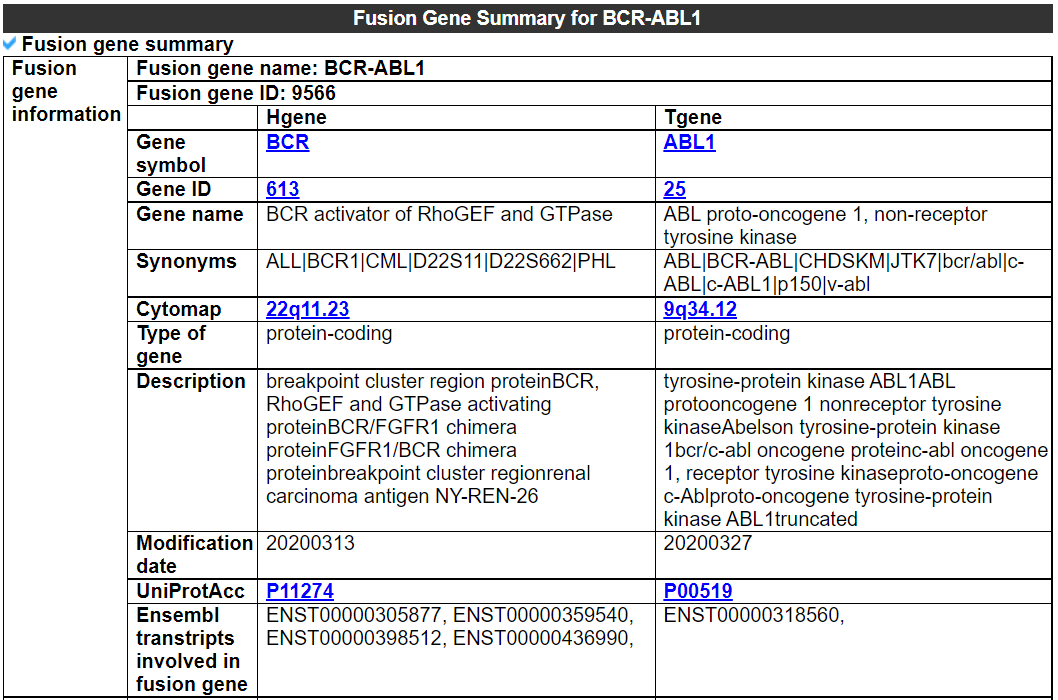
1) Fusion Gene Summary.
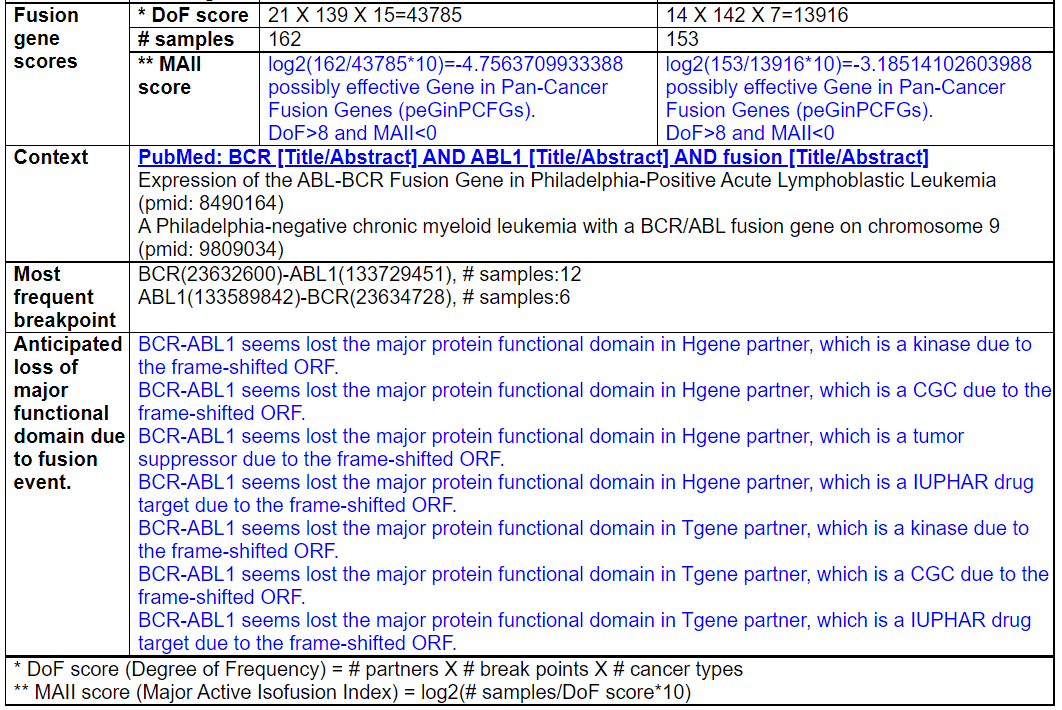
This category shows the information of the fusion gene. Firstly, it shows each partner gene's overall information from basic information such as symbol, alias, and locations and ENST accessions involved in fusion gene. Specifically, the DoF score provides all possible combinations of each gene in pan-cancer fusion genes. From the # samples, the user can Words in blue are linked to their respective databases. FusionGeneSummary table also shows the tissue and cancer type information including manually curated PubMed article information.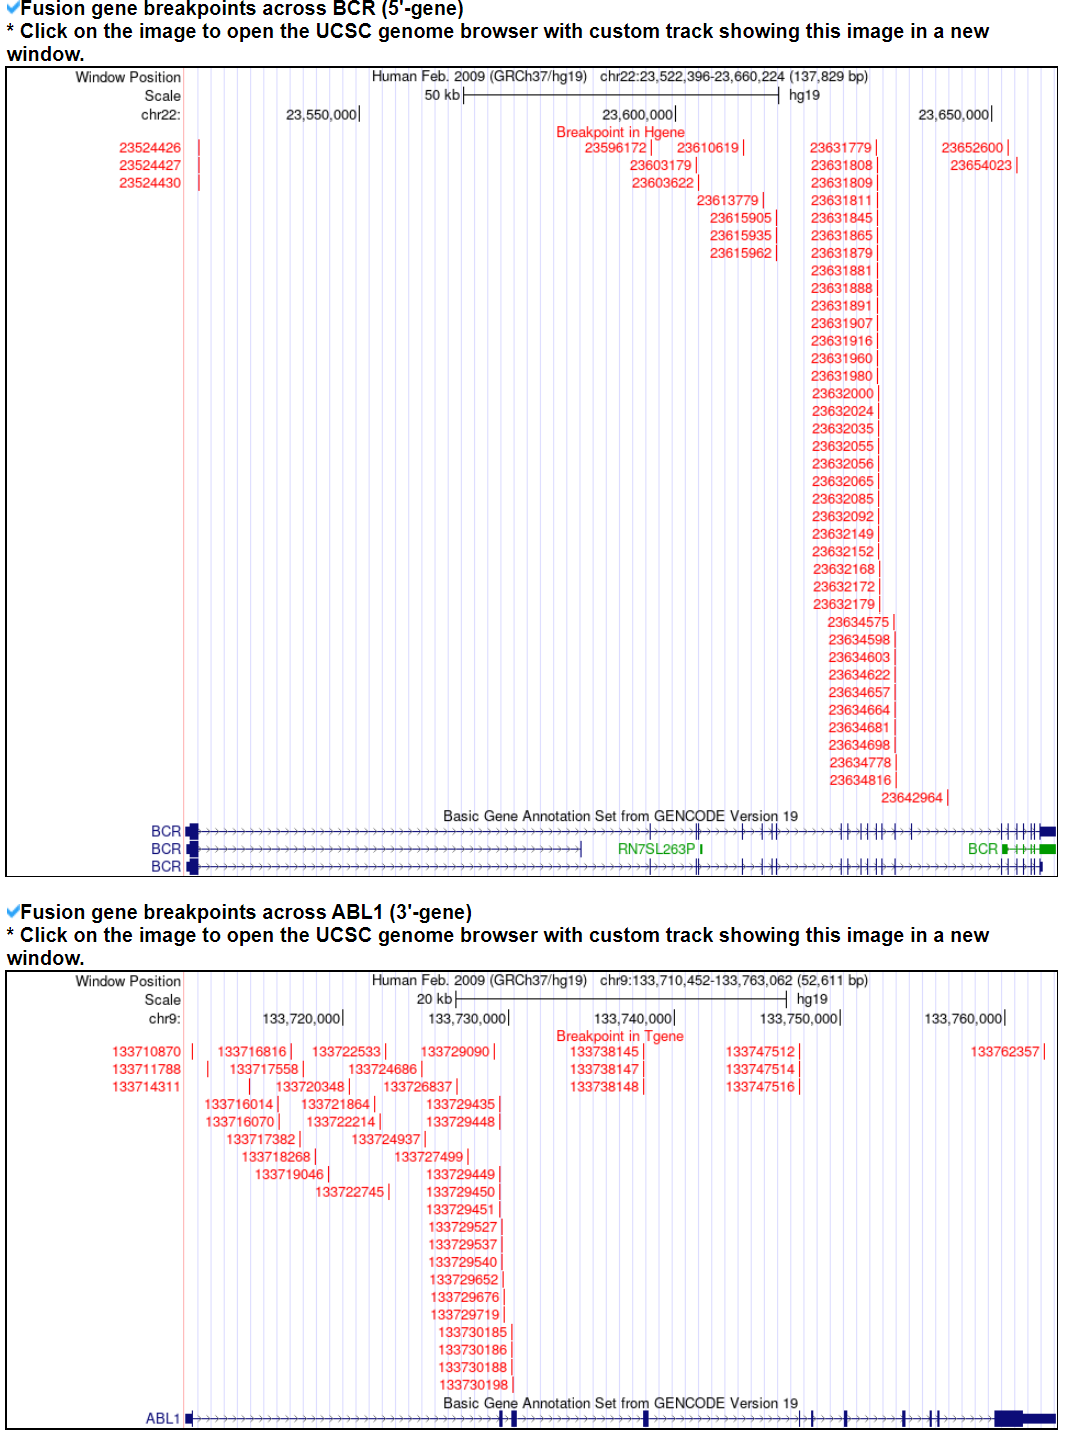
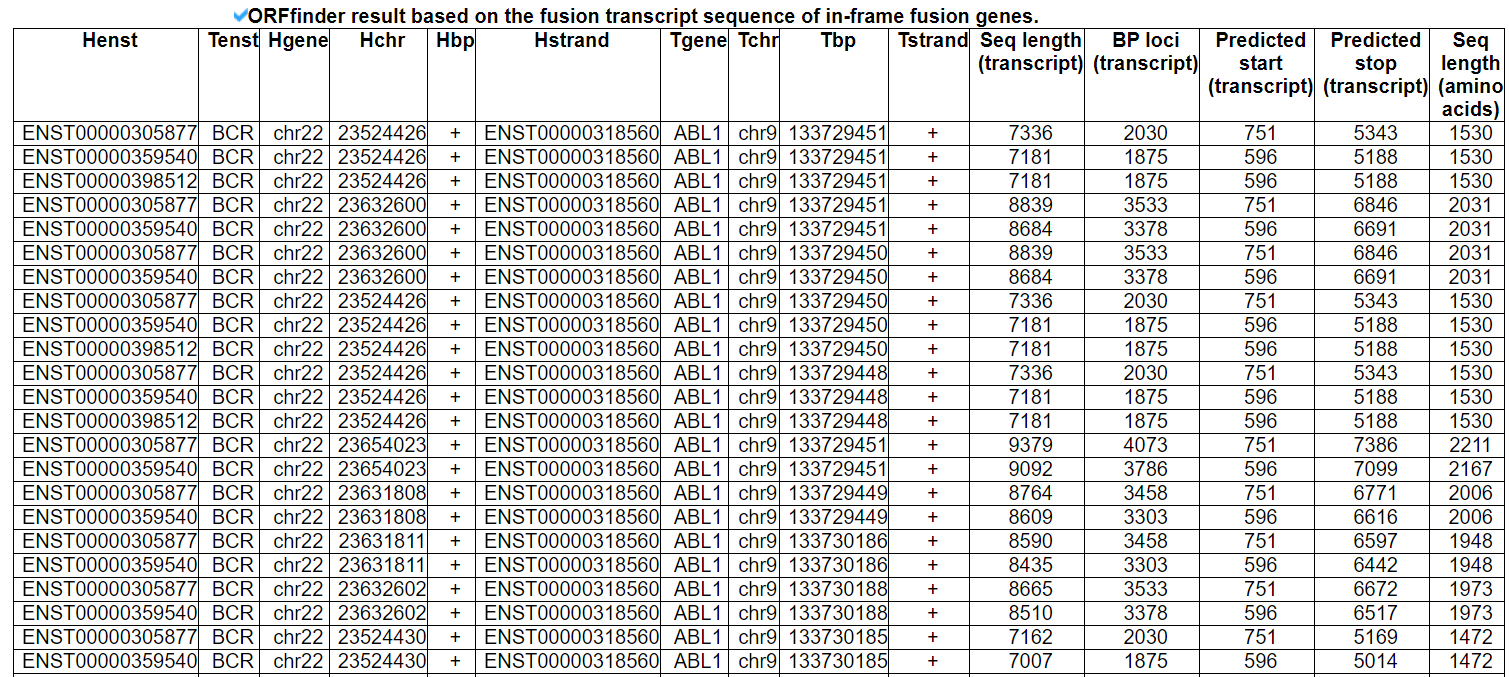
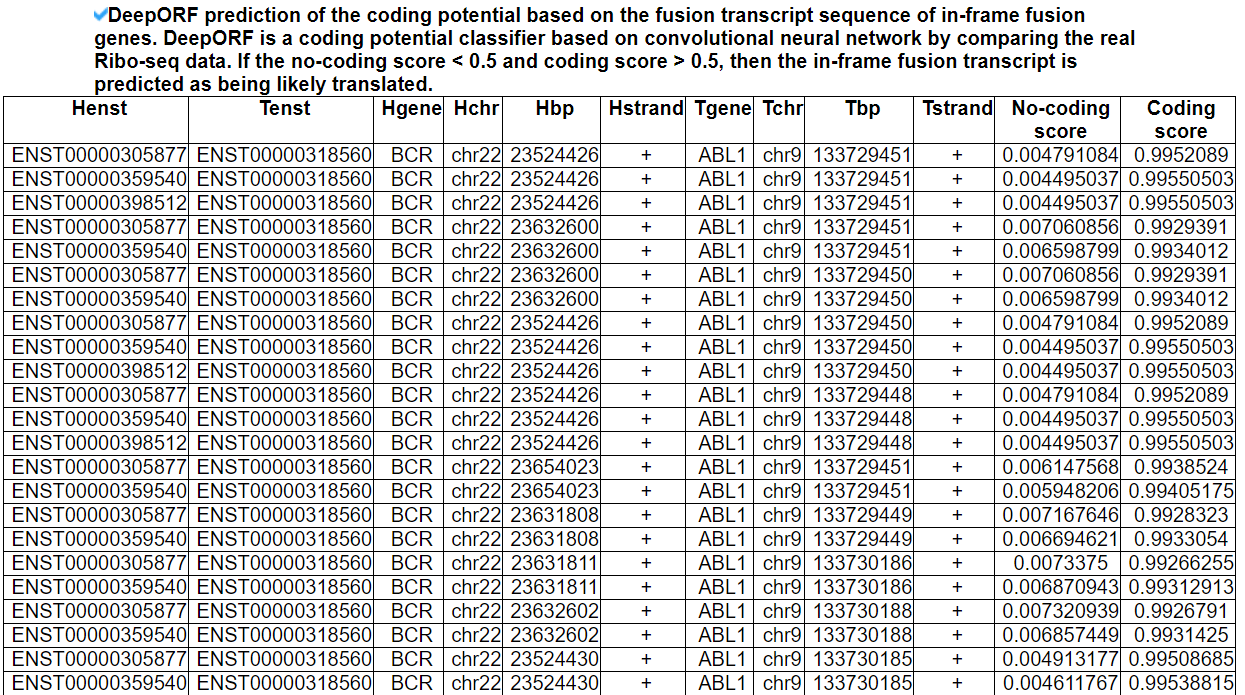
2) Fusion Gene ORF analysis.
This category shows the coding potential study results from three approaches. First, we investigated the ORF whether in-frame or frame-shift if both breakpoints are located in the coding sequence (CDS) area. If not, we reported the location of individual breakpoints is in 5'-UTR, CDS, or 3'-UTR. Second, to have the potential amino acid sequence, we ran ORFfinder by NCBI. Third, we ran the in-house classifier (to be available soon) between the coding genes mapped by Ribo-seq reads with high reliability and non-coding genes not mapped by any Ribo-seq reads.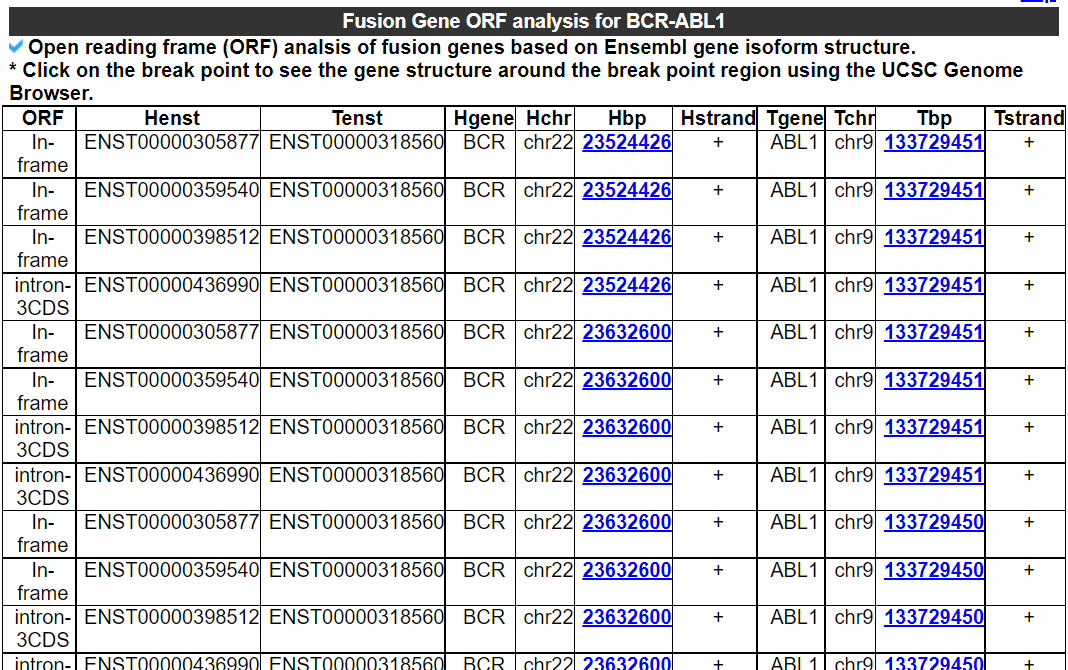
3) Fusion Genomic Features.
This category provides the potential human genomic features related to the fusion gene breakpoints. For all fusion transcripts whose breakpoints are located at the exon junction boundaries, we ran FusionAI, which is a deep learning-based classifier between fusion gene and no fusion gene breakpoint sequences by us. FusionAI predicts the potential of fusion gene breakpoints from 20k bp genomic sequence context. Then, we investigated the overlap between the fusion gene breakpoint area with the top 1% of the feature importance scored regions among the 20kb sequence of fusion gene breakpoints. To do this, we integrated a total of 44 different types of human genomic feature loci information across five big categories.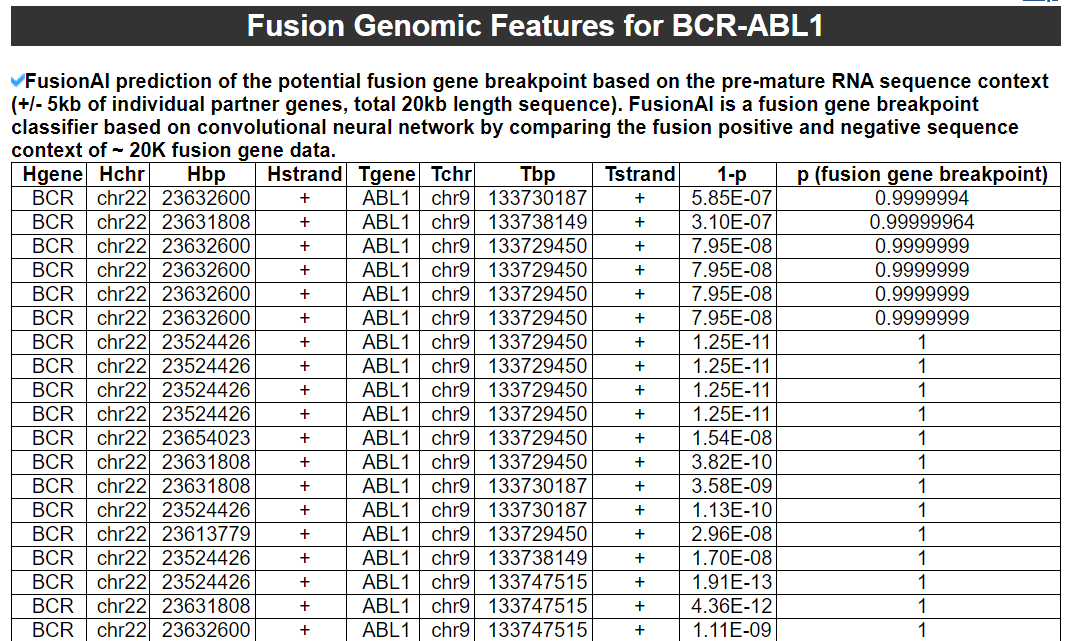
4) Fusion Protein Features.
This category provides the retention information of 39 protein features of fusion proteins based on their multiple isoform gene structures and multiple breakpoints. By focusing on the type of protein features, the user can understand the overall function of fusion genes and make a story in pathogenesis study. In this updated version, we also added the link for our FGviewer, a tool for visualizing functional features of the human fusion genes. FGviewer provides functional feature annotations at four different levels: DNA-, RNA-, protein-, and pathogenic levels. The same breakpoint line across four tiers will classify between FG involving or non-involving zone with multiple types of functional features.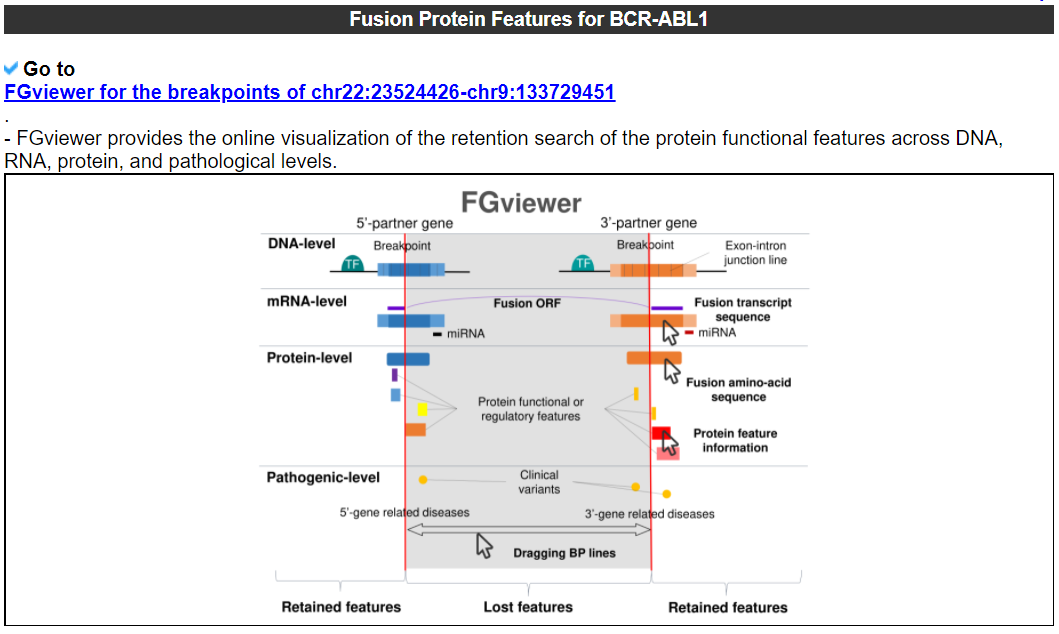
This image shows the introduction of FGviewer and link to have the functional feature visualization and analysis of fusion genes.
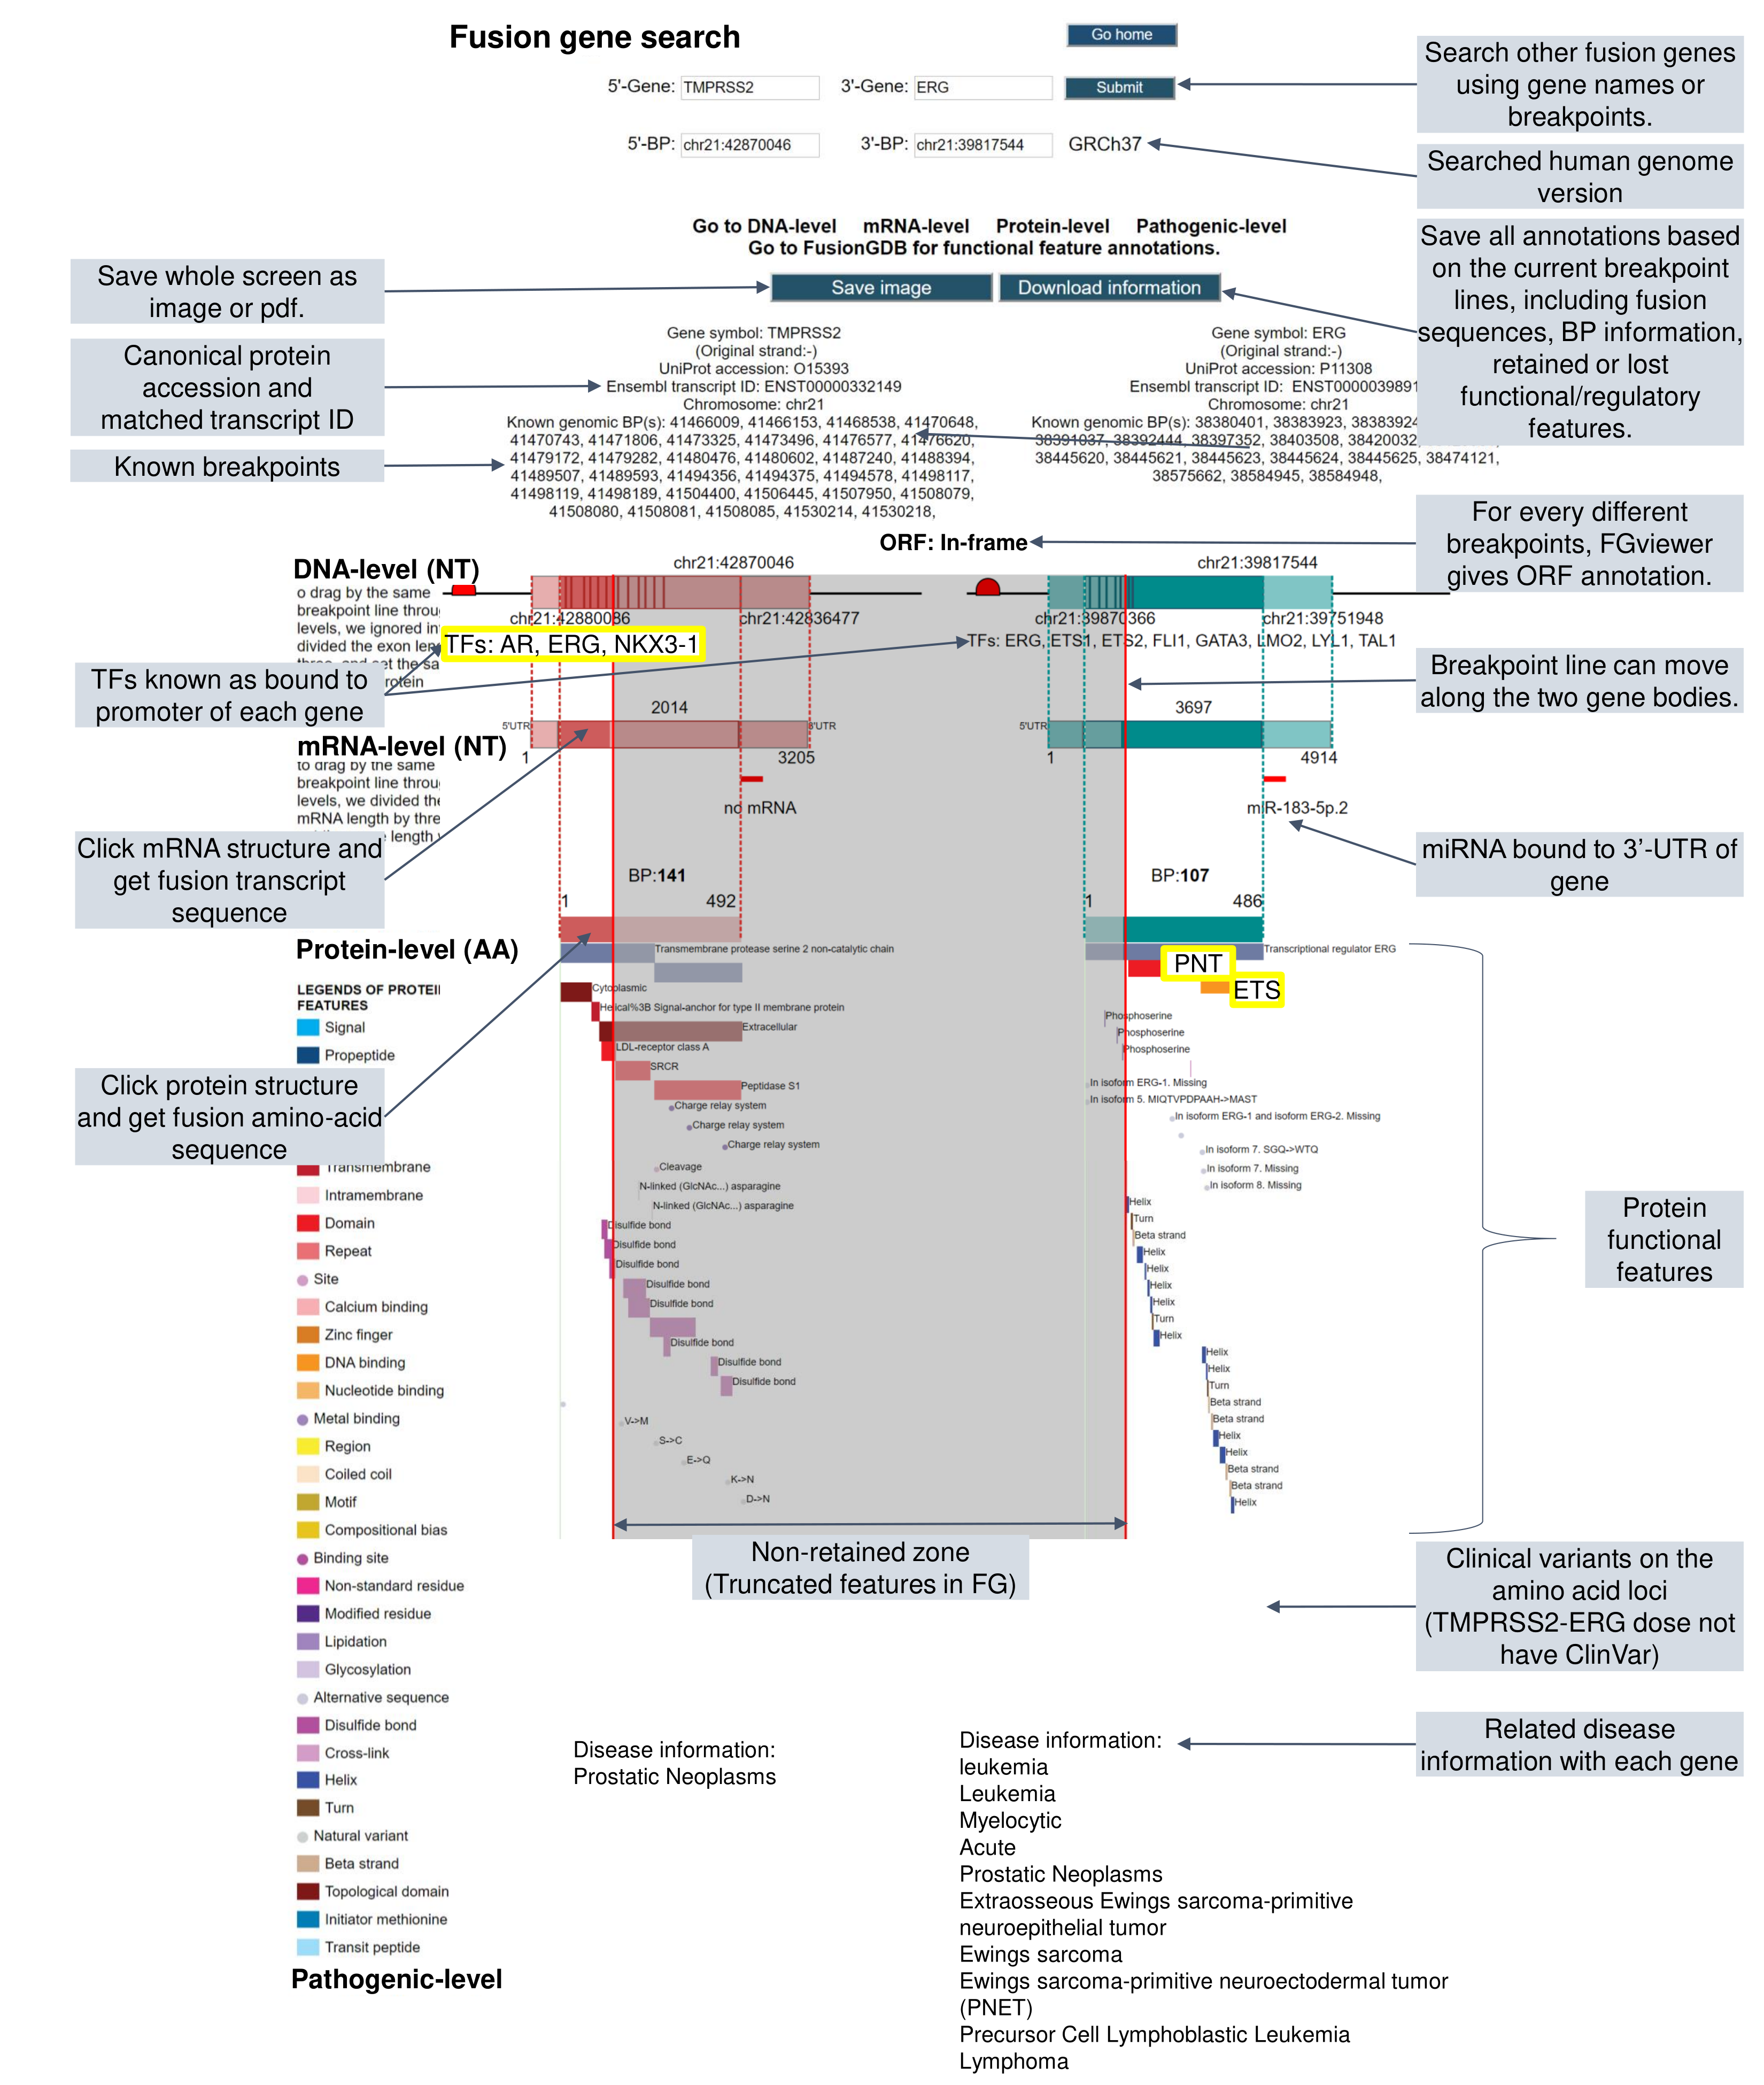
This image shows the overview of the FGviewer result page of the TMPRSS2-ERG query search.
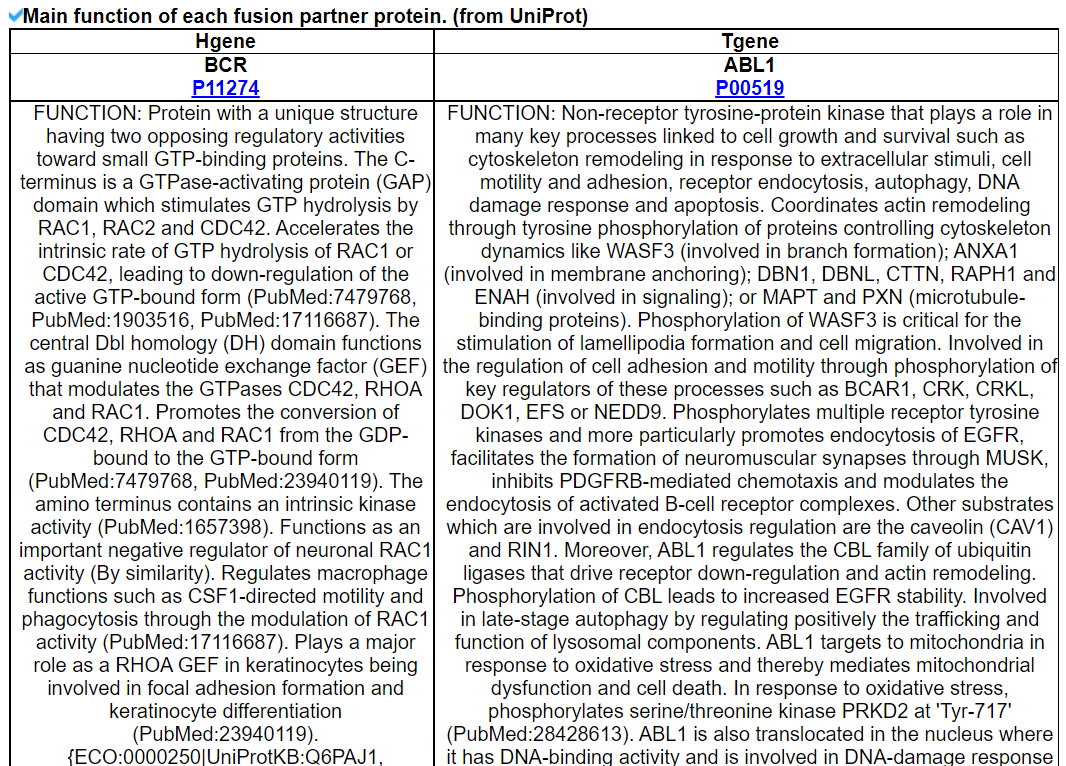
This image shows the protein function information of each fusion partner protein.
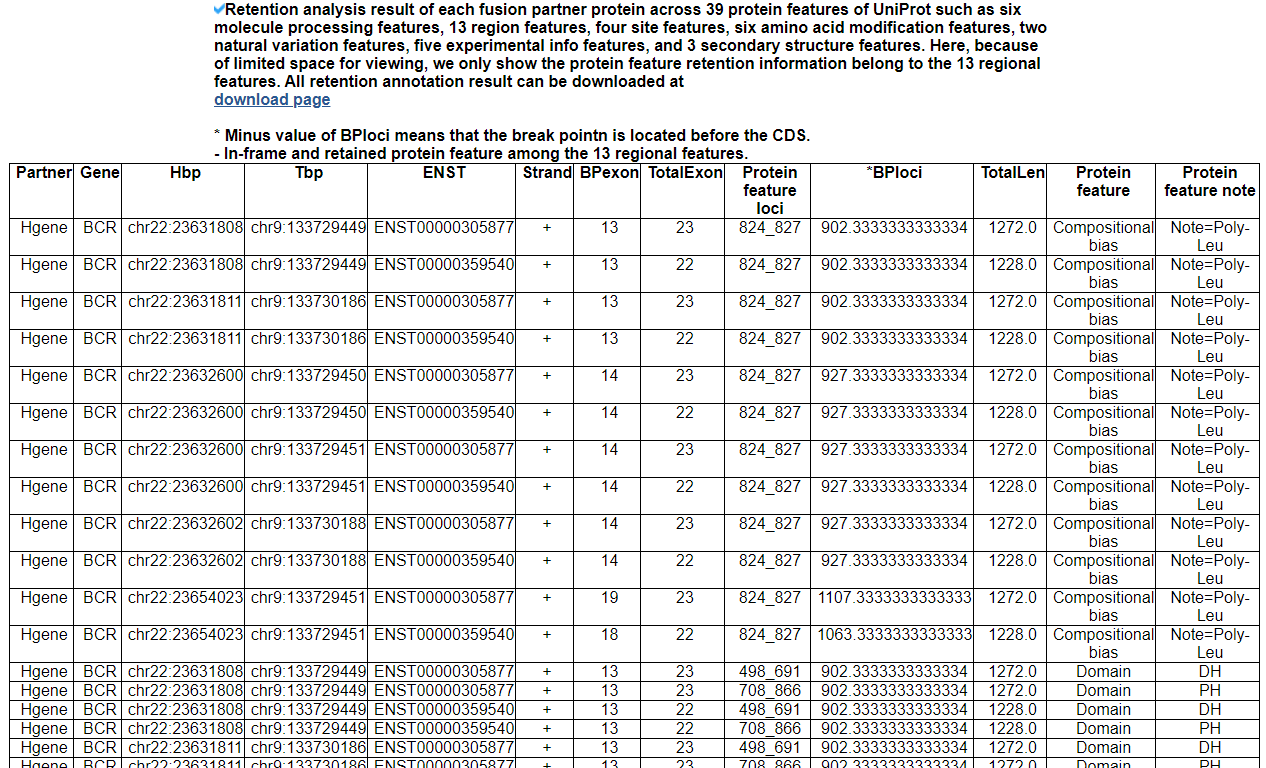
 Retention analysis result of each fusion partner protein across 39 protein features of UniProt. (Six molecule processing features, 13 region features, four site features, six amino acid modification features, two natural variation features, five experimental info features, and 3 secondary structure features)
Here, because of limited space for viewing, we only show the protein feature retention information belong to the 13 regional features. All retention annotation results can be downloaded at
download page
.* Minus value of BPloci means that the break point is located before the CDS.
- In-frame and retained protein feature among the 13 regional features.
After fusion protein formed, these protein domains or features were still intact.
5) Fusion Gene Sequences.
This category provides the fusion transcript and amino acid sequences based on multiple iso-fusion gene structures.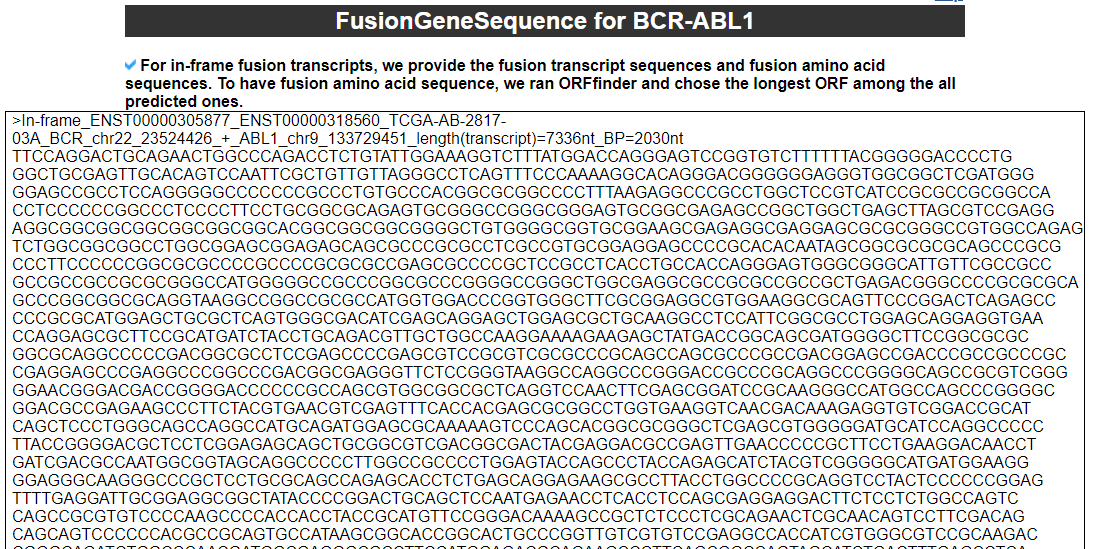
* Fusion transcript sequences.
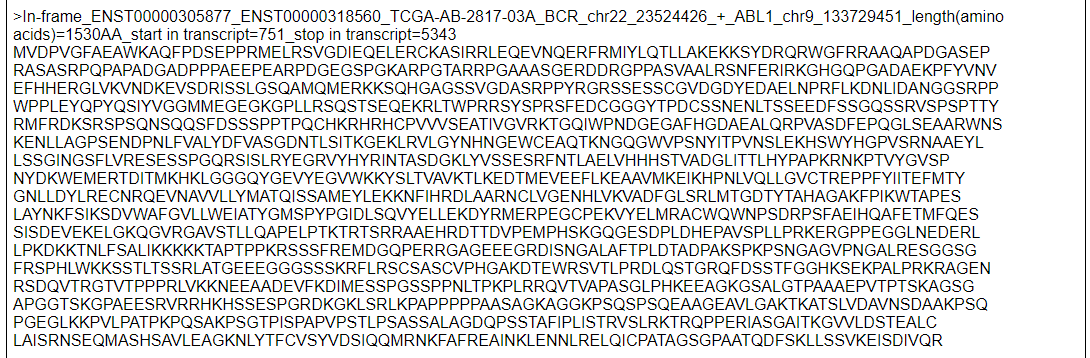
* Fusion amino acid sequence.
6) Fusion Gene PPI Analysis category
Fusion Gene PPI analysis category provides the fusion proteins’ protein-protein interaction information that is anticipated as losing or retaining their interactions due to fusion breakages. This image shows the protein-protein interactors and possible network links.
7) Related Drugs category
This table provides the DrugBank information related to each fusion partner.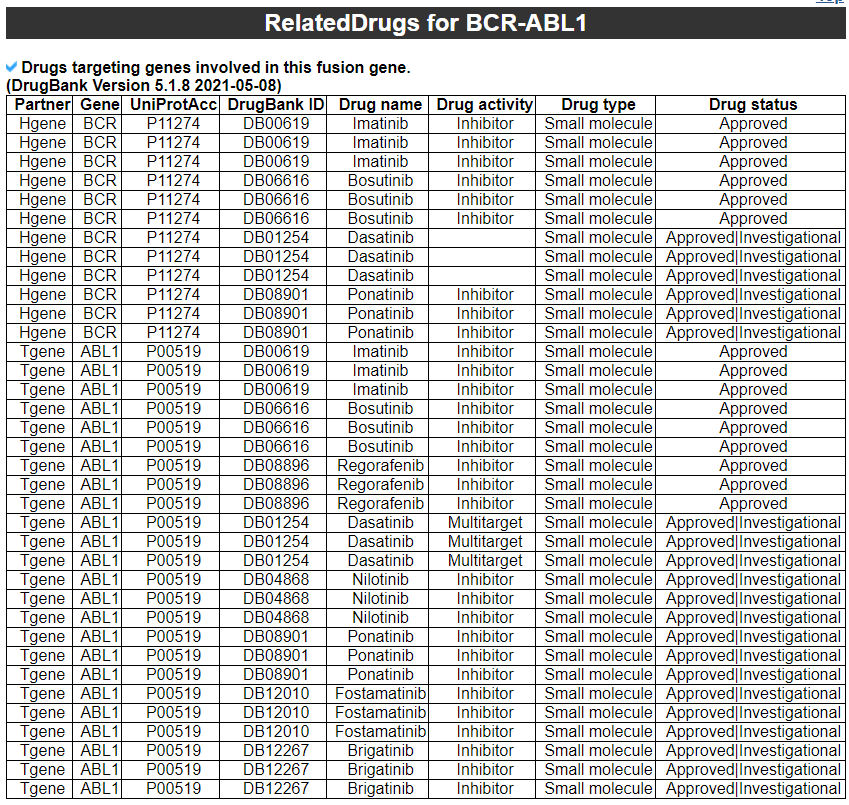
8) Related Diseases category
This table provides disease information related to each fusion partner.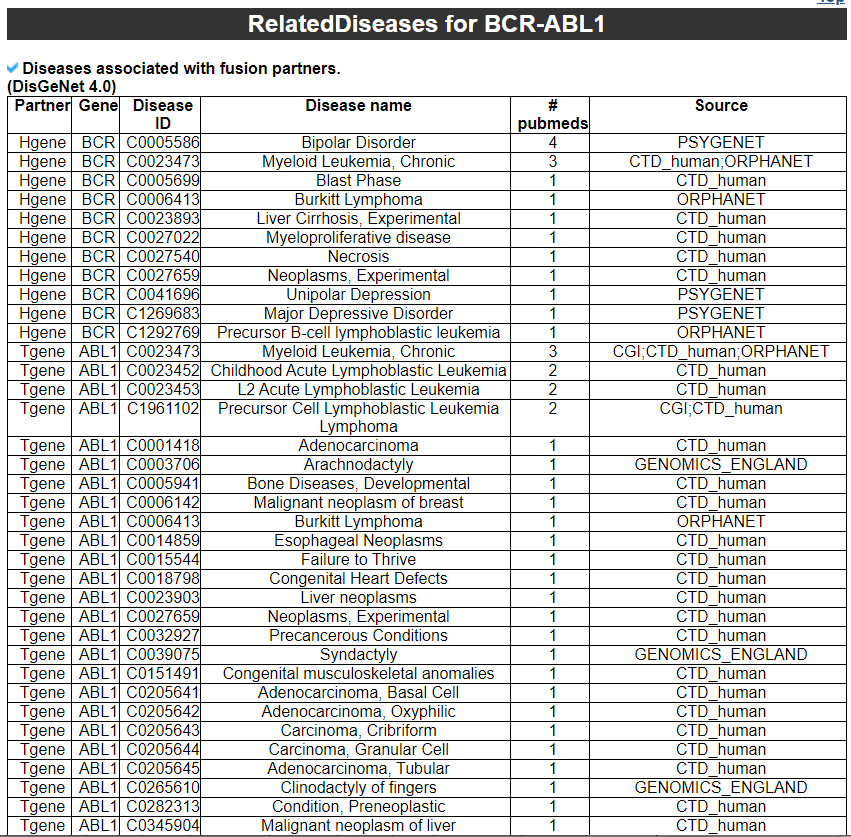
7. Download data and contact us
Please go to download page and contact page. Copyright 2021-Present
The University of Texas Health Science Center at Houston (UTHealth)
Web File Viewing | Emergency Information
Campus Carry|Site Policies