|
|||||||
|

Fusion Protein:NDUFS2-ATP1A3 |
Fusion Gene and Fusion Protein Summary |
 Fusion gene summary Fusion gene summary |
| Fusion partner gene information | Fusion gene name: NDUFS2-ATP1A3 | FusionPDB ID: 58228 | FusionGDB2.0 ID: 58228 | Hgene | Tgene | Gene symbol | NDUFS2 | ATP1A3 | Gene ID | 4720 | 478 |
| Gene name | NADH:ubiquinone oxidoreductase core subunit S2 | ATPase Na+/K+ transporting subunit alpha 3 | |
| Synonyms | CI-49|MC1DN6 | AHC2|ATP1A1|CAPOS|DYT12|RDP | |
| Cytomap | 1q23.3 | 19q13.2 | |
| Type of gene | protein-coding | protein-coding | |
| Description | NADH dehydrogenase [ubiquinone] iron-sulfur protein 2, mitochondrialCI-49kDNADH dehydrogenase (ubiquinone) Fe-S protein 2, 49kDa (NADH-coenzyme Q reductase)NADH-ubiquinone oxidoreductase 49 kDa subunitNADH-ubiquinone oxidoreductase NDUFS2 subunitcomp | sodium/potassium-transporting ATPase subunit alpha-3ATPase, Na+/K+ transporting, alpha 3 polypeptideNa(+)/K(+) ATPase alpha(III) subunitNa(+)/K(+) ATPase alpha-3 subunitNa+, K+ activated adenosine triphosphatase alpha subunitNa+/K+ ATPase 3sodium pu | |
| Modification date | 20200313 | 20200313 | |
| UniProtAcc | O75306 Main function of 5'-partner protein: FUNCTION: Core subunit of the mitochondrial membrane respiratory chain NADH dehydrogenase (Complex I) which catalyzes electron transfer from NADH through the respiratory chain, using ubiquinone as an electron acceptor (PubMed:30922174, PubMed:22036843). Essential for the catalytic activity of complex I (PubMed:30922174, PubMed:22036843). Essential for the assembly of complex I (By similarity). Redox-sensitive, critical component of the oxygen-sensing pathway in the pulmonary vasculature which plays a key role in acute pulmonary oxygen-sensing and hypoxic pulmonary vasoconstriction (PubMed:30922174). Plays an important role in carotid body sensing of hypoxia (By similarity). Essential for glia-like neural stem and progenitor cell proliferation, differentiation and subsequent oligodendrocyte or neuronal maturation (By similarity). {ECO:0000250|UniProtKB:Q91WD5, ECO:0000269|PubMed:22036843, ECO:0000269|PubMed:30922174}. | P13637 Main function of 5'-partner protein: FUNCTION: This is the catalytic component of the active enzyme, which catalyzes the hydrolysis of ATP coupled with the exchange of sodium and potassium ions across the plasma membrane. This action creates the electrochemical gradient of sodium and potassium ions, providing the energy for active transport of various nutrients. | |
| Ensembl transtripts involved in fusion gene | ENST ids | ENST00000465923, ENST00000367993, ENST00000392179, ENST00000476409, | ENST00000302102, ENST00000543770, ENST00000545399, ENST00000602133, ENST00000468774, |
| Fusion gene scores for assessment (based on all fusion genes of FusionGDB 2.0) | * DoF score | 6 X 6 X 4=144 | 4 X 4 X 3=48 |
| # samples | 6 | 4 | |
| ** MAII score | log2(6/144*10)=-1.26303440583379 possibly effective Gene in Pan-Cancer Fusion Genes (peGinPCFGs). DoF>8 and MAII<0 | log2(4/48*10)=-0.263034405833794 possibly effective Gene in Pan-Cancer Fusion Genes (peGinPCFGs). DoF>8 and MAII<0 | |
| Fusion gene context | PubMed: NDUFS2 [Title/Abstract] AND ATP1A3 [Title/Abstract] AND fusion [Title/Abstract] | ||
| Fusion neoantigen context | PubMed: NDUFS2 [Title/Abstract] AND ATP1A3 [Title/Abstract] AND neoantigen [Title/Abstract] | ||
| Most frequent breakpoint (based on all fusion genes of FusionGDB 2.0) | NDUFS2(161182190)-ATP1A3(42482933), # samples:1 | ||
| Anticipated loss of major functional domain due to fusion event. | NDUFS2-ATP1A3 seems lost the major protein functional domain in Hgene partner, which is a CGC by not retaining the major functional domain in the partially deleted in-frame ORF. NDUFS2-ATP1A3 seems lost the major protein functional domain in Hgene partner, which is a essential gene by not retaining the major functional domain in the partially deleted in-frame ORF. | ||
| * DoF score (Degree of Frequency) = # partners X # break points X # cancer types ** MAII score (Major Active Isofusion Index) = log2(# samples/DoF score*10) |
| Gene ontology of each fusion partner gene with evidence of Inferred from Direct Assay (IDA) from Entrez |
| Partner | Gene | GO ID | GO term | PubMed ID |
| Hgene | NDUFS2 | GO:0006979 | response to oxidative stress | 12857734 |
| Tgene | ATP1A3 | GO:0006883 | cellular sodium ion homeostasis | 10636900 |
| Tgene | ATP1A3 | GO:0030007 | cellular potassium ion homeostasis | 10636900 |
| Tgene | ATP1A3 | GO:0036376 | sodium ion export across plasma membrane | 10636900 |
| Tgene | ATP1A3 | GO:1990573 | potassium ion import across plasma membrane | 10636900 |
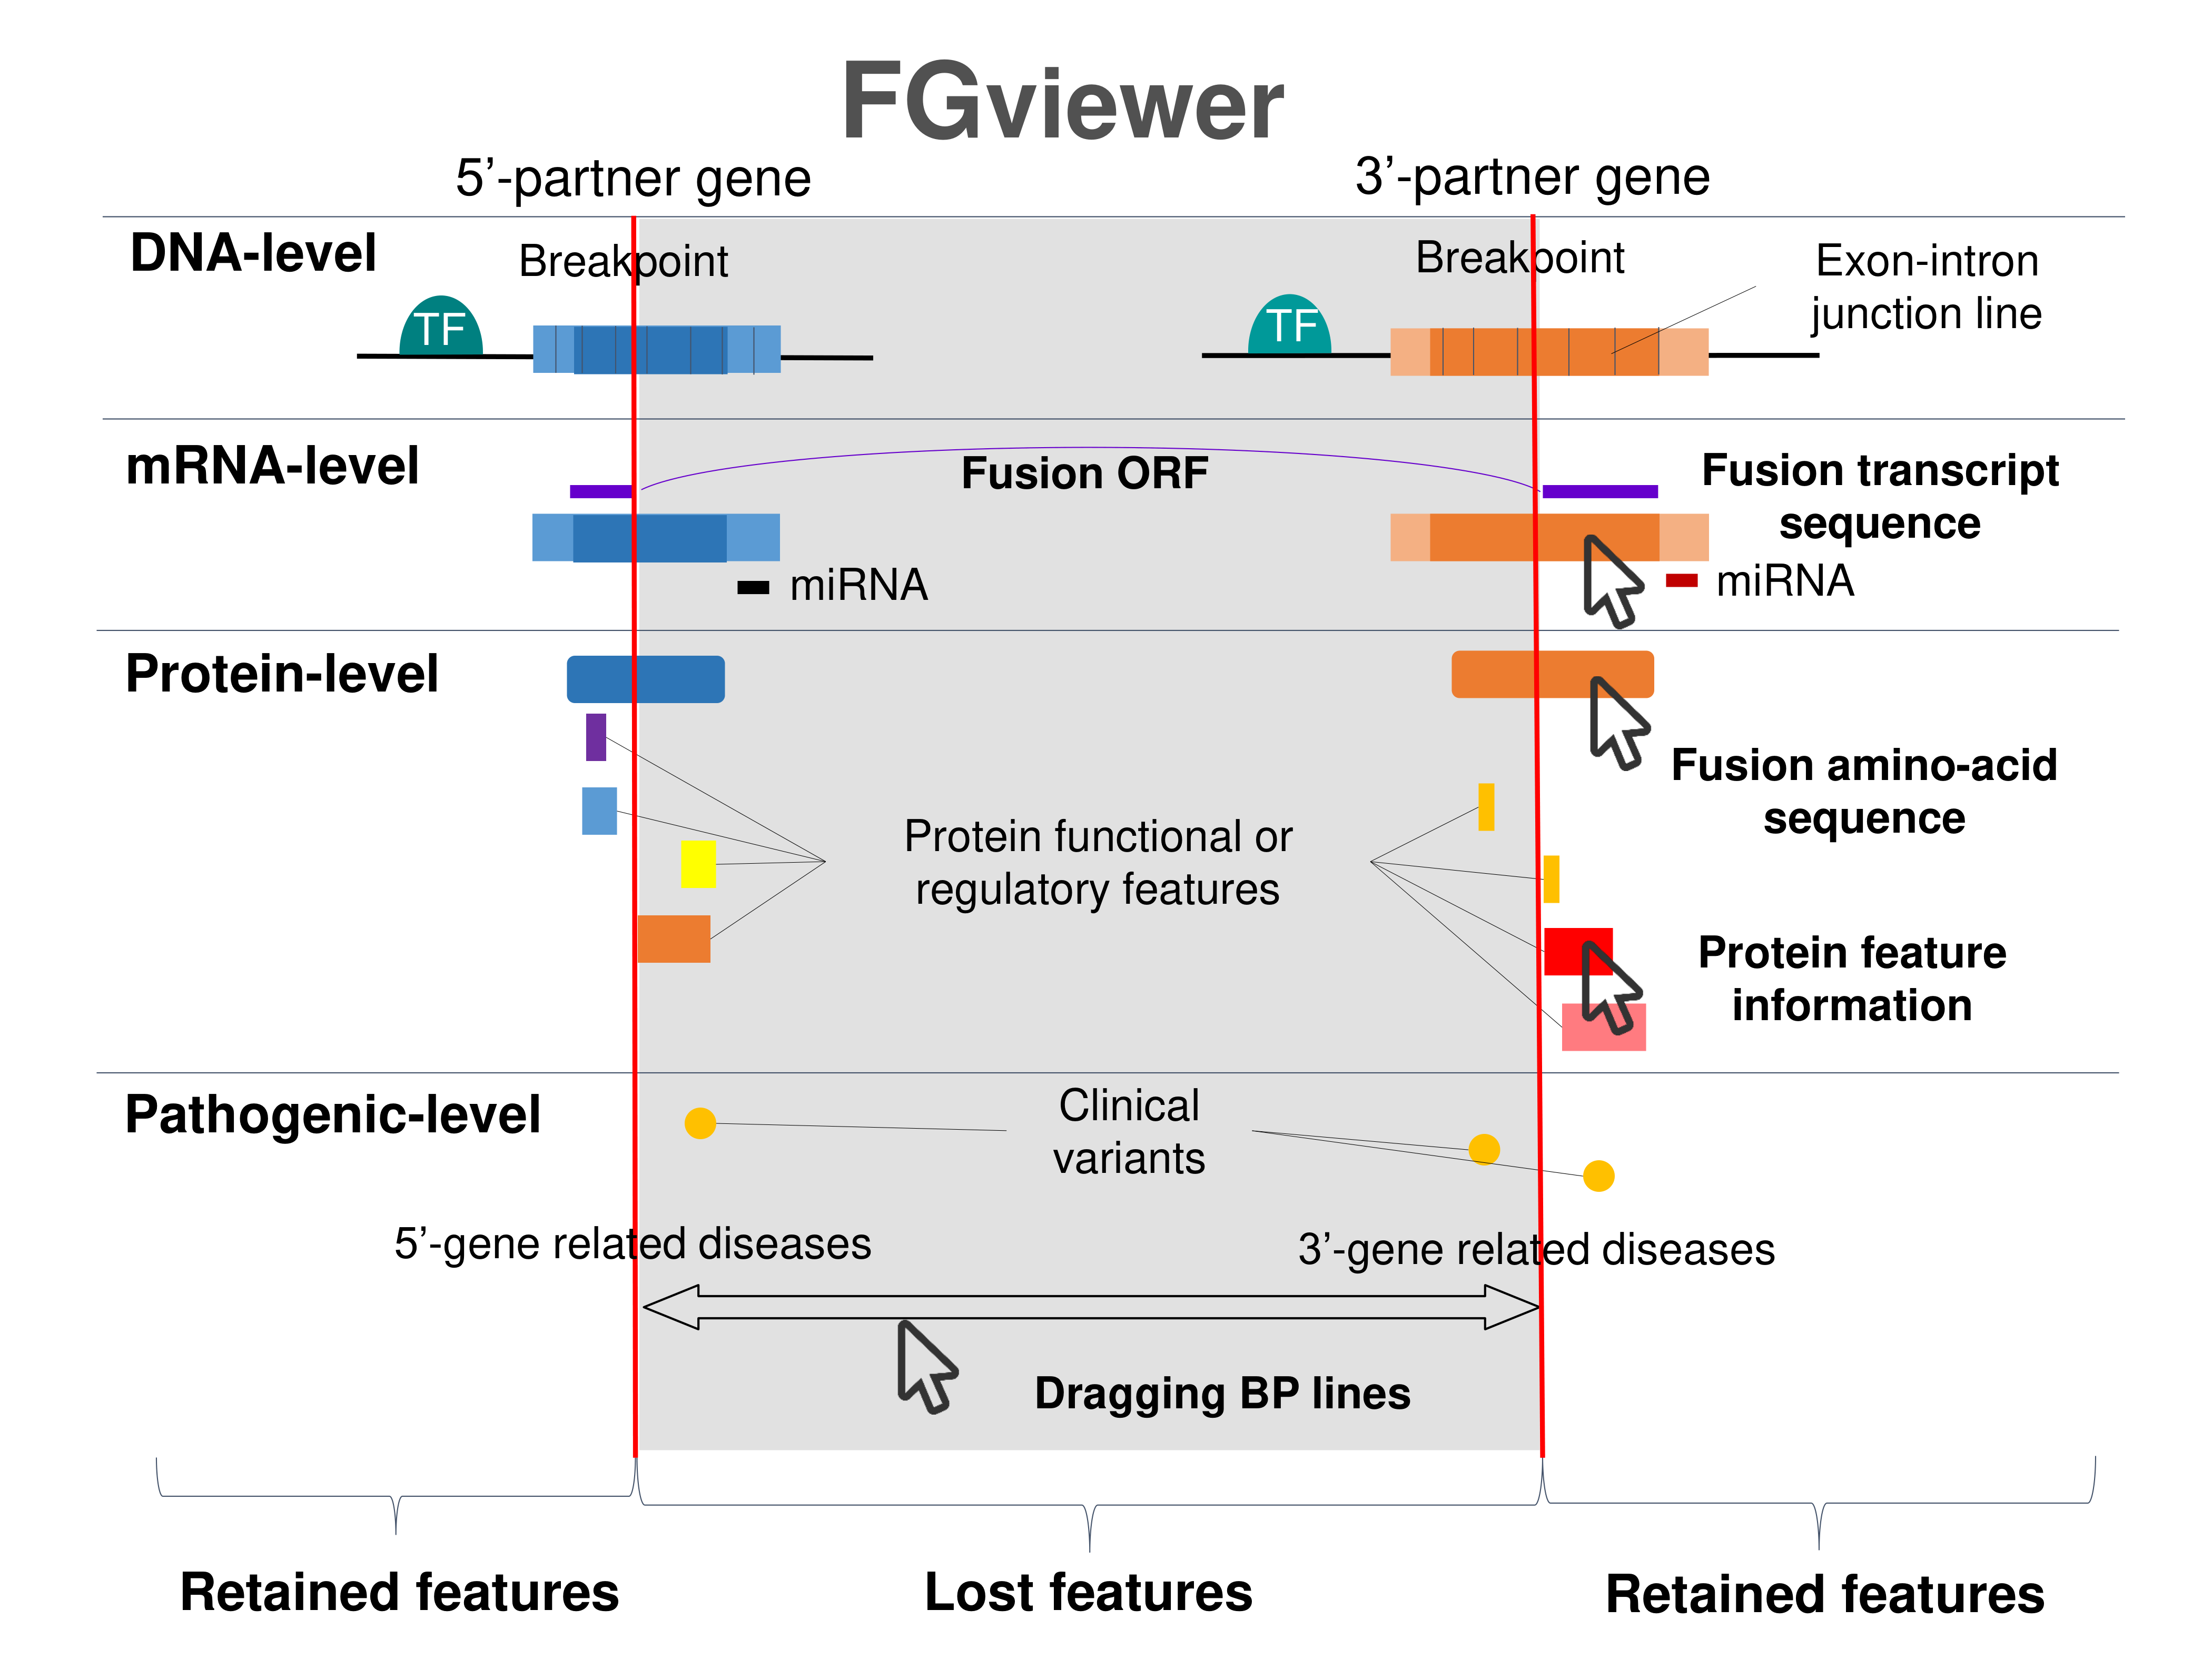
| Four levels of functional features of fusion genes Go to FGviewer search page for the most frequent breakpoint (https://ccsmweb.uth.edu/FGviewer/chr1:161182190/chr19:42482933) - FGviewer provides the online visualization of the retention search of the protein functional features across DNA, RNA, protein, and pathological levels. - How to search 1. Put your fusion gene symbol. 2. Press the tab key until there will be shown the breakpoint information filled. 4. Go down and press 'Search' tab twice. 4. Go down to have the hyperlink of the search result. 5. Click the hyperlink. 6. See the FGviewer result for your fusion gene. |
 |
| Retention analysis results of each fusion partner protein across 39 protein features of UniProt such as six molecule processing features, 13 region features, four site features, six amino acid modification features, two natural variation features, five experimental info features, and 3 secondary structure features, are available here. |
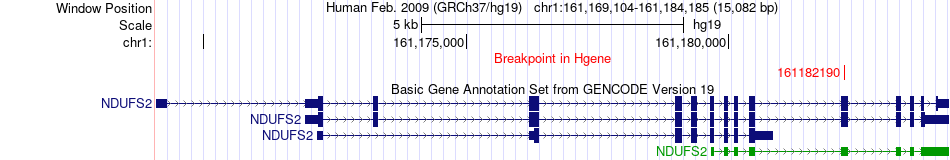
| Fusion gene breakpoints across NDUFS2 (5'-gene) * Click on the image to open the UCSC genome browser with custom track showing this image in a new window. |
 |
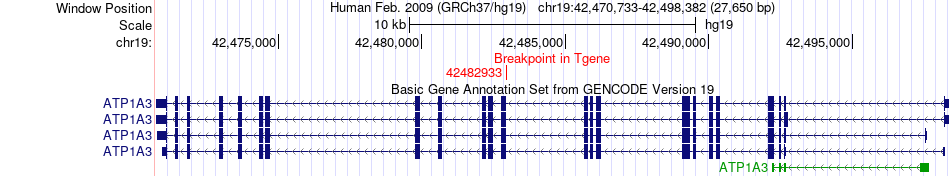
| Fusion gene breakpoints across ATP1A3 (3'-gene) * Click on the image to open the UCSC genome browser with custom track showing this image in a new window. |
 |
Top |
Fusion Amino Acid Sequences |
| Fusion information from ORFfinder translation from full-length transcript sequence from FusionPDB. |
| Henst | Tenst | Hgene | Hchr | Hbp | Hstrand | Tgene | Tchr | Tbp | Tstrand | Seq length (transcript) | BP loci (transcript) | Predicted start (transcript) | Predicted stop (transcript) | Seq length (amino acids) |
| ENST00000367993 | NDUFS2 | chr1 | 161182190 | + | ENST00000302102 | ATP1A3 | chr19 | 42482933 | - | 3457 | 1514 | 448 | 1473 | 341 |
| ENST00000367993 | NDUFS2 | chr1 | 161182190 | + | ENST00000545399 | ATP1A3 | chr19 | 42482933 | - | 3455 | 1514 | 448 | 1473 | 341 |
| ENST00000367993 | NDUFS2 | chr1 | 161182190 | + | ENST00000543770 | ATP1A3 | chr19 | 42482933 | - | 3418 | 1514 | 448 | 1473 | 341 |
| ENST00000367993 | NDUFS2 | chr1 | 161182190 | + | ENST00000602133 | ATP1A3 | chr19 | 42482933 | - | 3257 | 1514 | 448 | 1473 | 341 |
| ENST00000392179 | NDUFS2 | chr1 | 161182190 | + | ENST00000302102 | ATP1A3 | chr19 | 42482933 | - | 3248 | 1305 | 239 | 1264 | 341 |
| ENST00000392179 | NDUFS2 | chr1 | 161182190 | + | ENST00000545399 | ATP1A3 | chr19 | 42482933 | - | 3246 | 1305 | 239 | 1264 | 341 |
| ENST00000392179 | NDUFS2 | chr1 | 161182190 | + | ENST00000543770 | ATP1A3 | chr19 | 42482933 | - | 3209 | 1305 | 239 | 1264 | 341 |
| ENST00000392179 | NDUFS2 | chr1 | 161182190 | + | ENST00000602133 | ATP1A3 | chr19 | 42482933 | - | 3048 | 1305 | 239 | 1264 | 341 |
| DeepORF prediction of the coding potential based on the fusion transcript sequence of in-frame fusion genes. DeepORF is a coding potential classifier based on convolutional neural network by comparing the real Ribo-seq data. If the no-coding score < 0.5 and coding score > 0.5, then the in-frame fusion transcript is predicted as being likely translated. |
| Henst | Tenst | Hgene | Hchr | Hbp | Hstrand | Tgene | Tchr | Tbp | Tstrand | No-coding score | Coding score |
| ENST00000367993 | ENST00000302102 | NDUFS2 | chr1 | 161182190 | + | ATP1A3 | chr19 | 42482933 | - | 0.00172054 | 0.99827945 |
| ENST00000367993 | ENST00000545399 | NDUFS2 | chr1 | 161182190 | + | ATP1A3 | chr19 | 42482933 | - | 0.001725337 | 0.9982747 |
| ENST00000367993 | ENST00000543770 | NDUFS2 | chr1 | 161182190 | + | ATP1A3 | chr19 | 42482933 | - | 0.001789653 | 0.9982103 |
| ENST00000367993 | ENST00000602133 | NDUFS2 | chr1 | 161182190 | + | ATP1A3 | chr19 | 42482933 | - | 0.001646638 | 0.99835336 |
| ENST00000392179 | ENST00000302102 | NDUFS2 | chr1 | 161182190 | + | ATP1A3 | chr19 | 42482933 | - | 0.001721982 | 0.998278 |
| ENST00000392179 | ENST00000545399 | NDUFS2 | chr1 | 161182190 | + | ATP1A3 | chr19 | 42482933 | - | 0.001722606 | 0.9982774 |
| ENST00000392179 | ENST00000543770 | NDUFS2 | chr1 | 161182190 | + | ATP1A3 | chr19 | 42482933 | - | 0.001792321 | 0.9982077 |
| ENST00000392179 | ENST00000602133 | NDUFS2 | chr1 | 161182190 | + | ATP1A3 | chr19 | 42482933 | - | 0.001601805 | 0.99839824 |
| Predicted full-length fusion amino acid sequences. For individual full-length fusion transcript sequence from FusionPDB, we ran ORFfinder and chose the longest ORF among all the predicted ones. |
Get the fusion protein sequences from here. |
| Fusion protein sequence information is available in the fasta format. >FusionGDB ID_FusionGDB isoform ID_FGname_Hgene_Hchr_Hbp_Henst_Tgene_Tchr_Tbp_Tenst_length(fusion AA) seq_BP |
Top |
Fusion Protein Breakpoint Sequences for NDUFS2-ATP1A3 |
| +/-13 AA sequence from the breakpoints of the fusion protein sequences. |
| Hgene | Hchr | Hbp | Tgene | Tchr | Tbp | Length(fusion protein) | BP in fusion protein | Peptide |
Top |
Potential FusionNeoAntigen Information of NDUFS2-ATP1A3 in HLA I |
| Multiple sequence alignments of the potential FusionNeoAntigens per fusion breakpoints. If the MSA is empty, then it means that there were predicted fusion neoantigens in this fusion breakpoint, but those predicted fusion neoantigens were not across the breakpoint, which is not fusion-specific. |
| Potential FusionNeoAntigen Information * We used NetMHCpan v4.1 (%rank<0.5) and deepHLApan v1.1 (immunogenic score>0.5) |
| Fusion gene | Hchr | Hbp | Tgene | Tchr | Tbp | HLA I | FusionNeoAntigen peptide | Binding score | Immunogenic score | Neoantigen start (at BP 13) | Neoantigen end (at BP 13) |
Top |
Potential FusionNeoAntigen Information of NDUFS2-ATP1A3 in HLA II |
| Multiple sequence alignments of the potential FusionNeoAntigens per fusion breakpoints. If the MSA is empty, then it means that there were predicted fusion neoantigens in this fusion breakpoint, but those predicted fusion neoantigens were not across the breakpoint, which is not fusion-specific. |
| Potential FusionNeoAntigen Information * We used NetMHCIIpan v4.1 (%rank<0.5). |
| Fusion gene | Hchr | Hbp | Tgene | Tchr | Tbp | HLA II | FusionNeoAntigen peptide | Neoantigen start (at BP 13) | Neoantigen end (at BP 13) |
Top |
Fusion breakpoint peptide structures of NDUFS2-ATP1A3 |
| 3D structures of the fusion breakpoint peptide of 14AA sequence that have potential fusion neoantigens * The minimum length of the amino acid sequence in RoseTTAFold is 14AA. Here, we predicted the 14AA fusion protein breakpoint sequence not the fusion neoantigen peptide, which is shorter than 14 AA. |
Top |
Filtering FusionNeoAntigens Through Checking the Interaction with HLAs in 3D of NDUFS2-ATP1A3 |
| Virtual screening between 25 HLAs (from PDB) and FusionNeoAntigens * We used Glide to predict the interaction between HLAs and neoantigens. |
| HLA allele | PDB ID | File name | BPseq | Docking score | Glide score |
Top |
Vaccine Design for the FusionNeoAntigens of NDUFS2-ATP1A3 |
| mRNA and peptide sequences of FusionNeoAntigens that have potential interaction with HLA-Is. |
| Fusion gene | Hchr | Hbp | Tchr | Tbp | Start in +/-13AA | End in +/-13AA | FusionNeoAntigen peptide sequence | FusionNeoAntigen RNA sequence |
| mRNA and peptide sequences of FusionNeoAntigens that have potential interaction with HLA-IIs. |
| Fusion gene | Hchr | Hbp | Tchr | Tbp | Start in +/-13AA | End in +/-13AA | FusionNeoAntigen peptide | FusionNEoAntigen RNA sequence |
Top |
Information of the samples that have these potential fusion neoantigens of NDUFS2-ATP1A3 |
| These samples were reported as having these fusion breakpoints. For individual breakpoints, we checked the open reading frames considering multiple gene isoforms and chose the in-frame fusion genes only. Then, we made fusion protein sequences and predicted the fusion neoantigens. These fusion-positive samples may have these potential fusion neoantigens. |
| Cancer type | Fusion gene | Hchr | Hbp | Henst | Tchr | Tbp | Tenst | Sample |
Top |
Potential target of CAR-T therapy development for NDUFS2-ATP1A3 |
| Predicted 3D structure. We used RoseTTAFold. |
| Retention analysis result of each fusion partner protein across 39 protein features of UniProt such as six molecule processing features, 13 region features, four site features, six amino acid modification features, two natural variation features, five experimental info features, and 3 secondary structure features. Here, to provide the retention of the transmembrane domain, we only show the protein feature retention information of those transmembrane features * Minus value of BPloci means that the break point is located before the CDS. |
| - In-frame and retained 'Transmembrane'. |
| Partner | Gene | Hbp | Tbp | ENST | Strand | BPexon | TotalExon | Protein feature loci | *BPloci | TotalLen | Protein feature | Protein feature note |
| Tgene | ATP1A3 | chr1:161182190 | chr19:42482933 | ENST00000302102 | 0 | 23 | 122_142 | 0 | 1014.0 | Transmembrane | Helical | |
| Tgene | ATP1A3 | chr1:161182190 | chr19:42482933 | ENST00000302102 | 0 | 23 | 279_298 | 0 | 1014.0 | Transmembrane | Helical | |
| Tgene | ATP1A3 | chr1:161182190 | chr19:42482933 | ENST00000302102 | 0 | 23 | 311_328 | 0 | 1014.0 | Transmembrane | Helical | |
| Tgene | ATP1A3 | chr1:161182190 | chr19:42482933 | ENST00000302102 | 0 | 23 | 763_782 | 0 | 1014.0 | Transmembrane | Helical | |
| Tgene | ATP1A3 | chr1:161182190 | chr19:42482933 | ENST00000302102 | 0 | 23 | 78_98 | 0 | 1014.0 | Transmembrane | Helical | |
| Tgene | ATP1A3 | chr1:161182190 | chr19:42482933 | ENST00000302102 | 0 | 23 | 793_813 | 0 | 1014.0 | Transmembrane | Helical | |
| Tgene | ATP1A3 | chr1:161182190 | chr19:42482933 | ENST00000302102 | 0 | 23 | 834_856 | 0 | 1014.0 | Transmembrane | Helical | |
| Tgene | ATP1A3 | chr1:161182190 | chr19:42482933 | ENST00000302102 | 0 | 23 | 909_928 | 0 | 1014.0 | Transmembrane | Helical | |
| Tgene | ATP1A3 | chr1:161182190 | chr19:42482933 | ENST00000302102 | 0 | 23 | 942_960 | 0 | 1014.0 | Transmembrane | Helical | |
| Tgene | ATP1A3 | chr1:161182190 | chr19:42482933 | ENST00000302102 | 0 | 23 | 976_996 | 0 | 1014.0 | Transmembrane | Helical | |
| Tgene | ATP1A3 | chr1:161182190 | chr19:42482933 | ENST00000543770 | 0 | 23 | 122_142 | 0 | 1025.0 | Transmembrane | Helical | |
| Tgene | ATP1A3 | chr1:161182190 | chr19:42482933 | ENST00000543770 | 0 | 23 | 279_298 | 0 | 1025.0 | Transmembrane | Helical | |
| Tgene | ATP1A3 | chr1:161182190 | chr19:42482933 | ENST00000543770 | 0 | 23 | 311_328 | 0 | 1025.0 | Transmembrane | Helical | |
| Tgene | ATP1A3 | chr1:161182190 | chr19:42482933 | ENST00000543770 | 0 | 23 | 763_782 | 0 | 1025.0 | Transmembrane | Helical | |
| Tgene | ATP1A3 | chr1:161182190 | chr19:42482933 | ENST00000543770 | 0 | 23 | 78_98 | 0 | 1025.0 | Transmembrane | Helical | |
| Tgene | ATP1A3 | chr1:161182190 | chr19:42482933 | ENST00000543770 | 0 | 23 | 793_813 | 0 | 1025.0 | Transmembrane | Helical | |
| Tgene | ATP1A3 | chr1:161182190 | chr19:42482933 | ENST00000543770 | 0 | 23 | 834_856 | 0 | 1025.0 | Transmembrane | Helical | |
| Tgene | ATP1A3 | chr1:161182190 | chr19:42482933 | ENST00000543770 | 0 | 23 | 909_928 | 0 | 1025.0 | Transmembrane | Helical | |
| Tgene | ATP1A3 | chr1:161182190 | chr19:42482933 | ENST00000543770 | 0 | 23 | 942_960 | 0 | 1025.0 | Transmembrane | Helical | |
| Tgene | ATP1A3 | chr1:161182190 | chr19:42482933 | ENST00000543770 | 0 | 23 | 976_996 | 0 | 1025.0 | Transmembrane | Helical | |
| Tgene | ATP1A3 | chr1:161182190 | chr19:42482933 | ENST00000545399 | 0 | 23 | 122_142 | 0 | 1027.0 | Transmembrane | Helical | |
| Tgene | ATP1A3 | chr1:161182190 | chr19:42482933 | ENST00000545399 | 0 | 23 | 279_298 | 0 | 1027.0 | Transmembrane | Helical | |
| Tgene | ATP1A3 | chr1:161182190 | chr19:42482933 | ENST00000545399 | 0 | 23 | 311_328 | 0 | 1027.0 | Transmembrane | Helical | |
| Tgene | ATP1A3 | chr1:161182190 | chr19:42482933 | ENST00000545399 | 0 | 23 | 763_782 | 0 | 1027.0 | Transmembrane | Helical | |
| Tgene | ATP1A3 | chr1:161182190 | chr19:42482933 | ENST00000545399 | 0 | 23 | 78_98 | 0 | 1027.0 | Transmembrane | Helical | |
| Tgene | ATP1A3 | chr1:161182190 | chr19:42482933 | ENST00000545399 | 0 | 23 | 793_813 | 0 | 1027.0 | Transmembrane | Helical | |
| Tgene | ATP1A3 | chr1:161182190 | chr19:42482933 | ENST00000545399 | 0 | 23 | 834_856 | 0 | 1027.0 | Transmembrane | Helical | |
| Tgene | ATP1A3 | chr1:161182190 | chr19:42482933 | ENST00000545399 | 0 | 23 | 909_928 | 0 | 1027.0 | Transmembrane | Helical | |
| Tgene | ATP1A3 | chr1:161182190 | chr19:42482933 | ENST00000545399 | 0 | 23 | 942_960 | 0 | 1027.0 | Transmembrane | Helical | |
| Tgene | ATP1A3 | chr1:161182190 | chr19:42482933 | ENST00000545399 | 0 | 23 | 976_996 | 0 | 1027.0 | Transmembrane | Helical |
| Subcellular localization prediction of the transmembrane domain retained fusion proteins * We used DeepLoc 1.0. The order of the X-axis of the barplot is as follows: Entry_ID, Localization, Type, Nucleus, Cytoplasm, Extracellular, Mitochondrion, Cell_membrane, Endoplasmic_reticulum, Plastid, Golgi.apparatus, Lysosome.Vacuole, Peroxisome. Y-axis is the output score of DeepLoc. Clicking the image will open a new tab with a large image. |
| Hgene | Hchr | Hbp | Henst | Tgene | Tchr | Tbp | Tenst | DeepLoc result |
Top |
Related Drugs to NDUFS2-ATP1A3 |
| Drugs used for this fusion-positive patient. (Manual curation of PubMed, 04-30-2022 + MyCancerGenome) |
| Hgene | Tgene | Drug | Source | PMID |
Top |
Related Diseases to NDUFS2-ATP1A3 |
| Diseases that have this fusion gene. (Manual curation of PubMed, 04-30-2022 + MyCancerGenome) |
| Hgene | Tgene | Disease | Source | PMID |
| Diseases associated with fusion partners. (DisGeNet 4.0) |
| Partner | Gene | Disease ID | Disease name | # pubmeds | Source |
 Copyright 2023-Present
The University of Texas Health Science Center at Houston (UTHealth)
Web File Viewing | Emergency Information
Campus Carry|Site Policies