| UTHEALTH HOME ABOUT SBMI A-Z WEBMAIL INSIDE THE UNIVERSITY |
|
|||||||
|

Fusion Protein:FAM216A-IGF1 |
Fusion Protein Summary |
 Fusion gene summary Fusion gene summary |
| Fusion partner gene information | Fusion gene name: FAM216A-IGF1 | FusionPDB ID: 28924 | FusionGDB2.0 ID: 28924 | Hgene | Tgene | Gene symbol | FAM216A | IGF1 | Gene ID | 29902 | 3479 |
| Gene name | family with sequence similarity 216 member A | insulin like growth factor 1 | |
| Synonyms | C12orf24|HSU79274 | IGF|IGF-I|IGFI|MGF | |
| Cytomap | 12q24.11 | 12q23.2 | |
| Type of gene | protein-coding | protein-coding | |
| Description | protein FAM216Aprotein predicted by clone 23733uncharacterized protein C12orf24 | insulin-like growth factor Iinsulin-like growth factor 1 (somatomedin C)insulin-like growth factor IBmechano growth factorsomatomedin-C | |
| Modification date | 20200313 | 20200322 | |
| UniProtAcc | Q8WUB2 | P08069 | |
| Ensembl transtripts involved in fusion gene | ENST ids | ENST00000377673, | ENST00000307046, ENST00000392904, ENST00000424202, ENST00000481539, ENST00000337514, ENST00000456098, |
| Fusion gene scores for assessment (based on all fusion genes of FusionGDB 2.0) | * DoF score | 1 X 1 X 1=1 | 6 X 5 X 5=150 |
| # samples | 1 | 6 | |
| ** MAII score | log2(1/1*10)=3.32192809488736 | log2(6/150*10)=-1.32192809488736 possibly effective Gene in Pan-Cancer Fusion Genes (peGinPCFGs). DoF>8 and MAII<0 | |
| Context (manual curation of fusion genes in FusionPDB) | PubMed: FAM216A [Title/Abstract] AND IGF1 [Title/Abstract] AND fusion [Title/Abstract] | ||
| Most frequent breakpoint (based on all fusion genes of FusionGDB 2.0) | FAM216A(110910923)-IGF1(102813468), # samples:2 | ||
| Anticipated loss of major functional domain due to fusion event. | FAM216A-IGF1 seems lost the major protein functional domain in Hgene partner, which is a CGC by not retaining the major functional domain in the partially deleted in-frame ORF. FAM216A-IGF1 seems lost the major protein functional domain in Hgene partner, which is a CGC by not retaining the major functional domain in the partially deleted in-frame ORF. FAM216A-IGF1 seems lost the major protein functional domain in Hgene partner, which is a essential gene by not retaining the major functional domain in the partially deleted in-frame ORF. FAM216A-IGF1 seems lost the major protein functional domain in Hgene partner, which is a essential gene by not retaining the major functional domain in the partially deleted in-frame ORF. | ||
| * DoF score (Degree of Frequency) = # partners X # break points X # cancer types ** MAII score (Major Active Isofusion Index) = log2(# samples/DoF score*10) |
| Gene ontology of each fusion partner gene with evidence of Inferred from Direct Assay (IDA) from Entrez |
| Partner | Gene | GO ID | GO term | PubMed ID |
| Tgene | IGF1 | GO:0001775 | cell activation | 22797923 |
| Tgene | IGF1 | GO:0008284 | positive regulation of cell proliferation | 7688386|9722506|12746903 |
| Tgene | IGF1 | GO:0009408 | response to heat | 11404306 |
| Tgene | IGF1 | GO:0010613 | positive regulation of cardiac muscle hypertrophy | 19654000 |
| Tgene | IGF1 | GO:0010629 | negative regulation of gene expression | 29167509 |
| Tgene | IGF1 | GO:0014068 | positive regulation of phosphatidylinositol 3-kinase signaling | 7688386 |
| Tgene | IGF1 | GO:0014834 | skeletal muscle satellite cell maintenance involved in skeletal muscle regeneration | 17531227 |
| Tgene | IGF1 | GO:0014904 | myotube cell development | 17531227 |
| Tgene | IGF1 | GO:0014911 | positive regulation of smooth muscle cell migration | 10766744 |
| Tgene | IGF1 | GO:0030166 | proteoglycan biosynthetic process | 12746903 |
| Tgene | IGF1 | GO:0034392 | negative regulation of smooth muscle cell apoptotic process | 16942485 |
| Tgene | IGF1 | GO:0035630 | bone mineralization involved in bone maturation | 16433617 |
| Tgene | IGF1 | GO:0042104 | positive regulation of activated T cell proliferation | 15694994 |
| Tgene | IGF1 | GO:0042531 | positive regulation of tyrosine phosphorylation of STAT protein | 9722506 |
| Tgene | IGF1 | GO:0043388 | positive regulation of DNA binding | 19654000 |
| Tgene | IGF1 | GO:0043410 | positive regulation of MAPK cascade | 19654000 |
| Tgene | IGF1 | GO:0043568 | positive regulation of insulin-like growth factor receptor signaling pathway | 7688386|10766744 |
| Tgene | IGF1 | GO:0045445 | myoblast differentiation | 17531227 |
| Tgene | IGF1 | GO:0045669 | positive regulation of osteoblast differentiation | 16433617 |
| Tgene | IGF1 | GO:0045725 | positive regulation of glycogen biosynthetic process | 21076856 |
| Tgene | IGF1 | GO:0045821 | positive regulation of glycolytic process | 7688386 |
| Tgene | IGF1 | GO:0045840 | positive regulation of mitotic nuclear division | 7188854|10644978 |
| Tgene | IGF1 | GO:0045893 | positive regulation of transcription, DNA-templated | 9722506|19654000 |
| Tgene | IGF1 | GO:0045944 | positive regulation of transcription by RNA polymerase II | 16433617 |
| Tgene | IGF1 | GO:0046326 | positive regulation of glucose import | 21076856 |
| Tgene | IGF1 | GO:0046579 | positive regulation of Ras protein signal transduction | 9722506 |
| Tgene | IGF1 | GO:0048015 | phosphatidylinositol-mediated signaling | 7692086 |
| Tgene | IGF1 | GO:0048146 | positive regulation of fibroblast proliferation | 7188854 |
| Tgene | IGF1 | GO:0048661 | positive regulation of smooth muscle cell proliferation | 10766744|16942485 |
| Tgene | IGF1 | GO:0050679 | positive regulation of epithelial cell proliferation | 7188854 |
| Tgene | IGF1 | GO:0050731 | positive regulation of peptidyl-tyrosine phosphorylation | 7782332|22635104 |
| Tgene | IGF1 | GO:0051450 | myoblast proliferation | 17531227 |
| Tgene | IGF1 | GO:0061051 | positive regulation of cell growth involved in cardiac muscle cell development | 24117217 |
| Tgene | IGF1 | GO:0070886 | positive regulation of calcineurin-NFAT signaling cascade | 19654000 |
| Tgene | IGF1 | GO:2000679 | positive regulation of transcription regulatory region DNA binding | 15059951 |
| Tgene | IGF1 | GO:2001237 | negative regulation of extrinsic apoptotic signaling pathway | 16942485 |
| Fusion gene breakpoints across FAM216A (5'-gene) * Click on the image to open the UCSC genome browser with custom track showing this image in a new window. |
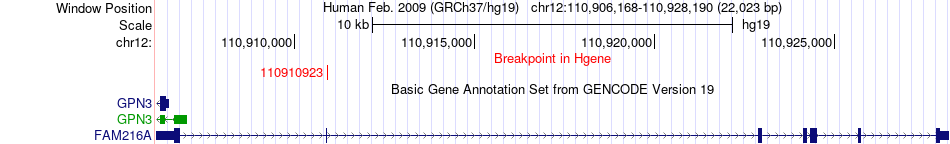 |
| Fusion gene breakpoints across IGF1 (3'-gene) * Click on the image to open the UCSC genome browser with custom track showing this image in a new window. |
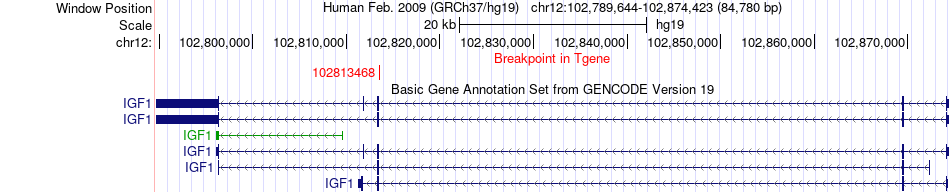 |
Top |
Fusion Gene Sample Information |
| Fusion gene information from FusionGDB2.0. |
| Fusion gene information from two resources (ChiTars 5.0 and ChimerDB 4.0) * All genome coordinats were lifted-over on hg19. * Click on the break point to see the gene structure around the break point region using the UCSC Genome Browser. |
| Source | Disease | Sample | Hgene | Hchr | Hbp | Hstrand | Tgene | Tchr | Tbp | Tstrand |
| ChimerDB4 | MESO | TCGA-TS-A8AY-01A | FAM216A | chr12 | 110910923 | + | IGF1 | chr12 | 102813468 | - |
| ChimerDB4 | MESO | TCGA-TS-A8AY | FAM216A | chr12 | 110910923 | + | IGF1 | chr12 | 102813468 | - |
Top |
Fusion ORF Analysis |
| Fusion information from ORFfinder translation from full-length transcript sequence from FusionPDB. |
| Henst | Tenst | Hgene | Hchr | Hbp | Hstrand | Tgene | Tchr | Tbp | Tstrand | Seq length (transcript) | BP loci (transcript) | Predicted start (transcript) | Predicted stop (transcript) | Seq length (amino acids) |
| ENST00000377673 | FAM216A | chr12 | 110910923 | + | ENST00000456098 | IGF1 | chr12 | 102813468 | - | 7627 | 696 | 222 | 782 | 186 |
| ENST00000377673 | FAM216A | chr12 | 110910923 | + | ENST00000337514 | IGF1 | chr12 | 102813468 | - | 7571 | 696 | 574 | 2 | 191 |
| DeepORF prediction of the coding potential based on the fusion transcript sequence of in-frame fusion genes. DeepORF is a coding potential classifier based on convolutional neural network by comparing the real Ribo-seq data. If the no-coding score < 0.5 and coding score > 0.5, then the in-frame fusion transcript is predicted as being likely translated. |
| Henst | Tenst | Hgene | Hchr | Hbp | Hstrand | Tgene | Tchr | Tbp | Tstrand | No-coding score | Coding score |
| ENST00000377673 | ENST00000456098 | FAM216A | chr12 | 110910923 | + | IGF1 | chr12 | 102813468 | - | 0.07180057 | 0.9281994 |
| ENST00000377673 | ENST00000337514 | FAM216A | chr12 | 110910923 | + | IGF1 | chr12 | 102813468 | - | 0.048502255 | 0.9514978 |
Top |
Fusion Amino Acid Sequences |
| For individual full-length fusion transcript sequence from FusionPDB, we ran ORFfinder and chose the longest ORF among the all predicted ones. |
| >FusionGDB ID_FusionGDB isoform ID_FGname_Hgene_Hchr_Hbp_Henst_Tgene_Tchr_Tbp_Tenst_length(fusion AA) seq_BP >28924_28924_1_FAM216A-IGF1_FAM216A_chr12_110910923_ENST00000377673_IGF1_chr12_102813468_ENST00000337514_length(amino acids)=191AA_BP= MAGHLRGAETASRVREQLSQHPSPDSTRASGCWYSGEAARMLASRPSEAVRTLPEQLRESGAGRSATPELRWGRGRSAAVAERLHVCTSL WKQCVTGGKYTCSPKQEVPSTSVFQILSTFANREGHHTGQTSARKPRTEARGARMRSFICCPLLLRYPSLDSIPTADFHQLLLRTRKSSP -------------------------------------------------------------- >28924_28924_2_FAM216A-IGF1_FAM216A_chr12_110910923_ENST00000377673_IGF1_chr12_102813468_ENST00000456098_length(amino acids)=186AA_BP=156 MRIWNTEVEGTSCFGEHVYFPPVTHCFHREVQTCKRSATAALLPLPHRNSGVADLPAPLSRSCSGSVRTASEGREASIRAASPEYQQPDA RVLSGEGCWDSCSRTRLAVSAPRRCPARVRGPTGRSVALLQSRPLWPGPRVAAADQLDTLVTRIPKVLTSPQGMAPAVGGRLRQASWMSA -------------------------------------------------------------- |
Top |
Fusion Protein Functional Features |
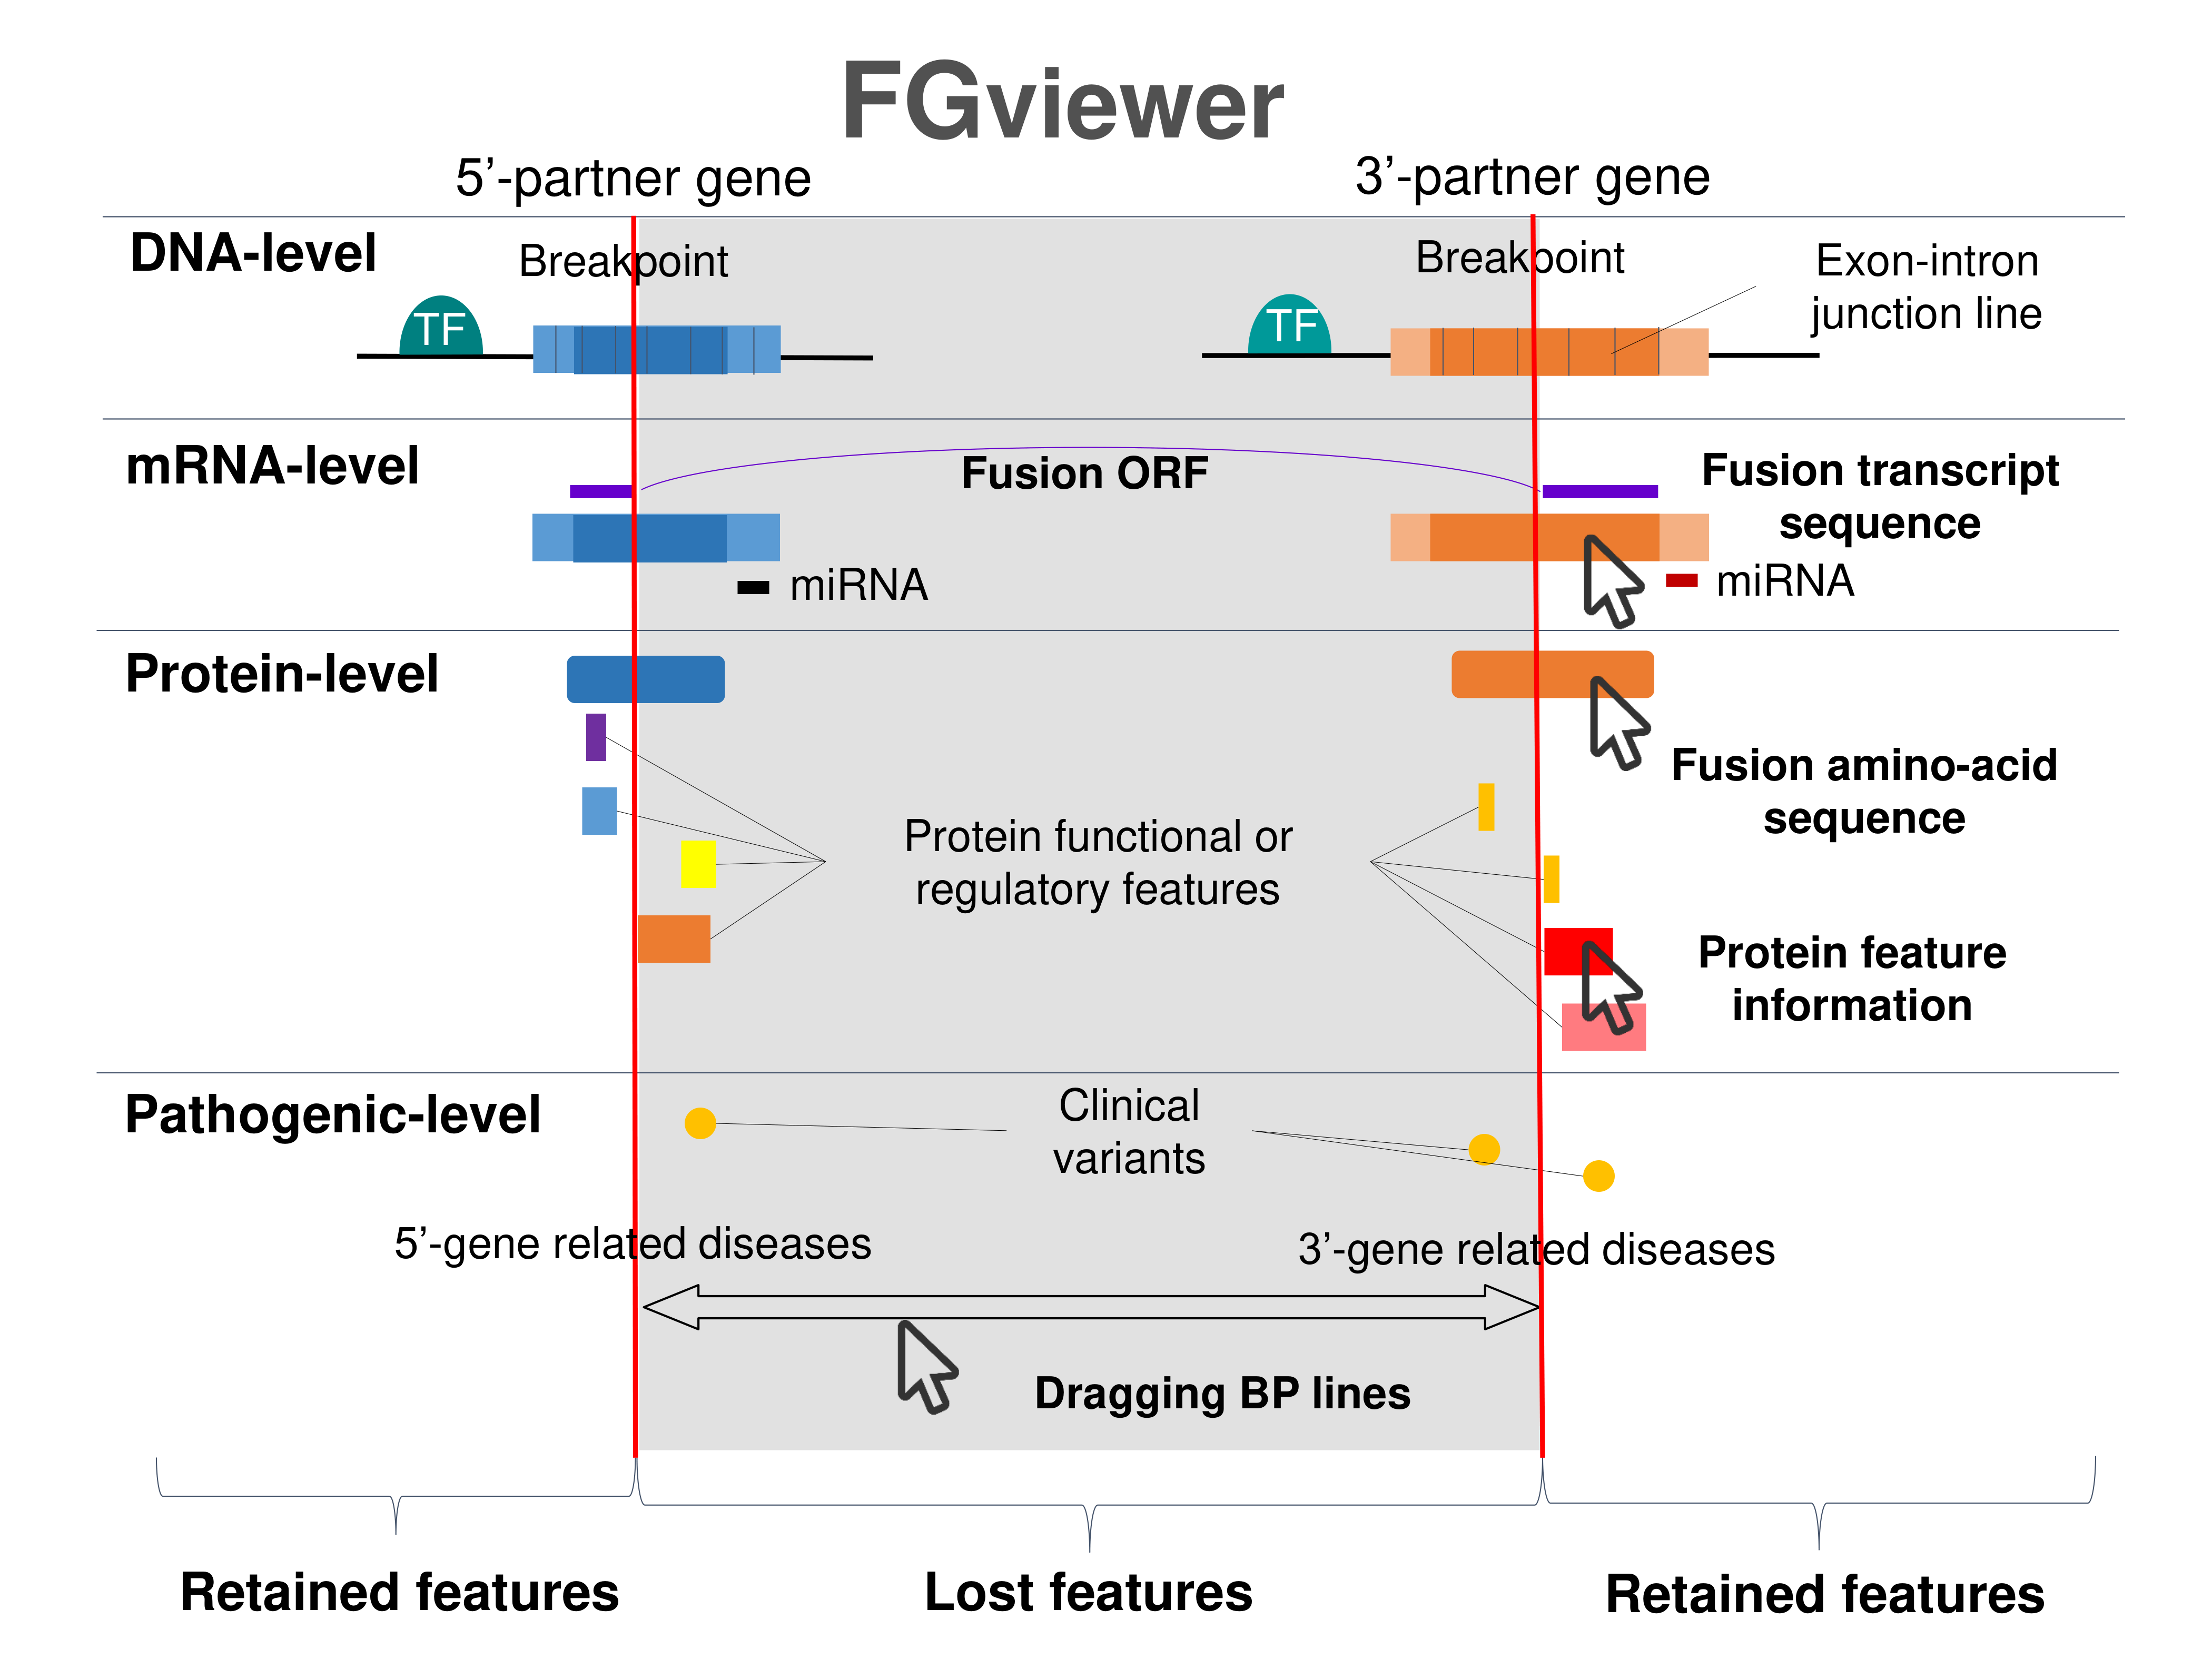
| Four levels of functional features of fusion genes Go to FGviewer search page for the most frequent breakpoint (https://ccsmweb.uth.edu/FGviewer/chr12:110910923/chr12:102813468) - FGviewer provides the online visualization of the retention search of the protein functional features across DNA, RNA, protein, and pathological levels. - How to search 1. Put your fusion gene symbol. 2. Press the tab key until there will be shown the breakpoint information filled. 4. Go down and press 'Search' tab twice. 4. Go down to have the hyperlink of the search result. 5. Click the hyperlink. 6. See the FGviewer result for your fusion gene. |
 |
| Main function of each fusion partner protein. (from UniProt) |
| Hgene | Tgene |
| FAM216A | IGF1 |
| FUNCTION: Receptor tyrosine kinase which mediates actions of insulin-like growth factor 1 (IGF1). Binds IGF1 with high affinity and IGF2 and insulin (INS) with a lower affinity. The activated IGF1R is involved in cell growth and survival control. IGF1R is crucial for tumor transformation and survival of malignant cell. Ligand binding activates the receptor kinase, leading to receptor autophosphorylation, and tyrosines phosphorylation of multiple substrates, that function as signaling adapter proteins including, the insulin-receptor substrates (IRS1/2), Shc and 14-3-3 proteins. Phosphorylation of IRSs proteins lead to the activation of two main signaling pathways: the PI3K-AKT/PKB pathway and the Ras-MAPK pathway. The result of activating the MAPK pathway is increased cellular proliferation, whereas activating the PI3K pathway inhibits apoptosis and stimulates protein synthesis. Phosphorylated IRS1 can activate the 85 kDa regulatory subunit of PI3K (PIK3R1), leading to activation of several downstream substrates, including protein AKT/PKB. AKT phosphorylation, in turn, enhances protein synthesis through mTOR activation and triggers the antiapoptotic effects of IGFIR through phosphorylation and inactivation of BAD. In parallel to PI3K-driven signaling, recruitment of Grb2/SOS by phosphorylated IRS1 or Shc leads to recruitment of Ras and activation of the ras-MAPK pathway. In addition to these two main signaling pathways IGF1R signals also through the Janus kinase/signal transducer and activator of transcription pathway (JAK/STAT). Phosphorylation of JAK proteins can lead to phosphorylation/activation of signal transducers and activators of transcription (STAT) proteins. In particular activation of STAT3, may be essential for the transforming activity of IGF1R. The JAK/STAT pathway activates gene transcription and may be responsible for the transforming activity. JNK kinases can also be activated by the IGF1R. IGF1 exerts inhibiting activities on JNK activation via phosphorylation and inhibition of MAP3K5/ASK1, which is able to directly associate with the IGF1R.; FUNCTION: When present in a hybrid receptor with INSR, binds IGF1. PubMed:12138094 shows that hybrid receptors composed of IGF1R and INSR isoform Long are activated with a high affinity by IGF1, with low affinity by IGF2 and not significantly activated by insulin, and that hybrid receptors composed of IGF1R and INSR isoform Short are activated by IGF1, IGF2 and insulin. In contrast, PubMed:16831875 shows that hybrid receptors composed of IGF1R and INSR isoform Long and hybrid receptors composed of IGF1R and INSR isoform Short have similar binding characteristics, both bind IGF1 and have a low affinity for insulin. |
| Retention analysis result of each fusion partner protein across 39 protein features of UniProt such as six molecule processing features, 13 region features, four site features, six amino acid modification features, two natural variation features, five experimental info features, and 3 secondary structure features. Here, because of limited space for viewing, we only show the protein feature retention information belong to the 13 regional features. All retention annotation result can be downloaded at * Minus value of BPloci means that the break pointn is located before the CDS. |
| - Retained protein feature among the 13 regional features. |
| Partner | Gene | Hbp | Tbp | ENST | Strand | BPexon | TotalExon | Protein feature loci | *BPloci | TotalLen | Protein feature | Protein feature note |
| Tgene | IGF1 | chr12:110910923 | chr12:102813468 | ENST00000307046 | 1 | 4 | 111_118 | 73.33333333333333 | 196.0 | Region | Note=D | |
| Tgene | IGF1 | chr12:110910923 | chr12:102813468 | ENST00000307046 | 1 | 4 | 78_89 | 73.33333333333333 | 196.0 | Region | Note=C | |
| Tgene | IGF1 | chr12:110910923 | chr12:102813468 | ENST00000307046 | 1 | 4 | 90_110 | 73.33333333333333 | 196.0 | Region | Note=A | |
| Tgene | IGF1 | chr12:110910923 | chr12:102813468 | ENST00000337514 | 1 | 4 | 111_118 | 73.33333333333333 | 154.0 | Region | Note=D | |
| Tgene | IGF1 | chr12:110910923 | chr12:102813468 | ENST00000337514 | 1 | 4 | 78_89 | 73.33333333333333 | 154.0 | Region | Note=C | |
| Tgene | IGF1 | chr12:110910923 | chr12:102813468 | ENST00000337514 | 1 | 4 | 90_110 | 73.33333333333333 | 154.0 | Region | Note=A | |
| Tgene | IGF1 | chr12:110910923 | chr12:102813468 | ENST00000392904 | 2 | 6 | 111_118 | 73.33333333333333 | 159.0 | Region | Note=D | |
| Tgene | IGF1 | chr12:110910923 | chr12:102813468 | ENST00000392904 | 2 | 6 | 78_89 | 73.33333333333333 | 159.0 | Region | Note=C | |
| Tgene | IGF1 | chr12:110910923 | chr12:102813468 | ENST00000392904 | 2 | 6 | 90_110 | 73.33333333333333 | 159.0 | Region | Note=A | |
| Tgene | IGF1 | chr12:110910923 | chr12:102813468 | ENST00000424202 | 1 | 4 | 111_118 | 57.333333333333336 | 138.0 | Region | Note=D | |
| Tgene | IGF1 | chr12:110910923 | chr12:102813468 | ENST00000424202 | 1 | 4 | 78_89 | 57.333333333333336 | 138.0 | Region | Note=C | |
| Tgene | IGF1 | chr12:110910923 | chr12:102813468 | ENST00000424202 | 1 | 4 | 90_110 | 57.333333333333336 | 138.0 | Region | Note=A | |
| Tgene | IGF1 | chr12:110910923 | chr12:102813468 | ENST00000456098 | 1 | 5 | 111_118 | 73.33333333333333 | 159.0 | Region | Note=D | |
| Tgene | IGF1 | chr12:110910923 | chr12:102813468 | ENST00000456098 | 1 | 5 | 78_89 | 73.33333333333333 | 159.0 | Region | Note=C | |
| Tgene | IGF1 | chr12:110910923 | chr12:102813468 | ENST00000456098 | 1 | 5 | 90_110 | 73.33333333333333 | 159.0 | Region | Note=A |
| - Not-retained protein feature among the 13 regional features. |
| Partner | Gene | Hbp | Tbp | ENST | Strand | BPexon | TotalExon | Protein feature loci | *BPloci | TotalLen | Protein feature | Protein feature note |
| Tgene | IGF1 | chr12:110910923 | chr12:102813468 | ENST00000307046 | 1 | 4 | 49_77 | 73.33333333333333 | 196.0 | Region | Note=B | |
| Tgene | IGF1 | chr12:110910923 | chr12:102813468 | ENST00000337514 | 1 | 4 | 49_77 | 73.33333333333333 | 154.0 | Region | Note=B | |
| Tgene | IGF1 | chr12:110910923 | chr12:102813468 | ENST00000392904 | 2 | 6 | 49_77 | 73.33333333333333 | 159.0 | Region | Note=B | |
| Tgene | IGF1 | chr12:110910923 | chr12:102813468 | ENST00000424202 | 1 | 4 | 49_77 | 57.333333333333336 | 138.0 | Region | Note=B | |
| Tgene | IGF1 | chr12:110910923 | chr12:102813468 | ENST00000456098 | 1 | 5 | 49_77 | 73.33333333333333 | 159.0 | Region | Note=B |
Top |
Fusion Protein Structures |
| PDB and CIF files of the predicted fusion proteins * Here we show the 3D structure of the fusion proteins using Mol*. AlphaFold produces a per-residue confidence score (pLDDT) between 0 and 100. Model confidence is shown from the pLDDT values per residue. pLDDT corresponds to the model’s prediction of its score on the local Distance Difference Test. It is a measure of local accuracy (from AlphfaFold website). To color code individual residues, we transformed individual PDB files into CIF format. |
| Fusion protein PDB link (fusion AA seq ID in FusionPDB) | Hgene | Hchr | Hbp | Hstrand | Tgene | Tchr | Tbp | Tstrand | AA seq | Len(AA seq) |
| PDB file >>>234_FAM216A_110910923_IGF1_102813468_ranked_0.pdb | FAM216A | 110910923 | 110910923 | ENST00000337514 | IGF1 | chr12 | 102813468 | - | MAGHLRGAETASRVREQLSQHPSPDSTRASGCWYSGEAARMLASRPSEAVRTLPEQLRESGAGRSATPELRWGRGRSAAVAERLHVCTSL WKQCVTGGKYTCSPKQEVPSTSVFQILSTFANREGHHTGQTSARKPRTEARGARMRSFICCPLLLRYPSLDSIPTADFHQLLLRTRKSSP | 191 |
Top |
pLDDT score distribution |
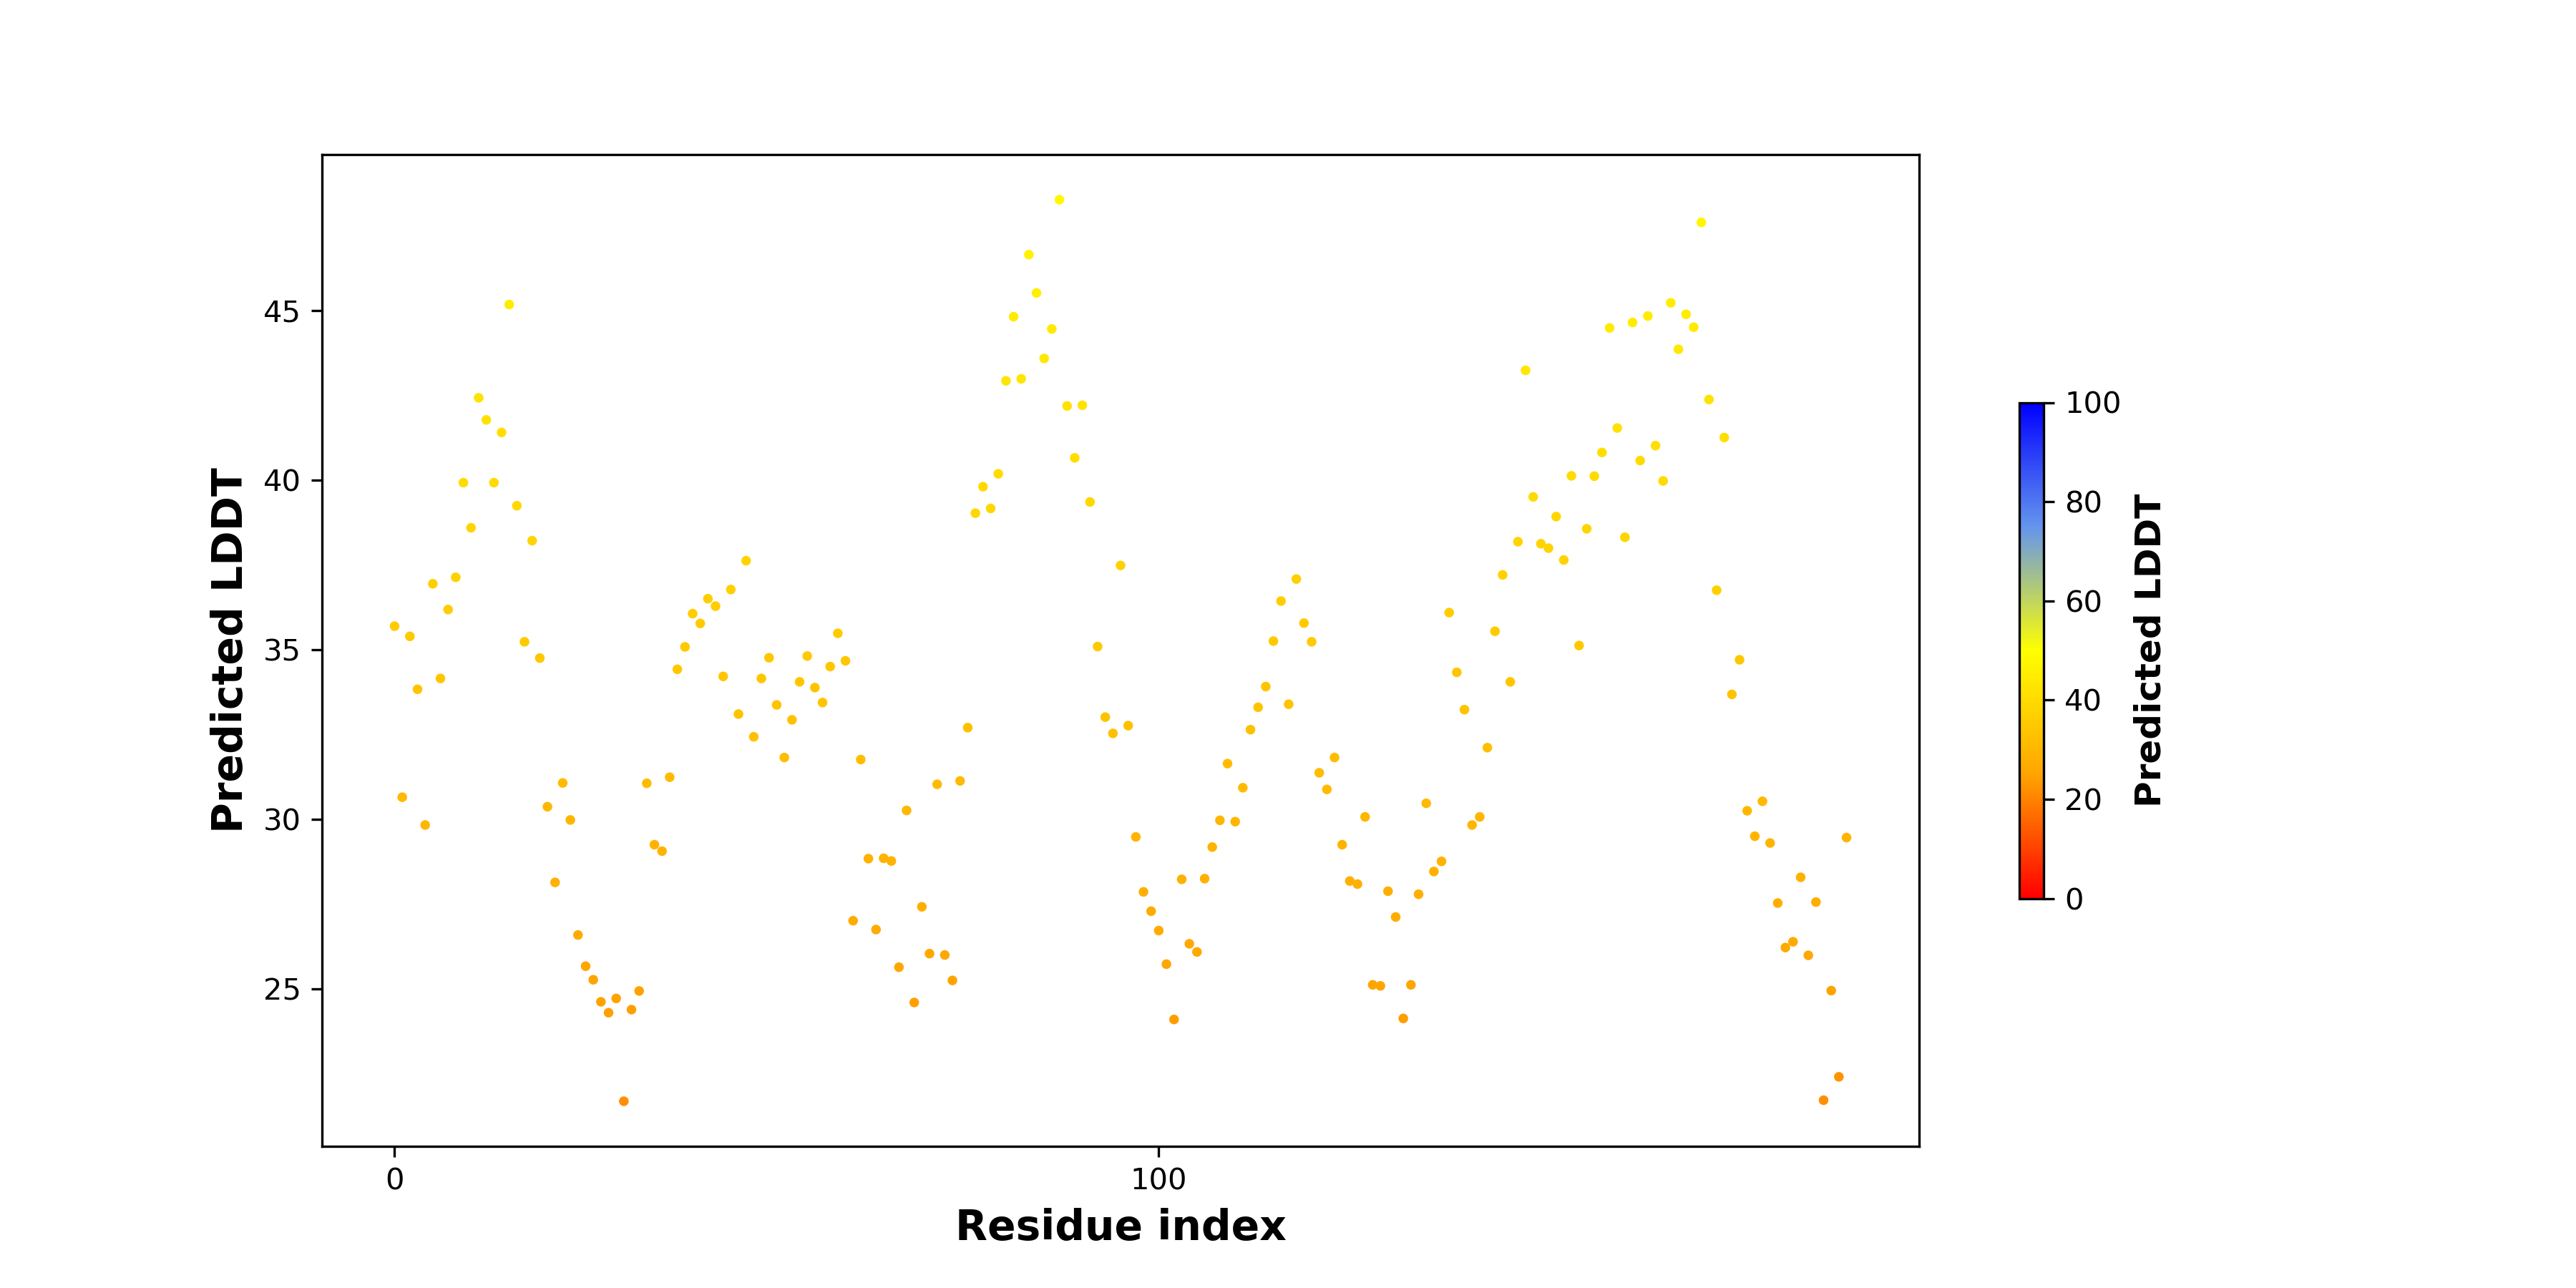
| pLDDT score distribution of the predicted wild-type structures of two partner proteins from AlphaFold2 * AlphaFold produces a per-residue confidence score (pLDDT) between 0 and 100. |
FAM216A_pLDDT.png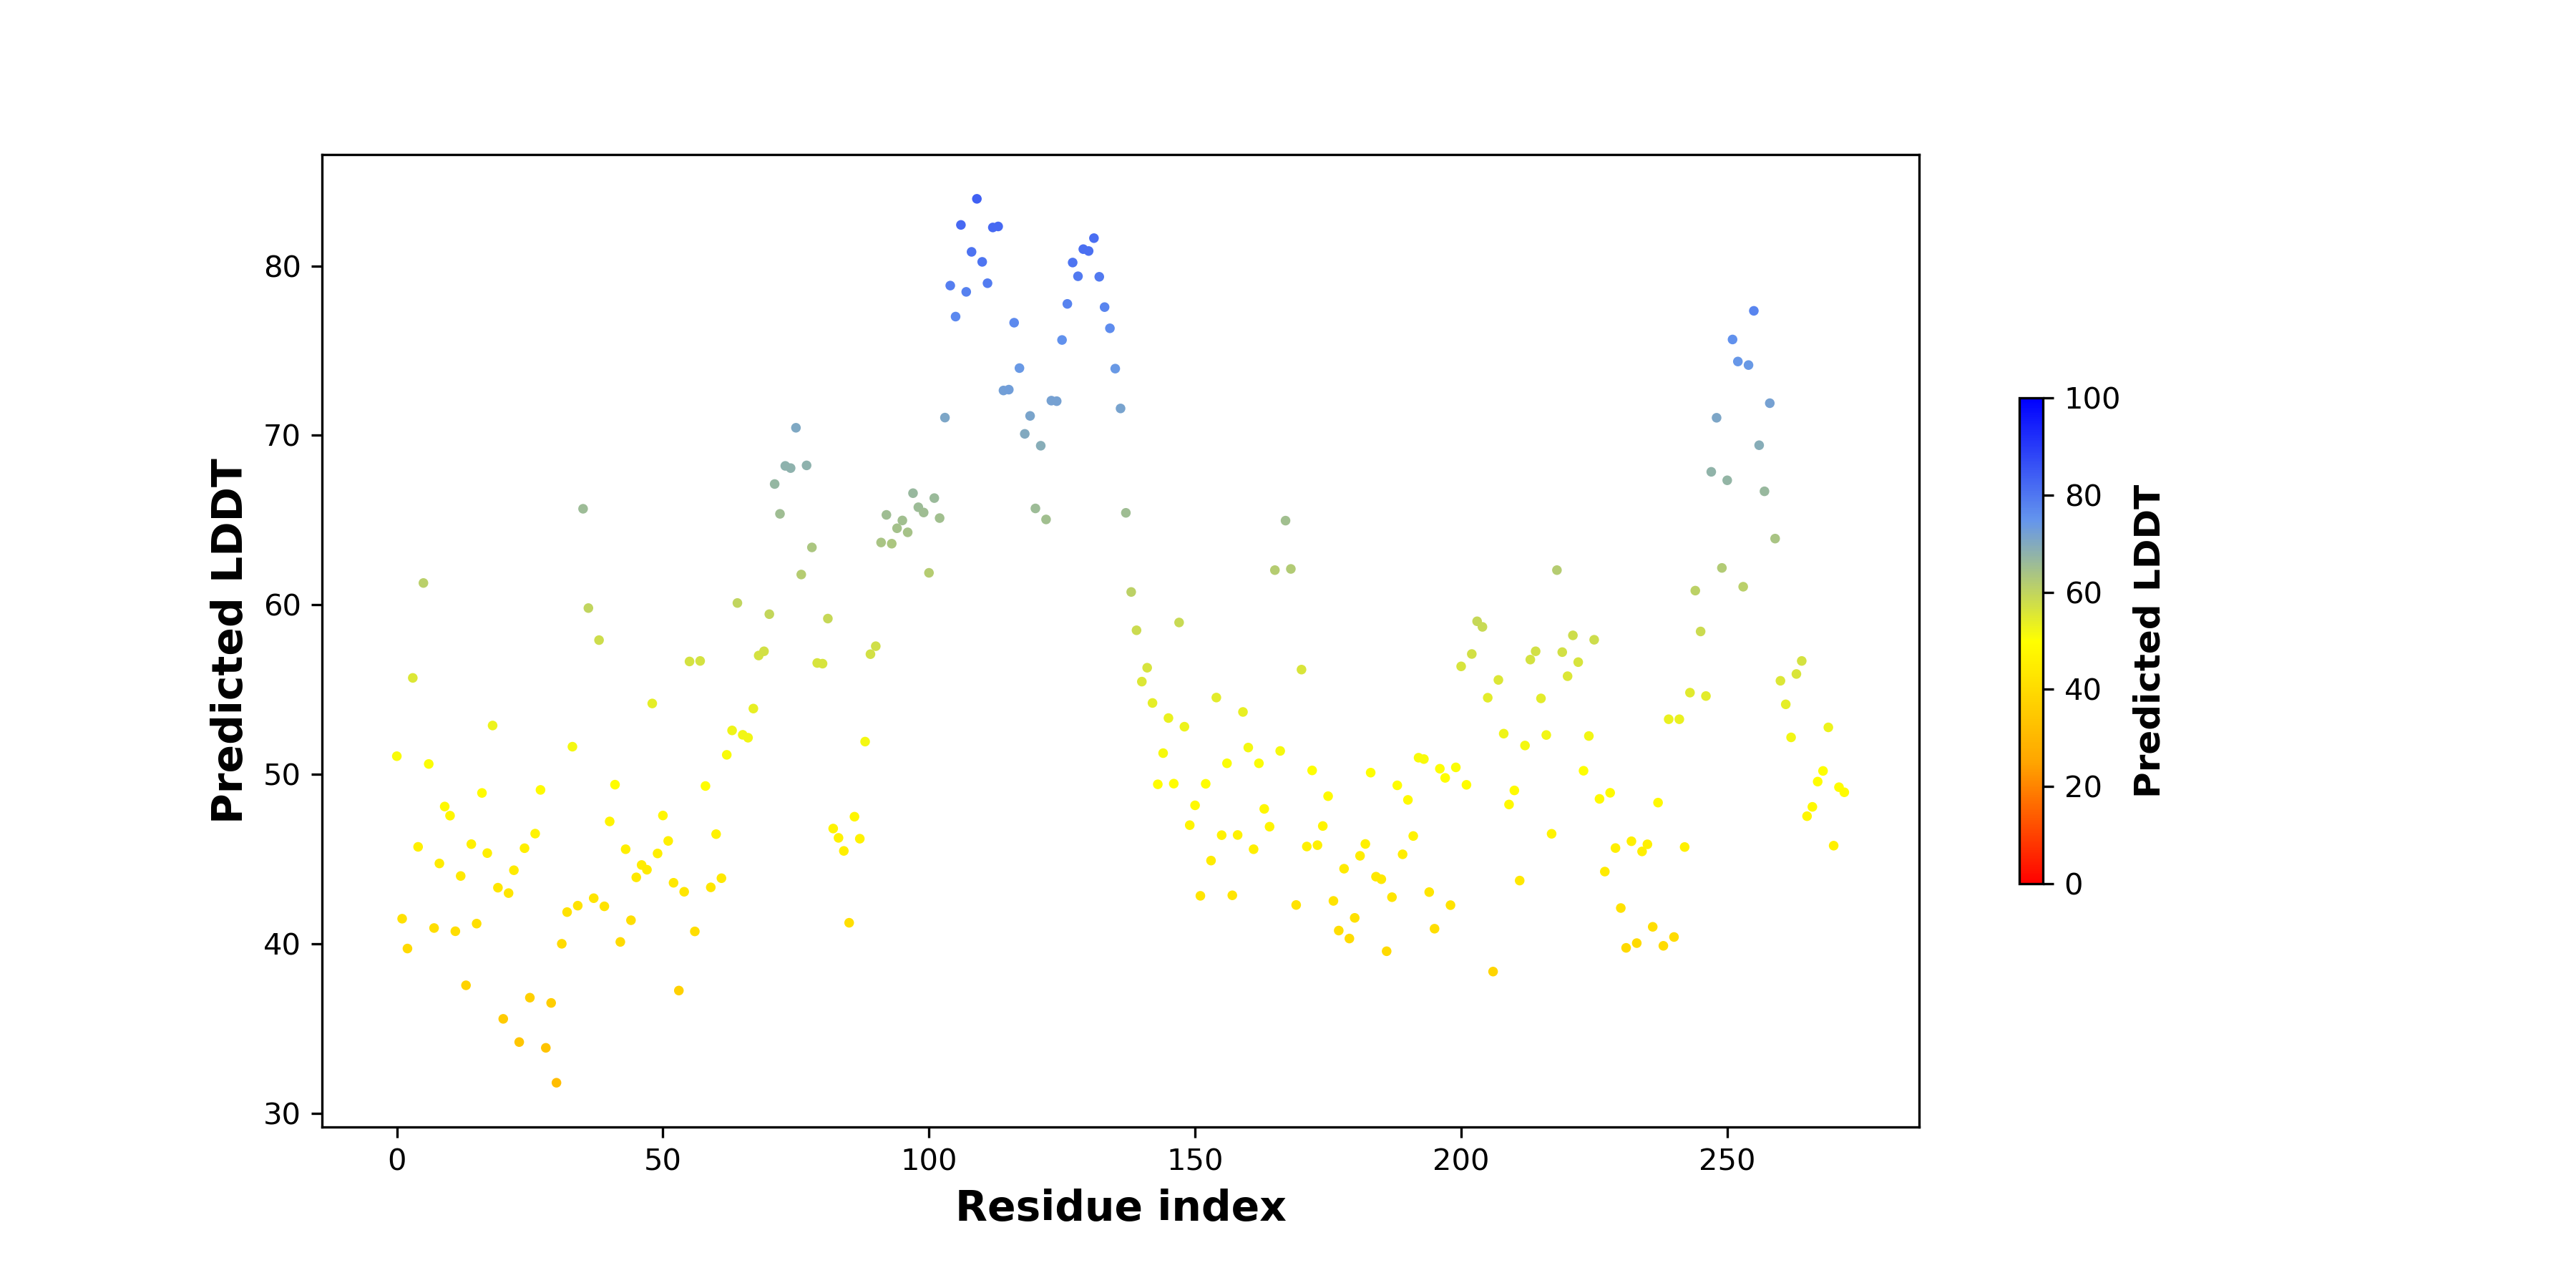  |
IGF1_pLDDT.png  |
| pLDDT score distribution of the predicted fusion protein structures from AlphaFold2 * AlphaFold produces a per-residue confidence score (pLDDT) between 0 and 100. |
 |
Top |
Ramachandran Plot of Fusion Protein Structure |
| Ramachandran plot of the torsional angles - phi (φ)and psi (ψ) - of the residues (amino acids) contained in this fusion protein peptide. |
| Fusion AA seq ID in FusionPDB and their Ramachandran plots |
Top |
Fusion Protein-Protein Interaction |
| Go to ChiPPI (Chimeric Protein-Protein interactions) to see the chimeric PPI interaction in |
| Protein-protein interactors with each fusion partner protein in wild-type from validated records (BIOGRID-3.4.160) |
| Gene | PPI interactors |
| Protein-protein interactors based on sequence similarity (STRING) |
| Gene | STRING network |
| FAM216A | |
| IGF1 |
| - Retained interactions in fusion protein (protein functional feature from UniProt). |
| Partner | Gene | Hbp | Tbp | ENST | Strand | BPexon | TotalExon | Protein feature loci | *BPloci | TotalLen | Still interaction with |
| - Lost interactions due to fusion (protein functional feature from UniProt). |
| Partner | Gene | Hbp | Tbp | ENST | Strand | BPexon | TotalExon | Protein feature loci | *BPloci | TotalLen | Interaction lost with |
Top |
Related Drugs to FAM216A-IGF1 |
| Drugs used for this fusion-positive patient. (Manual curation of PubMed, 04-30-2022 + MyCancerGenome) |
| Hgene | Tgene | Drug | Source | PMID |
Top |
Related Diseases to FAM216A-IGF1 |
| Diseases that have this fusion gene. (Manual curation of PubMed, 04-30-2022 + MyCancerGenome) |
| Hgene | Tgene | Disease | Source | PMID |
| Diseases associated with fusion partners. (DisGeNet 4.0) |
| Partner | Gene | Disease ID | Disease name | # pubmeds | Source |
(UTHealth)
Web File Viewing | Emergency Information |Campus Carry|Site Policies