|
Home |
Download |
Statistics |
Examples |
About |
Contact |
Terms of Use |
Navigation
1. Fusion Protein Peptide Sequences.2. Three Fusion Protein Types.
3. Prediction of 3D Structure of Fusion Proteins..
4. pLDDT Score Calculation and Visualization
5. Predicted Aligned Error (PAE) Plot
6. Ramachandran Plot Analysis
7. Structural Superimposition and RMSD Analysis
8. Functional Features with the InterPro Protein Domain Mapping
1. Fusion Protein Peptide Sequences.
We obtained the fusion protein sequences from FusionGDB3. FusionGDB3 obtained RNA-seq based fusion gene breakpoint information from TCGA, CCLE, cBioPortal, ChimerDB4, ChimerKB4, ChildHoodFusions, GTEx, and GenBank. After analyzing the open reading frames, we raun the ORFfinder and chose the logest ORF for the in-frame, 5UTR-3CDS, and 5CSD-3UTR ORF types. For more details, please visit the website of FusionGDB3.2. Three Types of Fusion Proteins.
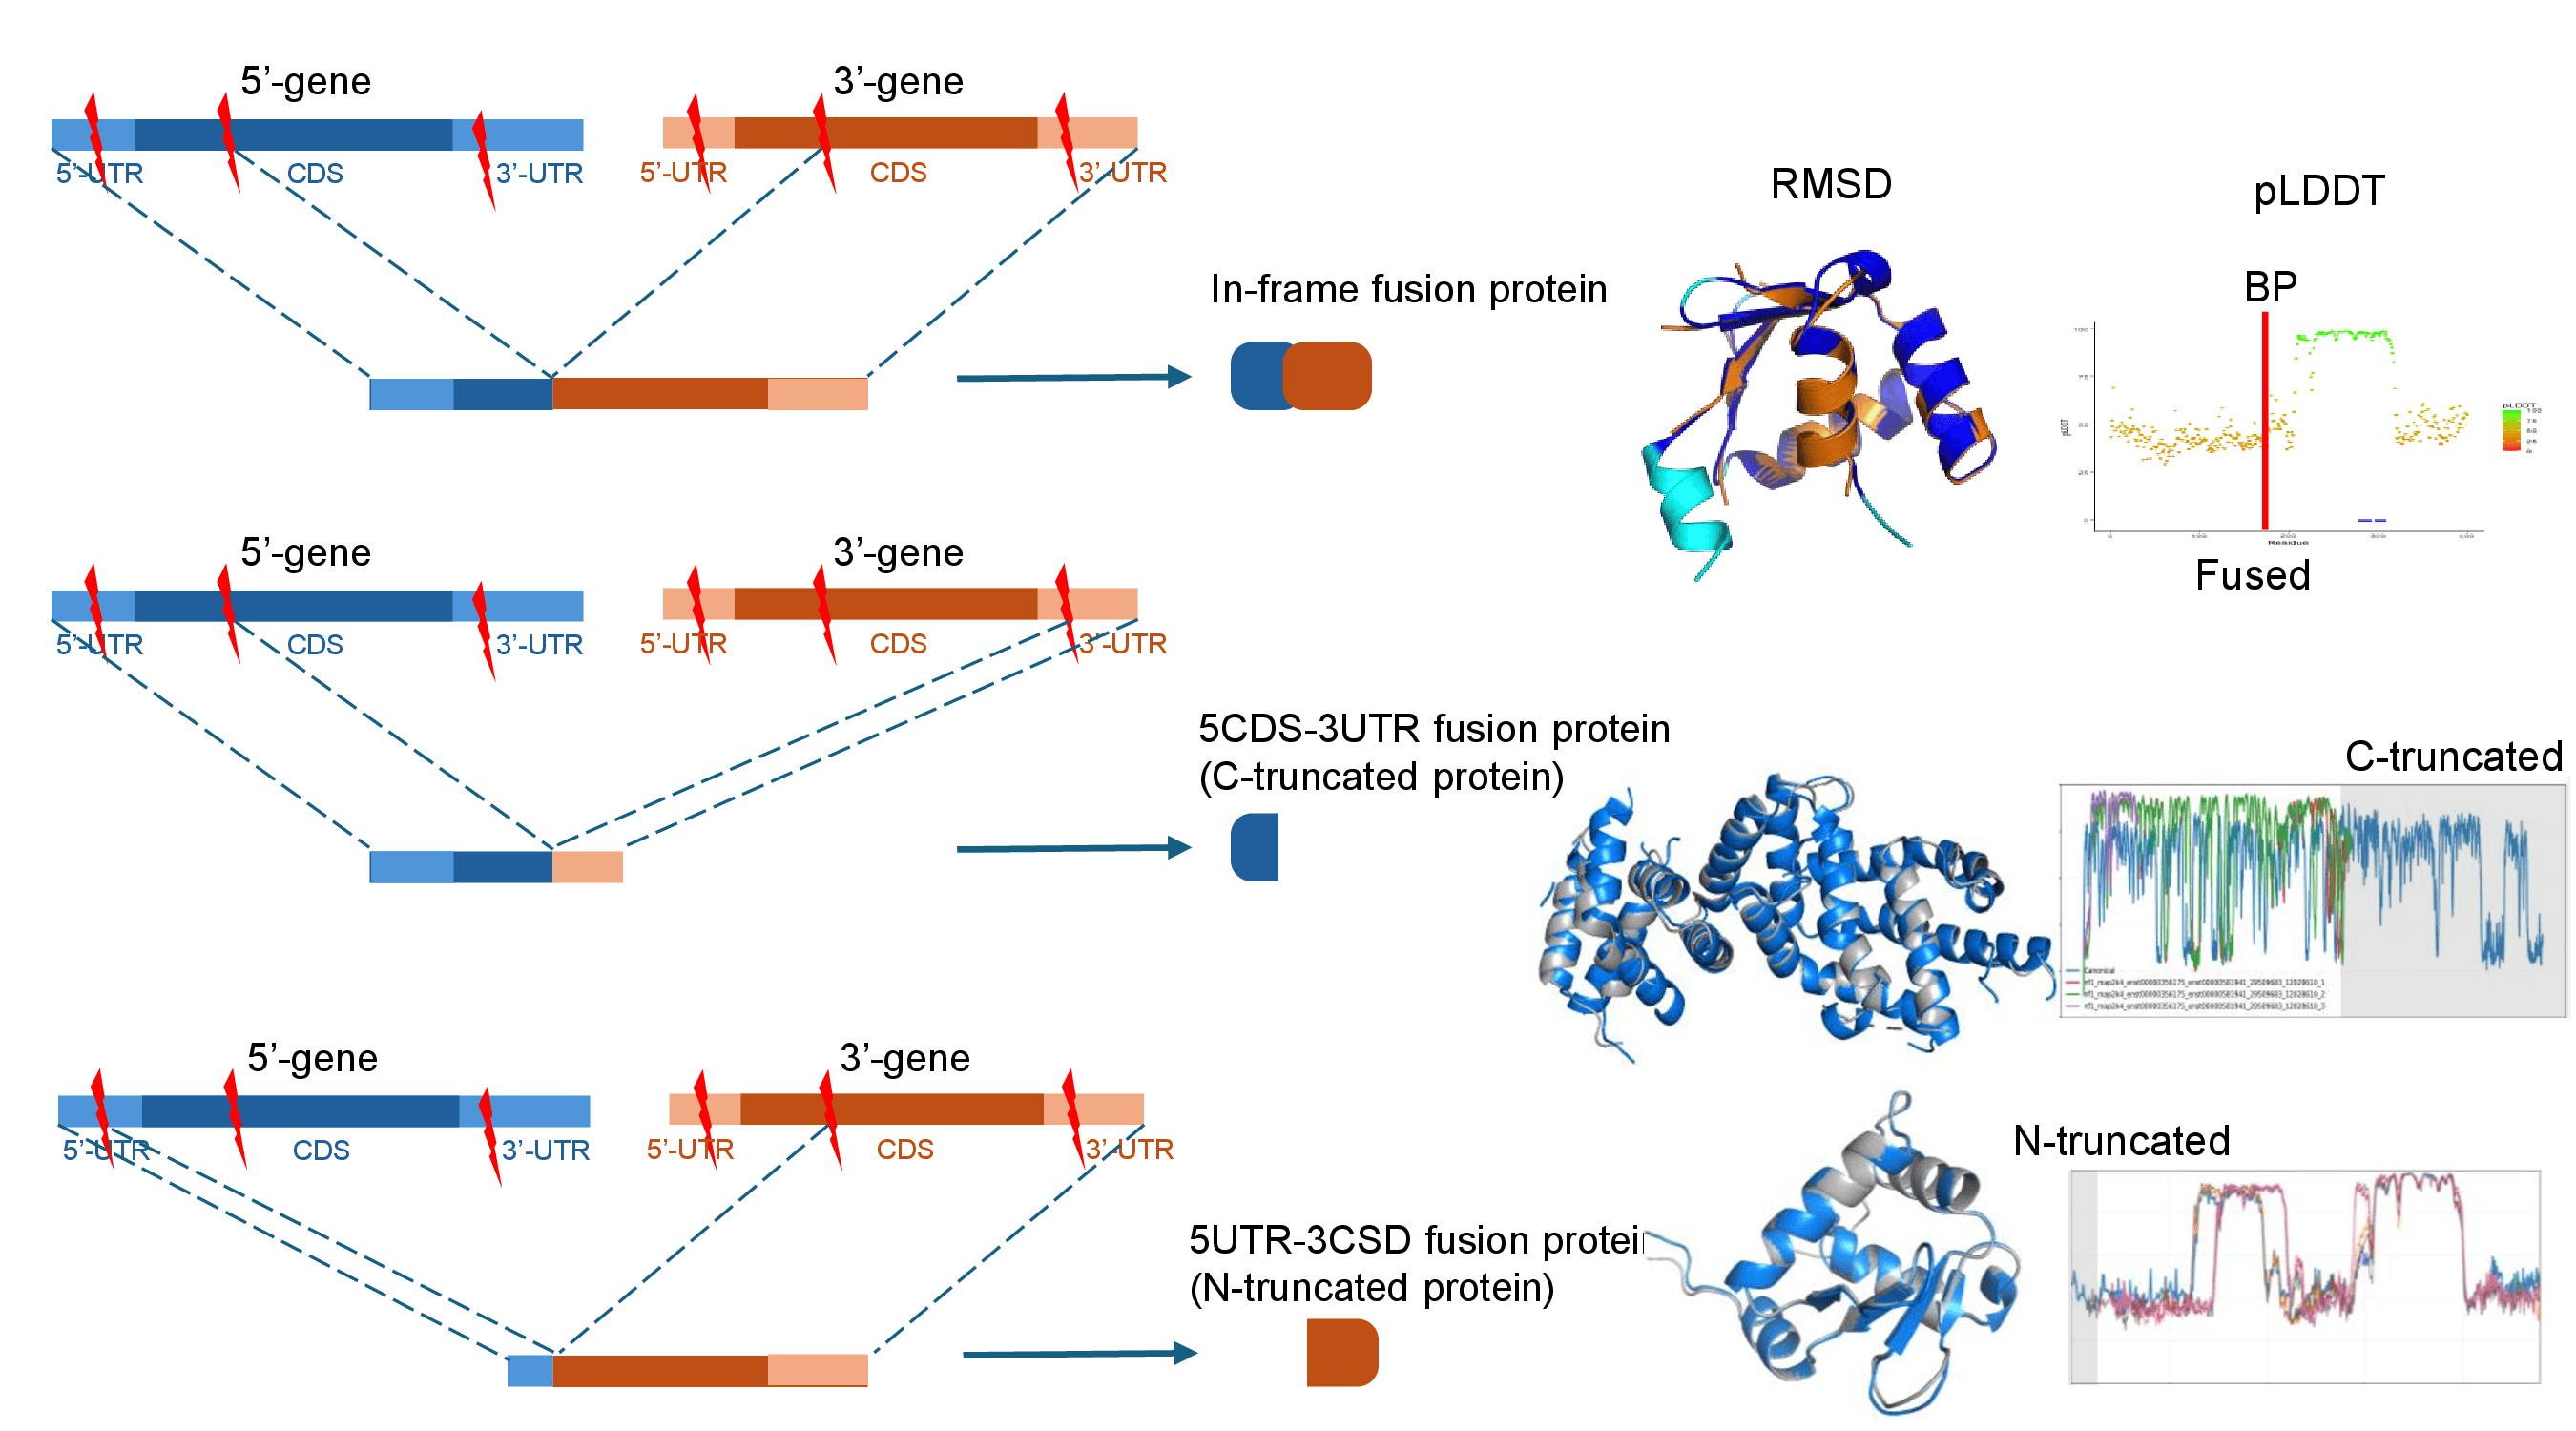
FusionPDB2 provides the 3D structures of three types of fusion proteins as below.1. In-frame fusion proteins are produced when the coding sequences of the 5′ and 3′ partner genes are joined without disrupting the open reading frame. These proteins often preserve coding regions from both genes and may generate fusion proteins containing functional domains from both partners.
2. 5UTR-3CDS fusion genes are the resource of the N-truncated proteins. the 5′ untranslated region of one gene is fused to the coding sequence of another gene. These events can generate N-terminally truncated proteins because the original 5′ coding region may be lost. N-truncated proteins can be biologically important because loss of the N-terminal region may remove regulatory motifs, localization signals, inhibitory domains, or degradation signals. In some cases, the remaining C-terminal region may retain an active kinase domain, DNA-binding domain, or other functional module.
3. 5CDS-3UTR fusion genes are the resource of the C-truncated proteins. These fusions retain the 5′ gene's coding sequence but terminate before incorporating the full coding region from the 3′ partner. These events can generate C-terminal truncation of proteins. C-truncated proteins are important because the removal of the C-terminal region can affect protein stability, degradation, protein interactions, or cellular localization. Some truncated proteins may become constitutively active or lose normal regulatory control.
: Truncated proteins are generated by diverse genomic and transcriptomic alterations, including frameshift mutations, alternative splicing, and gene fusions. Among these events, truncated proteins derived from gene fusions have been identified in several human diseases, particularly cancer. These proteins have been associated with altered functions that may contribute to disease development. Understanding the biological effects of truncated proteins is essential to uncovering disease mechanisms and identifying potential therapeutic targets. A fundamental characteristic of truncated proteins is the location of the truncation. Studies have shown that protein termini often contain structural domains and regulatory elements that determine protein localization, stability, and function. As a result, truncation of either the N- or C-terminus may lead to distinct biological consequences, depending on the regions retained or lost.
3. Prediction of 3D Structure of Fusion Proteins.
FusionPDB 2.0 provides predicted 3D structures of fusion proteins generated using ColabFold, an efficient implementation of AlphaFold-based protein structure prediction. For each fusion protein sequence, ColabFold predicts a three-dimensional protein model based on sequence-derived evolutionary and structural information. The predicted structures allow users to visualize the possible spatial organization of fusion proteins, including preserved domains, newly joined regions, and truncation effects. The purpose of structure prediction in FusionPDB 2.0 is to help users understand whether a fusion protein may form a stable folded structure, whether known functional domains remain structurally intact, and whether the fusion junction may disrupt or preserve important structural regions. Predicted structures should be interpreted as computational models, not experimental structures. They are most reliable in regions with high confidence scores and should be further validated experimentally when used for mechanistic or therapeutic conclusions. Below is the predicted 3D structure of BCR-ABL1.4. pLDDT Score Calculation and Visualization
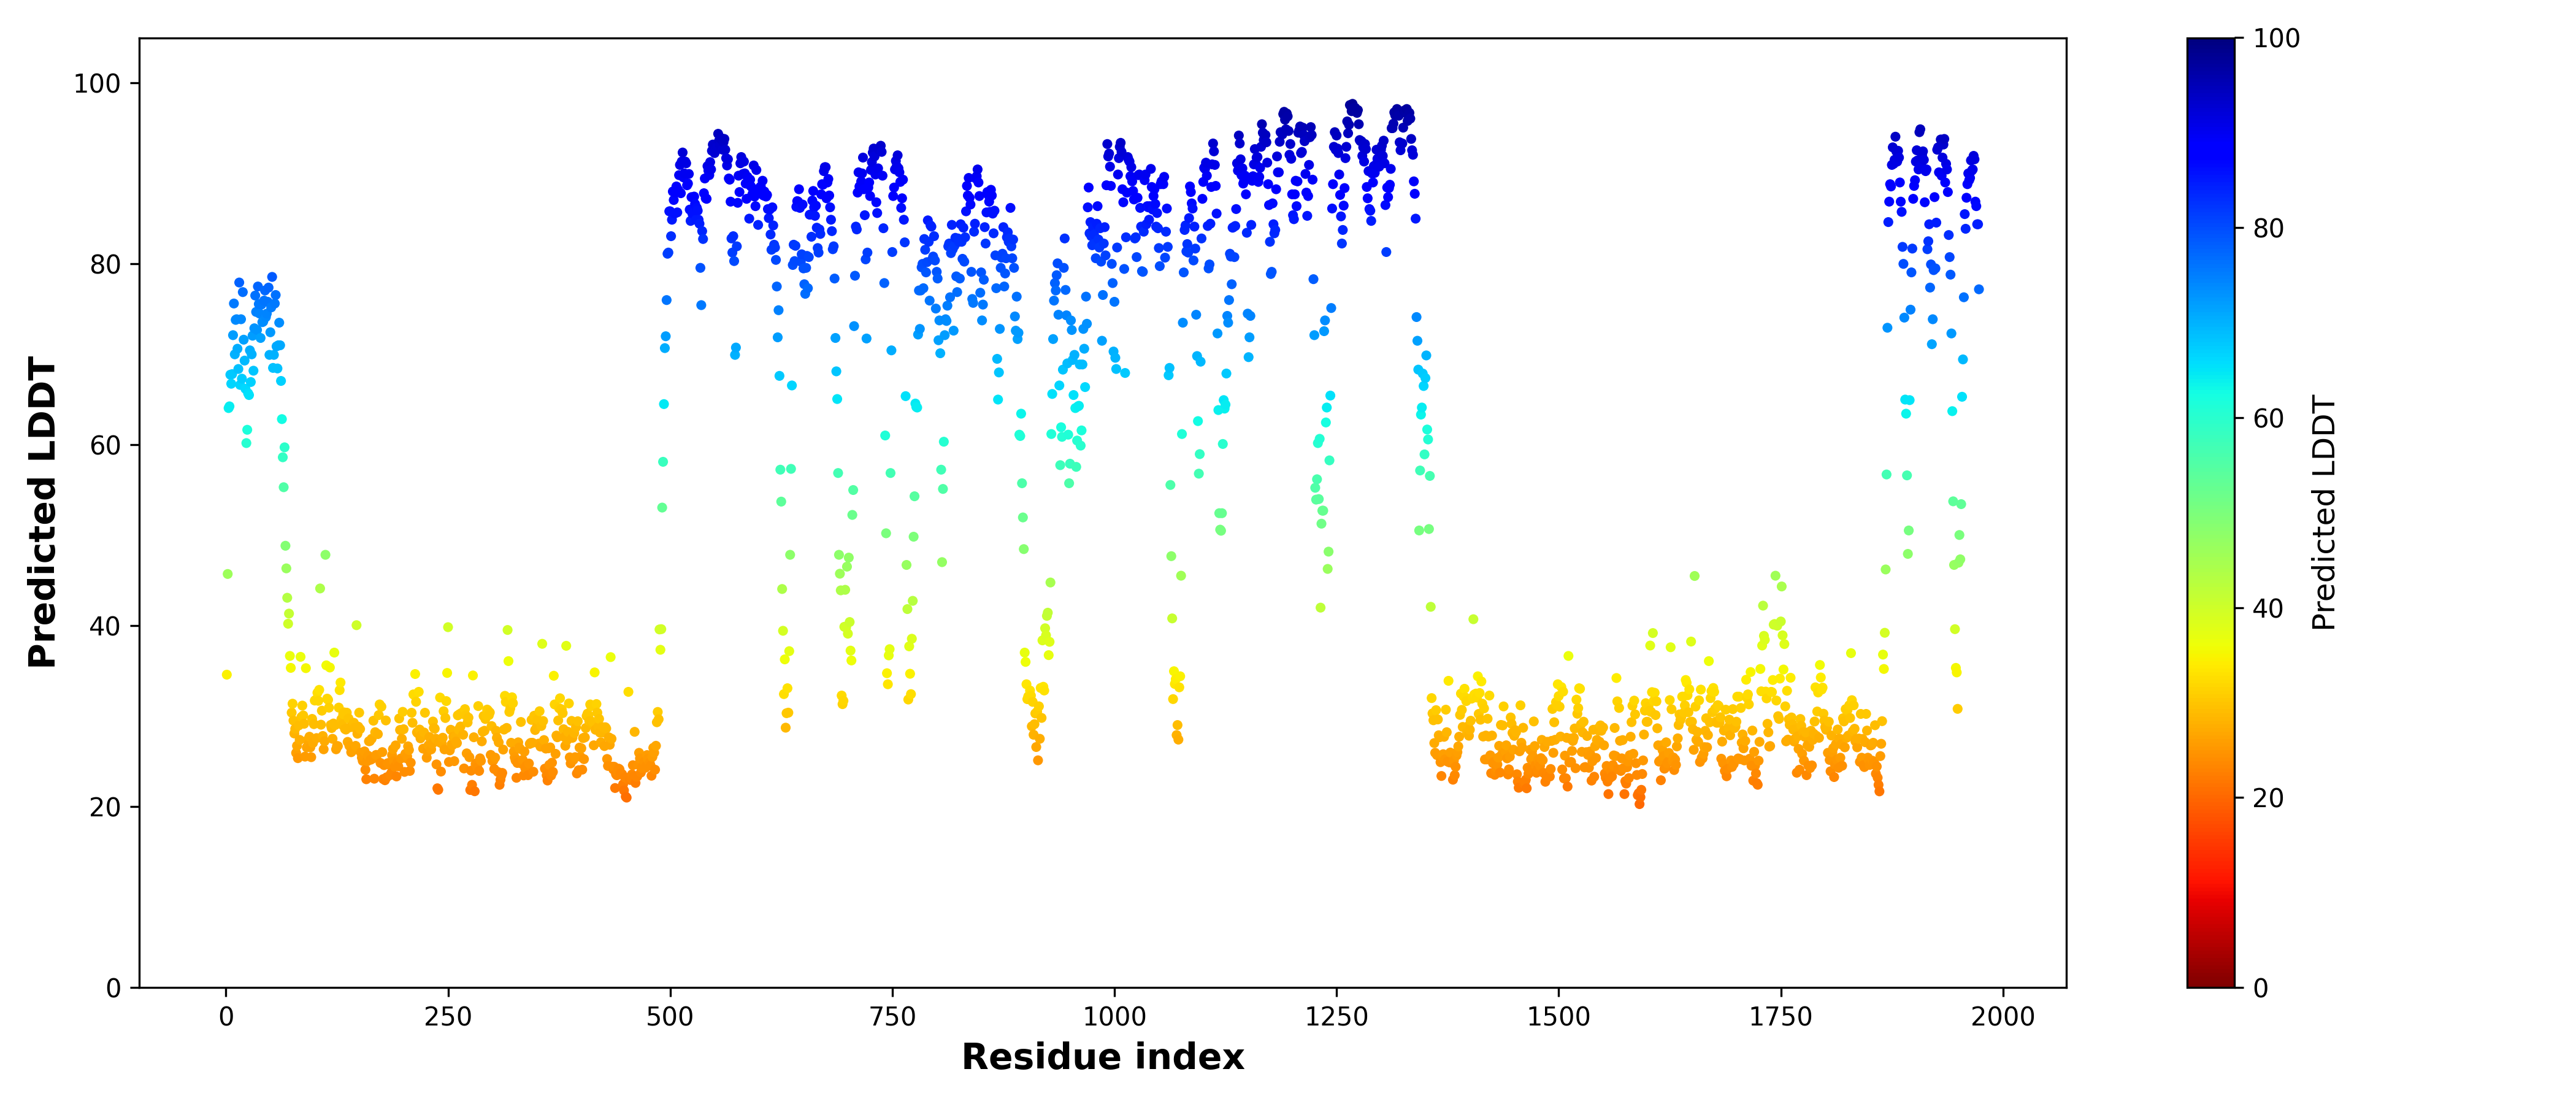
FusionPDB 2.0 provides residue-level pLDDT scores for each predicted fusion protein structure. The pLDDT score is a confidence metric generated by ColabFold that estimates how reliable each residue position is in the predicted model.The pLDDT score ranges from 0 to 100:
• pLDDT > 90: Very high confidence; the region is likely to be accurately modeled.
• pLDDT 70–90: Confident prediction; the structure is generally reliable.
• pLDDT 50–70: Low confidence; the region may be flexible or uncertain.
• pLDDT < 50: Very low confidence; the region may be disordered or unreliable.
FusionPDB 2.0 visualizes pLDDT values across the protein sequence using color-coded plots. These plots help users quickly identify well-folded domains, and disordered regions. pLDDT visualization is important because fusion proteins often contain long intrinsically disordered regions, partial domains created by gene fusion. By examining pLDDT distribution, users can determine which parts of the predicted structure are suitable for downstream analysis such as domain interpretation, active site identification, docking, structural comparison. Below is the pLDDT distribution across the length of the BCR-ABL1 fusion peptide sequence.
5. Predicted Aligned Error (PAE) Plot
FusionPDB 2.0 provides Predicted Aligned Error plots for fusion protein structures. PAE is an AlphaFold/ColabFold confidence measure that estimates the expected positional error between pairs of residues in the predicted structure. A PAE plot is shown as a two-dimensional matrix where both axes represent residue positions in the protein sequence. Each point in the matrix indicates how confidently the model predicts the relative position of one residue with respect to another. Low PAE values indicate that the relative orientation between two regions is predicted with high confidence. High PAE values indicate uncertainty in the relative placement of different regions, even if each individual region may be locally well folded. PAE plots are especially useful for fusion proteins because different domains may be connected by flexible linkers or fusion junctions. A fusion protein may contain two well-folded domains but still have uncertain orientation between those domains. Therefore, PAE helps users distinguish between local structural confidence and global domain arrangement confidence. Below is the PAE plot of the predicted 3D structure of BCR-ABL1 fusion protein.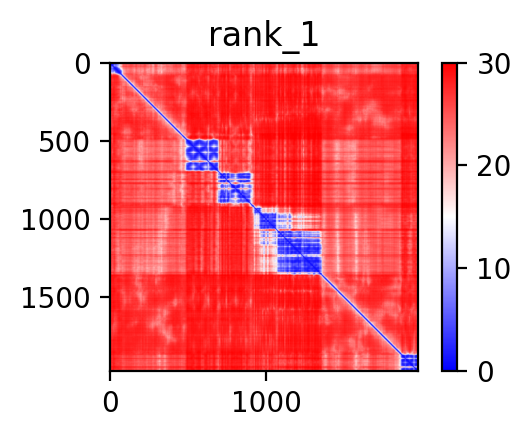
6. Ramachandran Plot Analysis
FusionPDB 2.0 provides Ramachandran plot analysis for predicted fusion protein structures. A Ramachandran plot evaluates the backbone geometry of a protein by showing the phi and psi torsion angles of amino acid residues. Most residues in a physically realistic protein structure fall within favored or allowed regions of the Ramachandran plot. Residues outside these regions may indicate unusual geometry, local strain, modeling uncertainty, or structural errors. Ramachandran plot analysis is important because pLDDT alone does not directly evaluate stereochemical quality. A predicted protein may have high confidence in some regions, but backbone geometry should still be checked to assess whether the model is structurally reasonable. In FusionPDB 2.0, Ramachandran plots provide an additional quality-control layer for predicted fusion protein structures. This helps users identify models that are suitable for further structural analysis, visualization, comparison with experimental structures, or molecular docking. Below is the Ramachandran plot of the 3D structure of BCR-ABL1 fusion protein.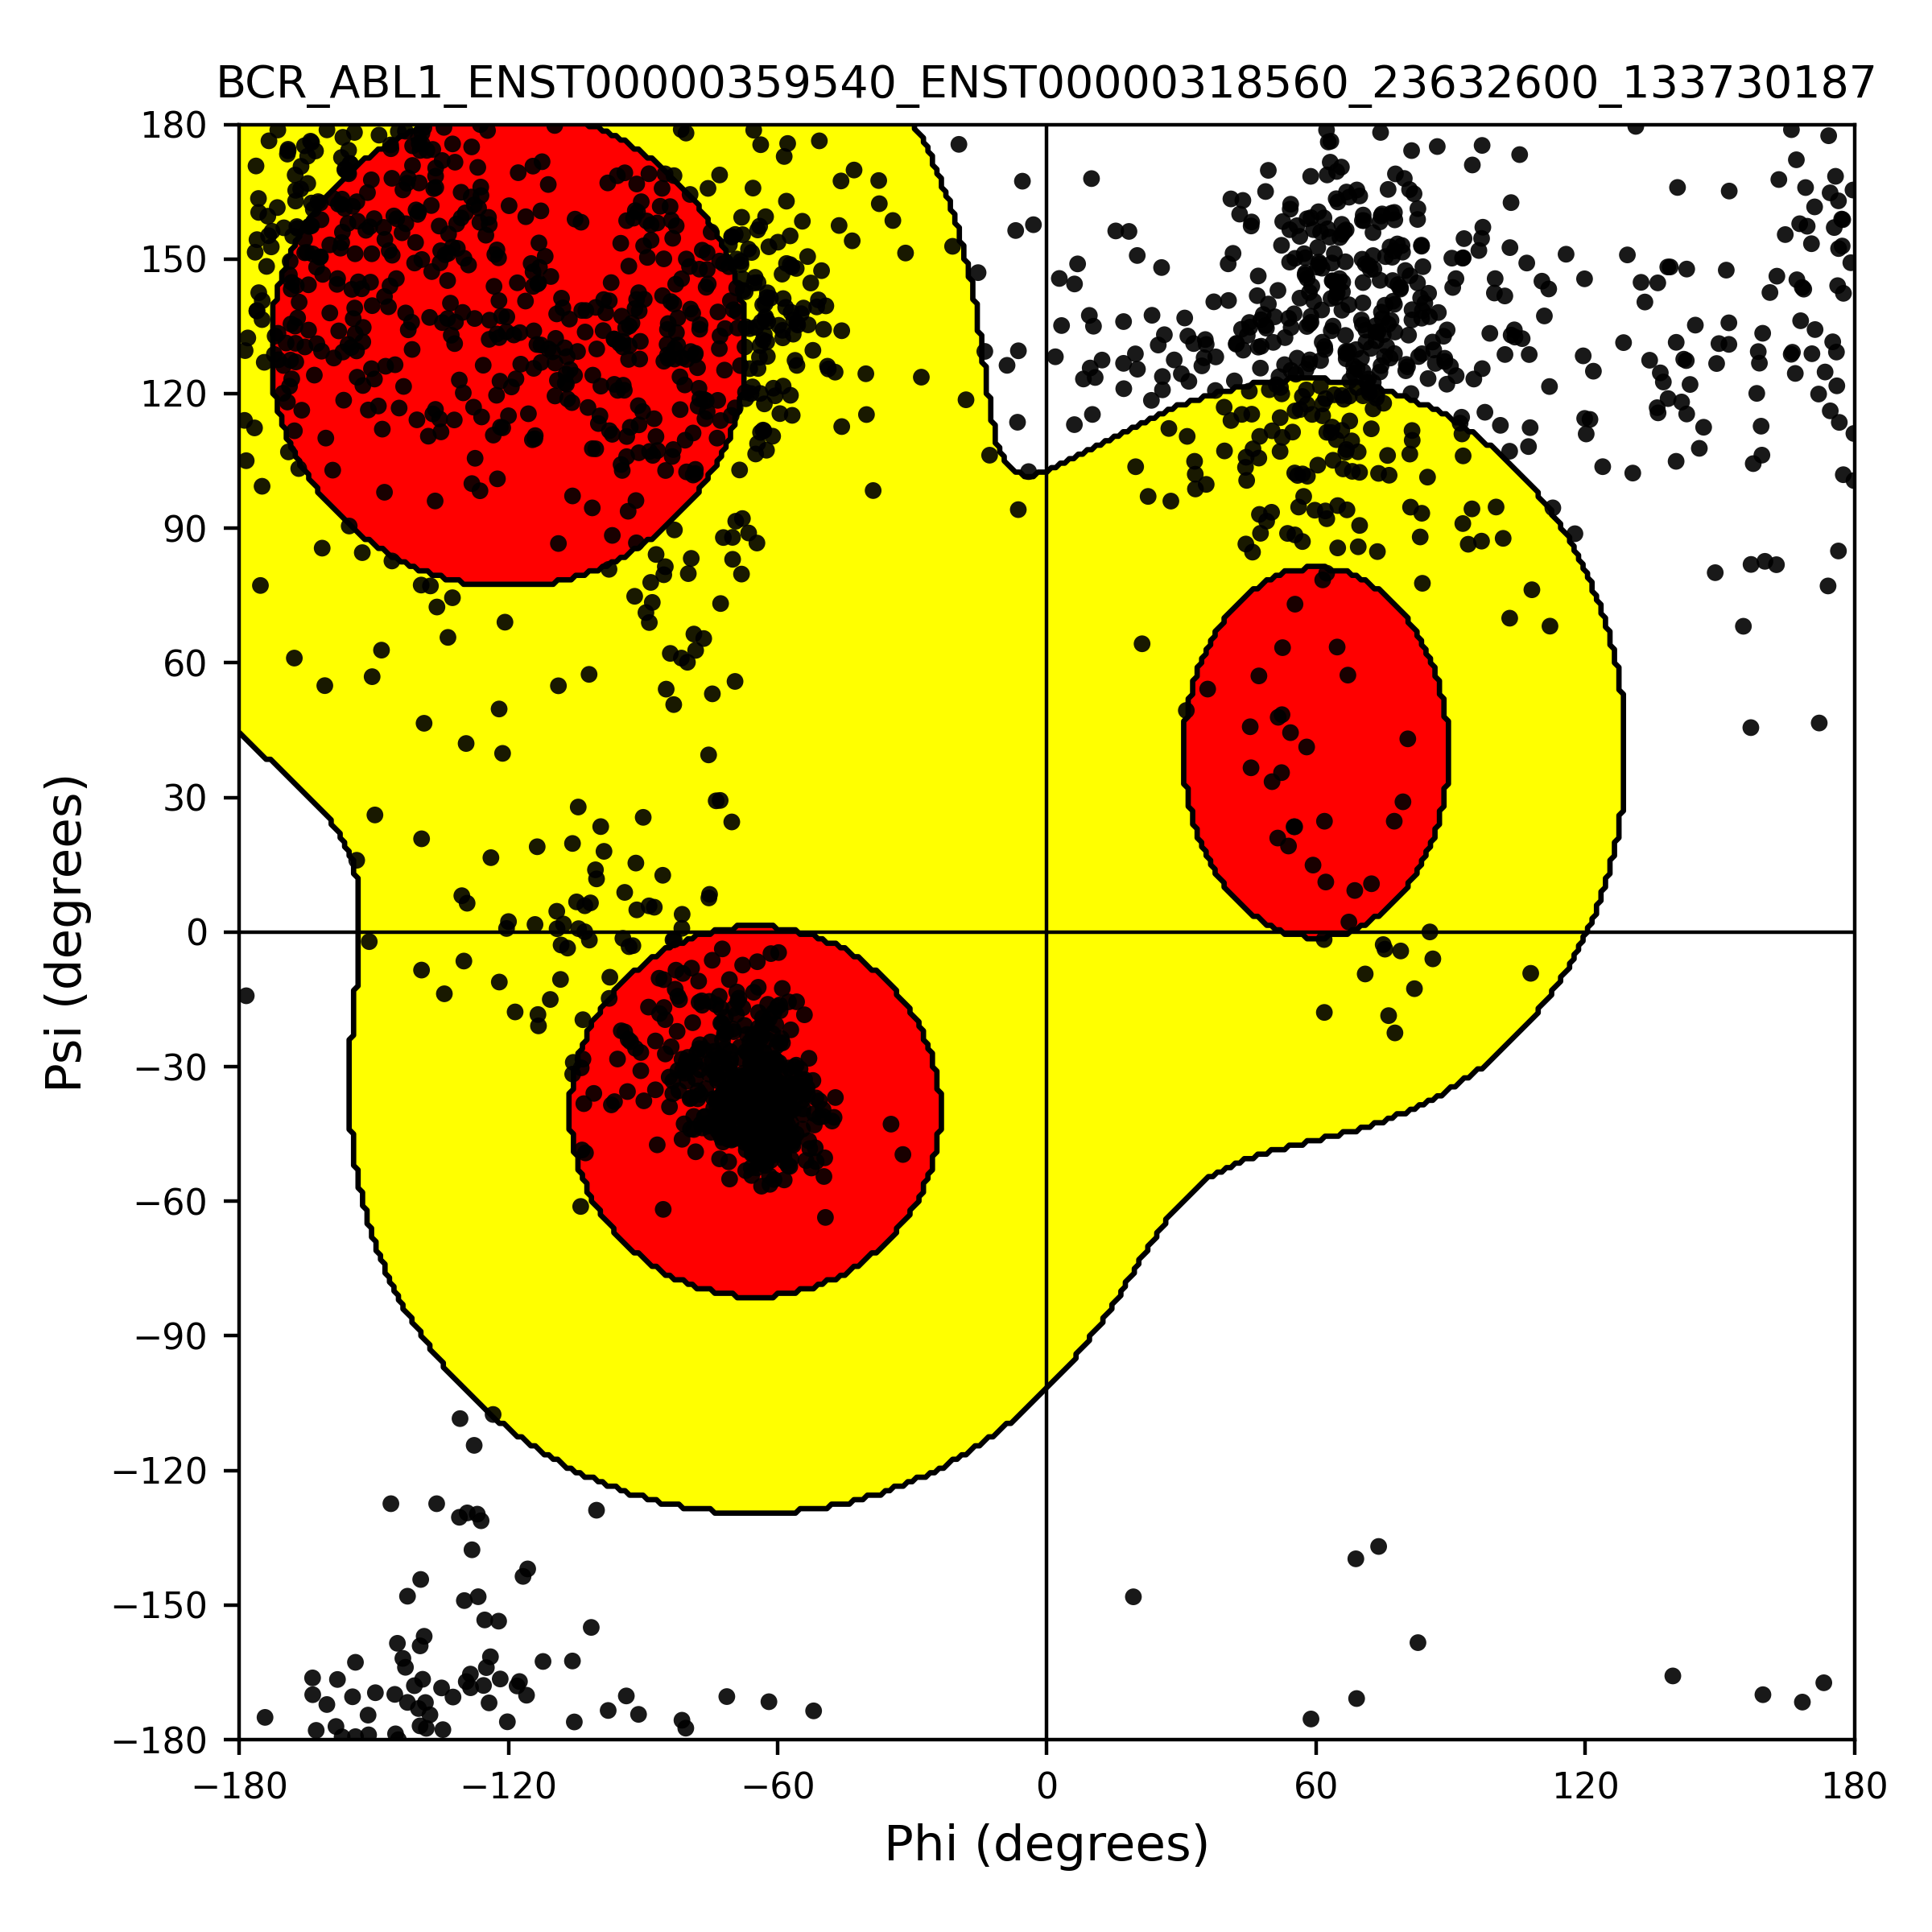
7. Structural Superimposition and RMSD Analysis
FusionPDB 2.0 includes structural comparison of predicted fusion protein regions with known experimental protein structures from the Protein Data Bank when relevant reference structures are available. Structural superimposition is performed by aligning the predicted fusion protein model or domain region with a known experimental PDB structure. The aligned structures are visualized using PyMOL, allowing users to compare the predicted fusion protein structure with experimentally determined protein folds. The RMSD, is calculated to measure structural similarity between the predicted model and the known reference structure. RMSD represents the average distance between aligned atoms after superimposition. A lower RMSD generally indicates better structural agreement between the predicted fusion protein region and the known experimental structure. A higher RMSD may suggest structural divergence, altered domain conformation, truncation effects, flexible regions, or lower prediction confidence. This analysis is useful for determining whether a fusion protein preserves a known functional domain fold. For example, if a predicted fusion protein contains a kinase domain, structural superimposition with a known kinase structure can help evaluate whether the kinase fold is retained. FusionPDB 2.0 provides superimposed structural images to help users visually inspect structural similarity and potential fusion-induced changes. Below is the superimporse image between the BCE-ABL1 fusion protein and the most similar ABL1's known PDB. Below is the superimpose between the BCR-ABL1 fusion protein (blue) and experimentally validated PDB structure of ABL1 (yellow, 5N7E).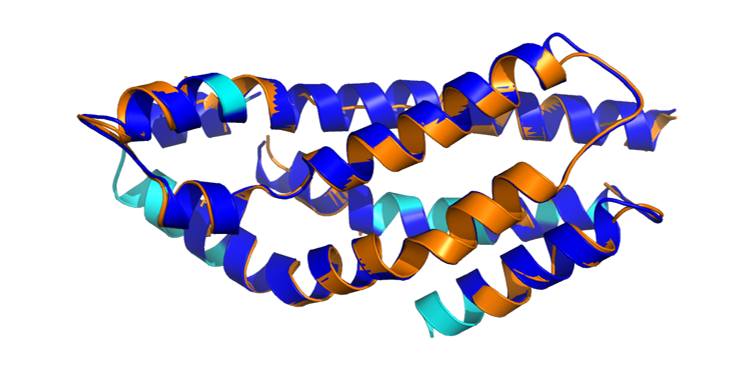
8. Functional Features with the InterPro Protein Domain Mapping
FusionPDB 2.0 integrates InterPro domain annotation with pLDDT visualization for each fusion protein. InterProScan identifies conserved protein domains, families, motifs, and functional regions using multiple domain databases such as Pfam and other protein signature resources. For each fusion protein, FusionPDB 2.0 maps InterPro domain start and end coordinates onto the pLDDT confidence plot. This allows users to see where annotated domains are located along the protein sequence and whether those domains are predicted with high or low confidence. This combined visualization is important because it connects sequence-level functional annotation with structure-level confidence. Users can determine whether a domain is fully retained, partially truncated, interrupted by a fusion breakpoint, or located in a low-confidence region. For example, a fusion protein may contain a kinase domain, DNA-binding domain, transcription factor domain, or protein interaction domain. By viewing the domain annotation together with pLDDT scores, users can assess whether the domain is likely to be structurally preserved and suitable for biological interpretation. This feature helps prioritize fusion proteins for downstream analysis, including therapeutic target selection, mechanistic studies, structural comparison, and experimental validation. Below is the InterPro protein domain distribution across the BCR-ABL1 fusion peptide sequence with pLDDT distribution.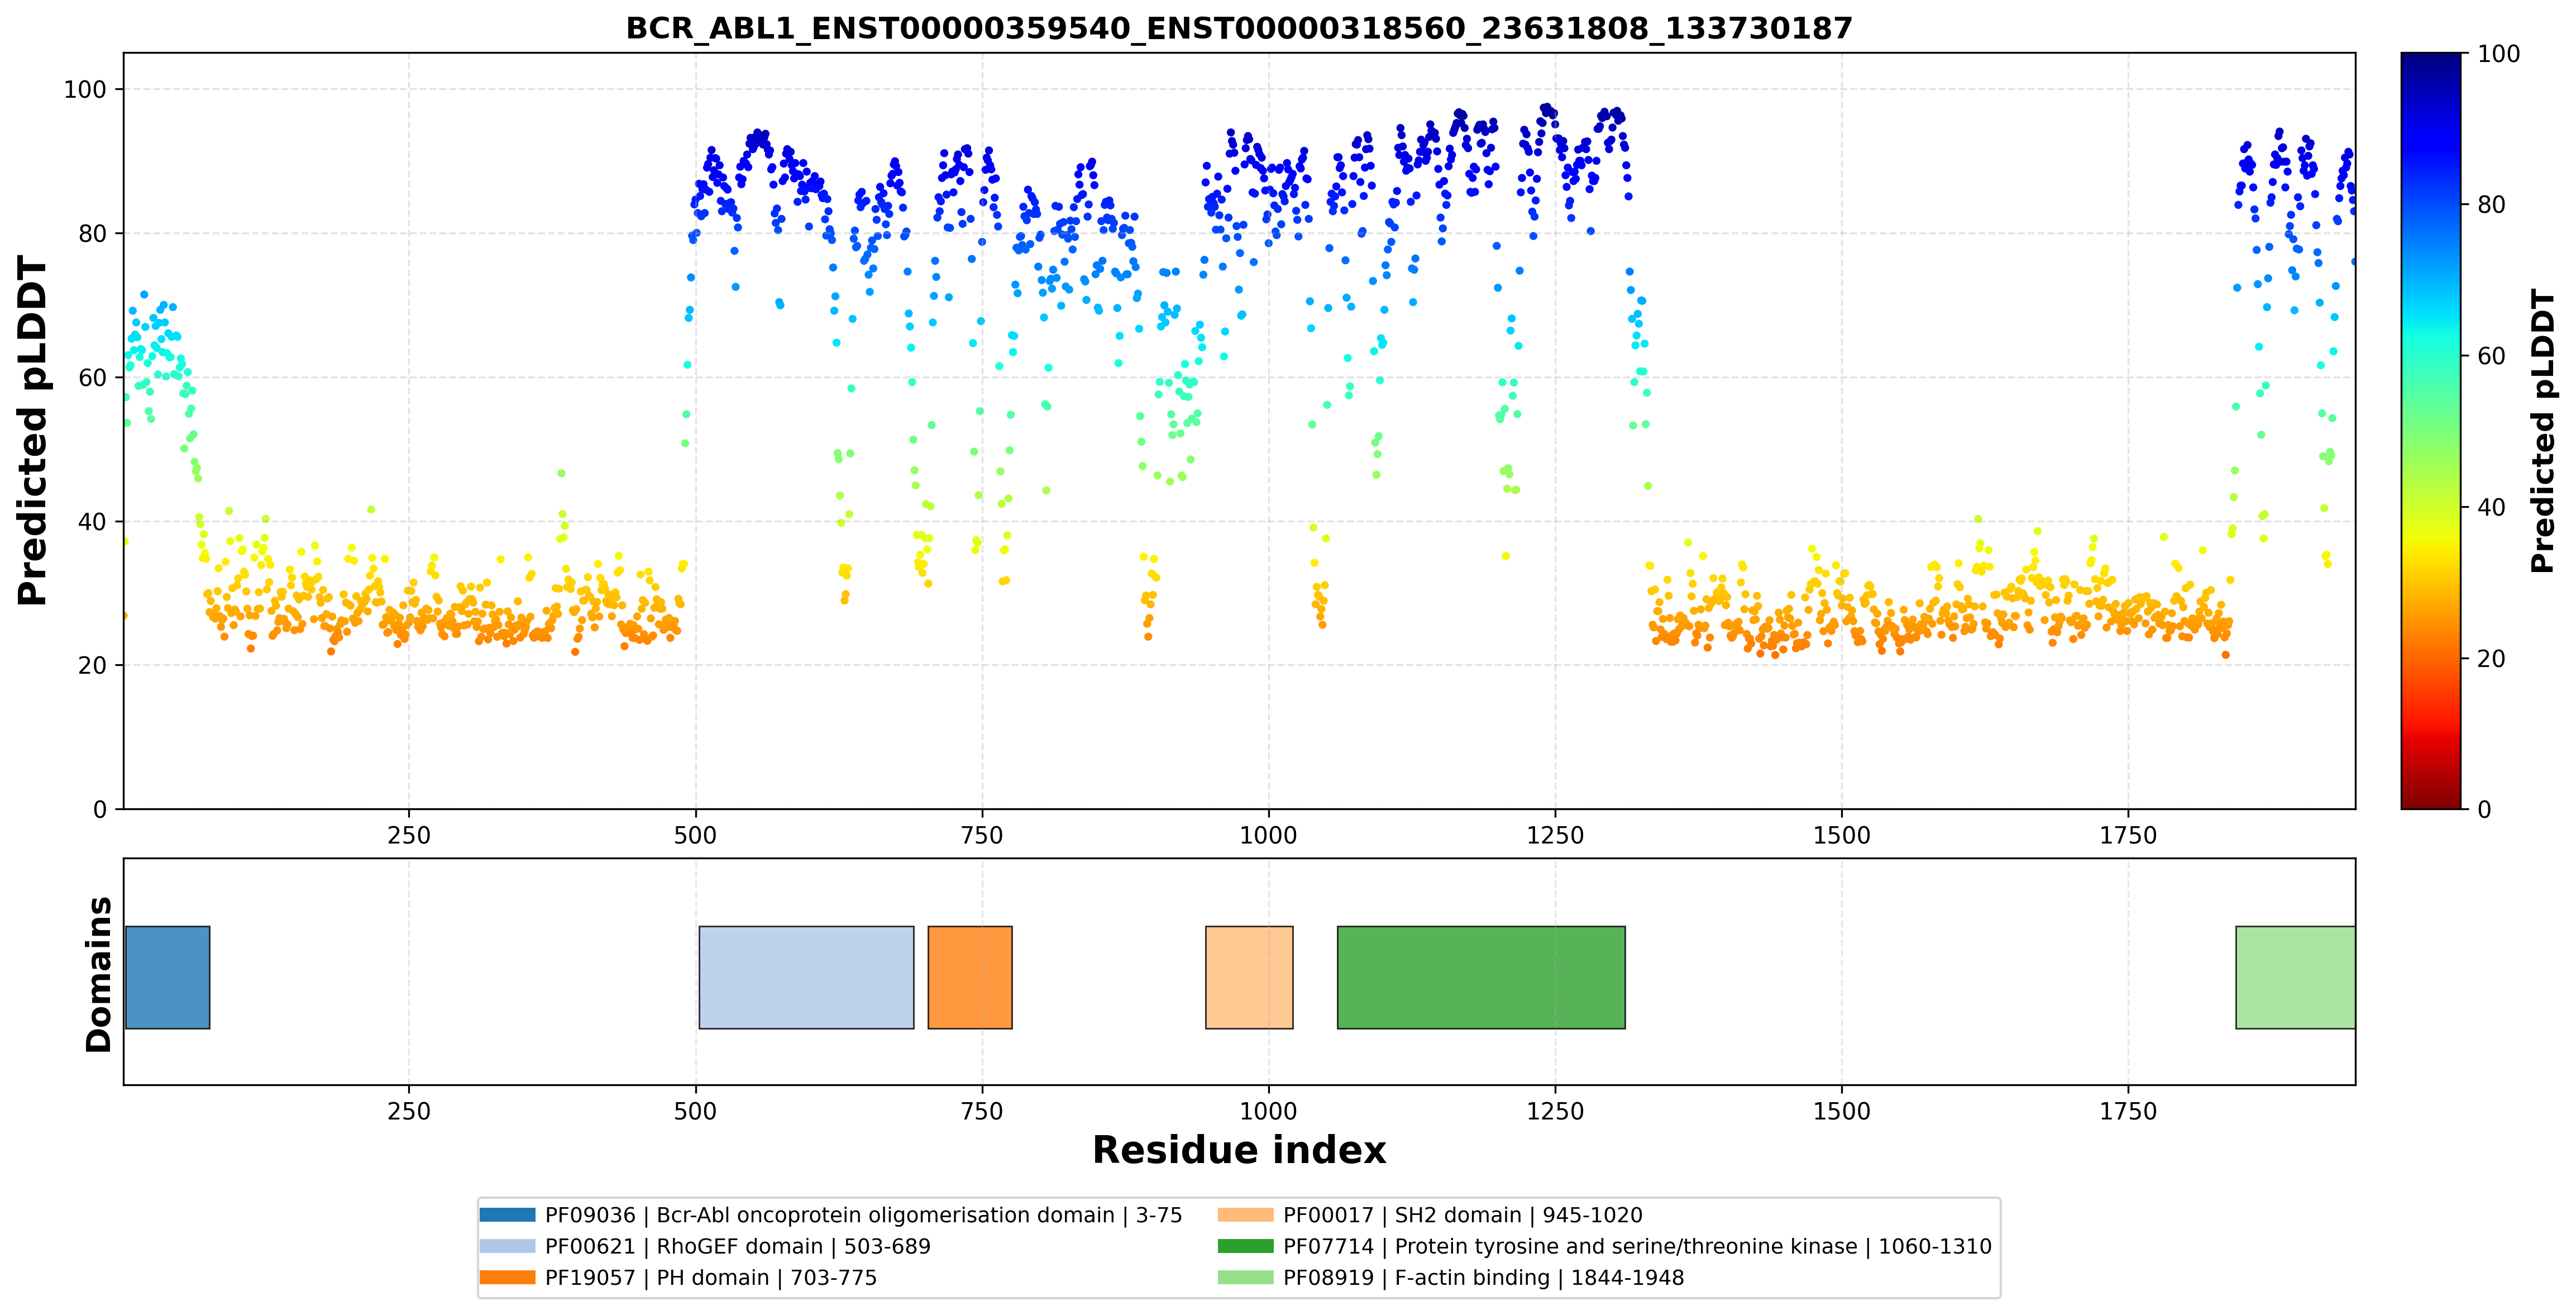
** Review and Perspective on Artificial intelligence in Fusion Protein 3D Structure Prediction
From our recent work providing a perspective on AI approaches in fusion protein 3D structure prediction (Kumar and Kim, 2024), we compared multiple AI tools for protein structure prediction (AlphaFold2, RosettaFold, trRosetta, and D-I-TASSER) on four fusion proteins using the pLDDT (predicted Local Distance Difference Test). AlphaFold2 outperformed other tools. Furthermore, we developed FusionPDB, the first resource of 3D structures for ~3,500 manually curated fusion proteins generated with AlphaFold2. We provided a diverse assessment of the predicted 3D structures and, for the chosen fusion proteins, performed virtual screening against the FDA-approved drugs.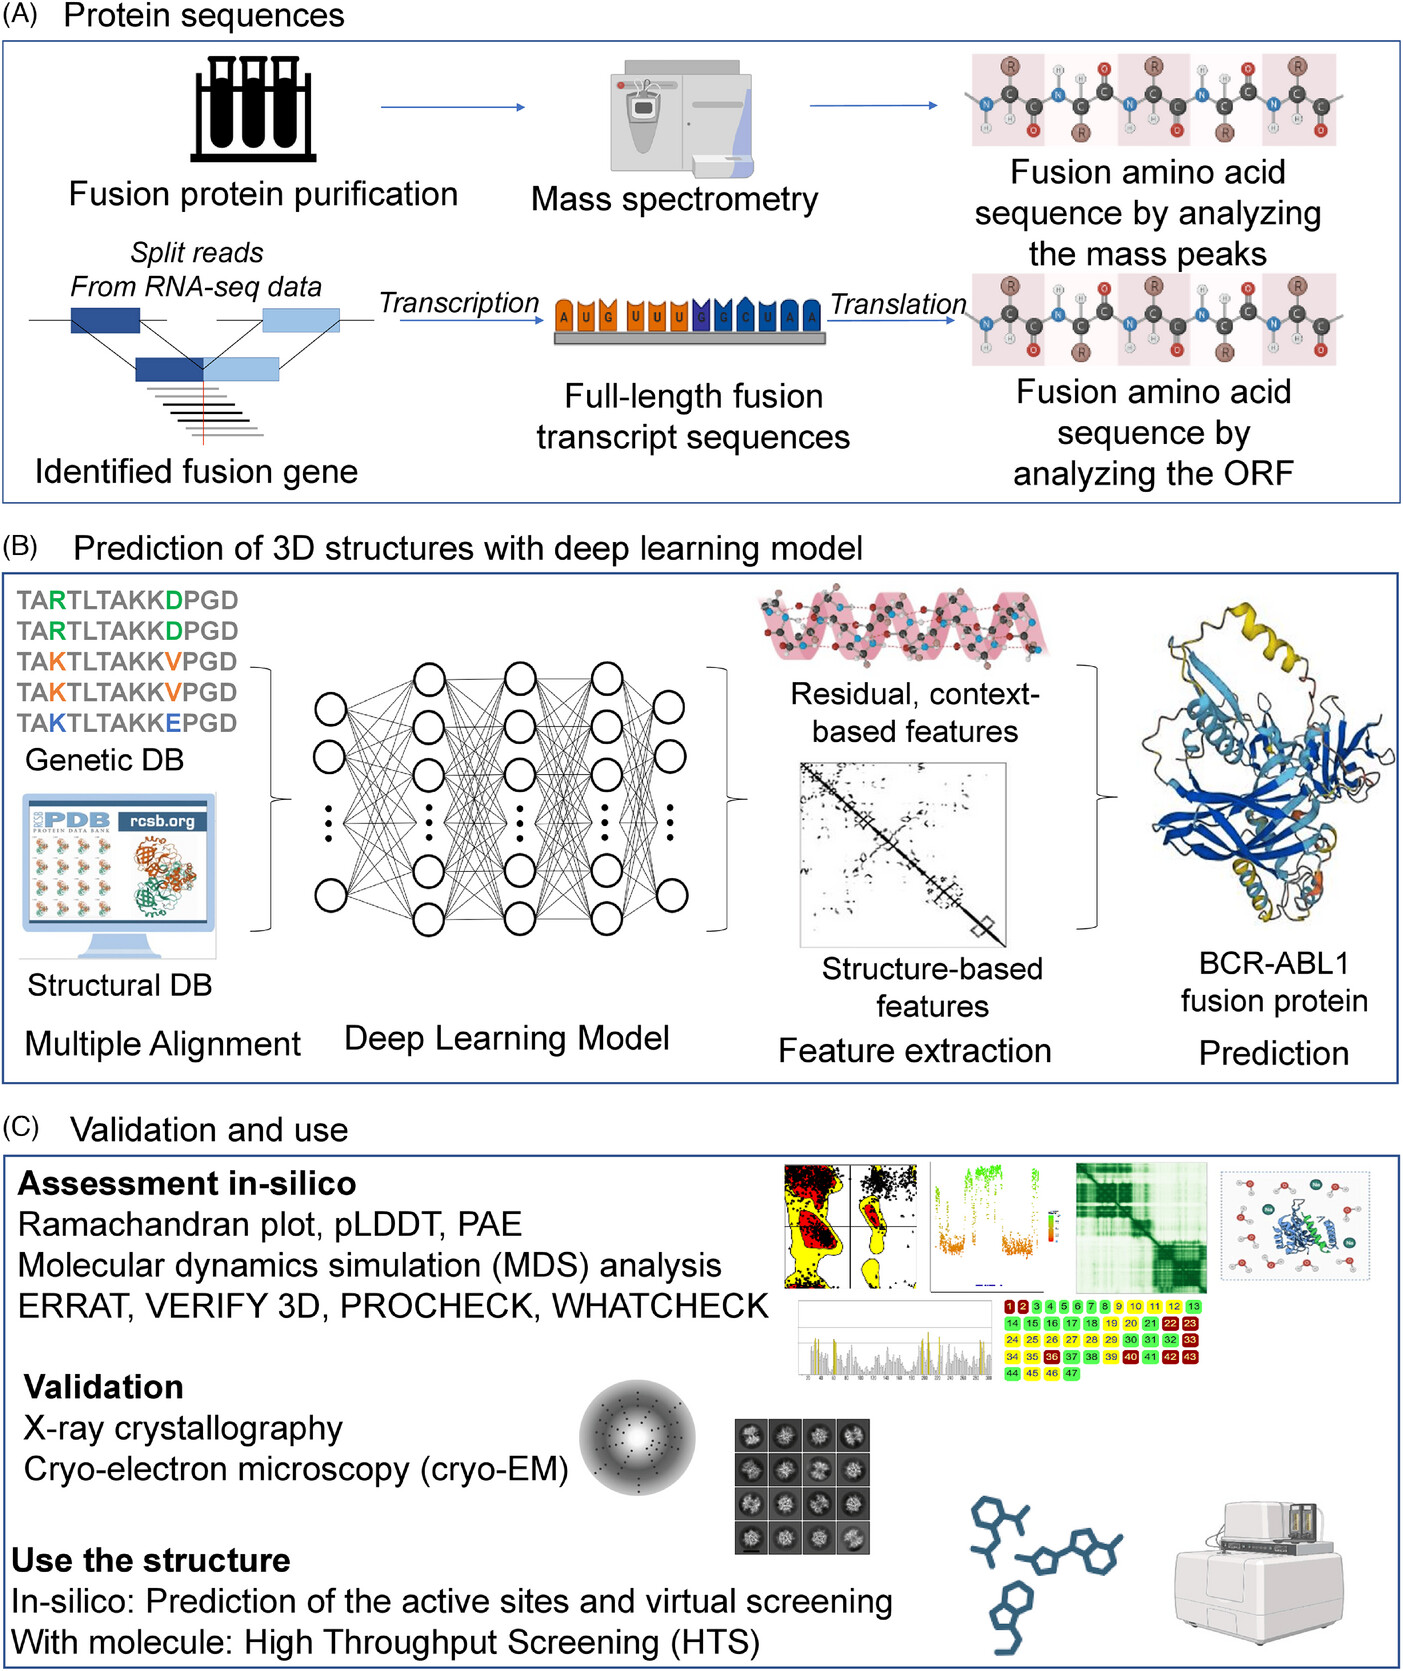
** Benefits of FusionPDB 2.0
FusionPDB 2.0 provides a unified platform for sequence, structure, and functional assessment of fusion proteins. The database is designed to help users move beyond fusion protein sequence to structure prediction and interpretation. Major benefits include:• Systematic collection of fusion protein sequences across multiple fusion categories.
• Predicted 3D structures for full-length, N-truncated, C-truncated, and personalized fusion proteins.
• Residue-level pLDDT confidence analysis for evaluating model reliability.
• PAE plots for assessing domain orientation and global structural uncertainty.
• Ramachandran plots for stereochemical quality assessment.
• InterPro domain mapping for functional interpretation.
• Superimposition with known experimental PDB structures for structural comparison.
• RMSD calculation for quantitative similarity assessment.
• Visualization-ready structural images for database browsing and research use.
Together, these features allow users to identify structurally confident fusion proteins, evaluate preserved functional domains, investigate fusion-induced structural changes, and prioritize fusion proteins for therapeutic or experimental studies.
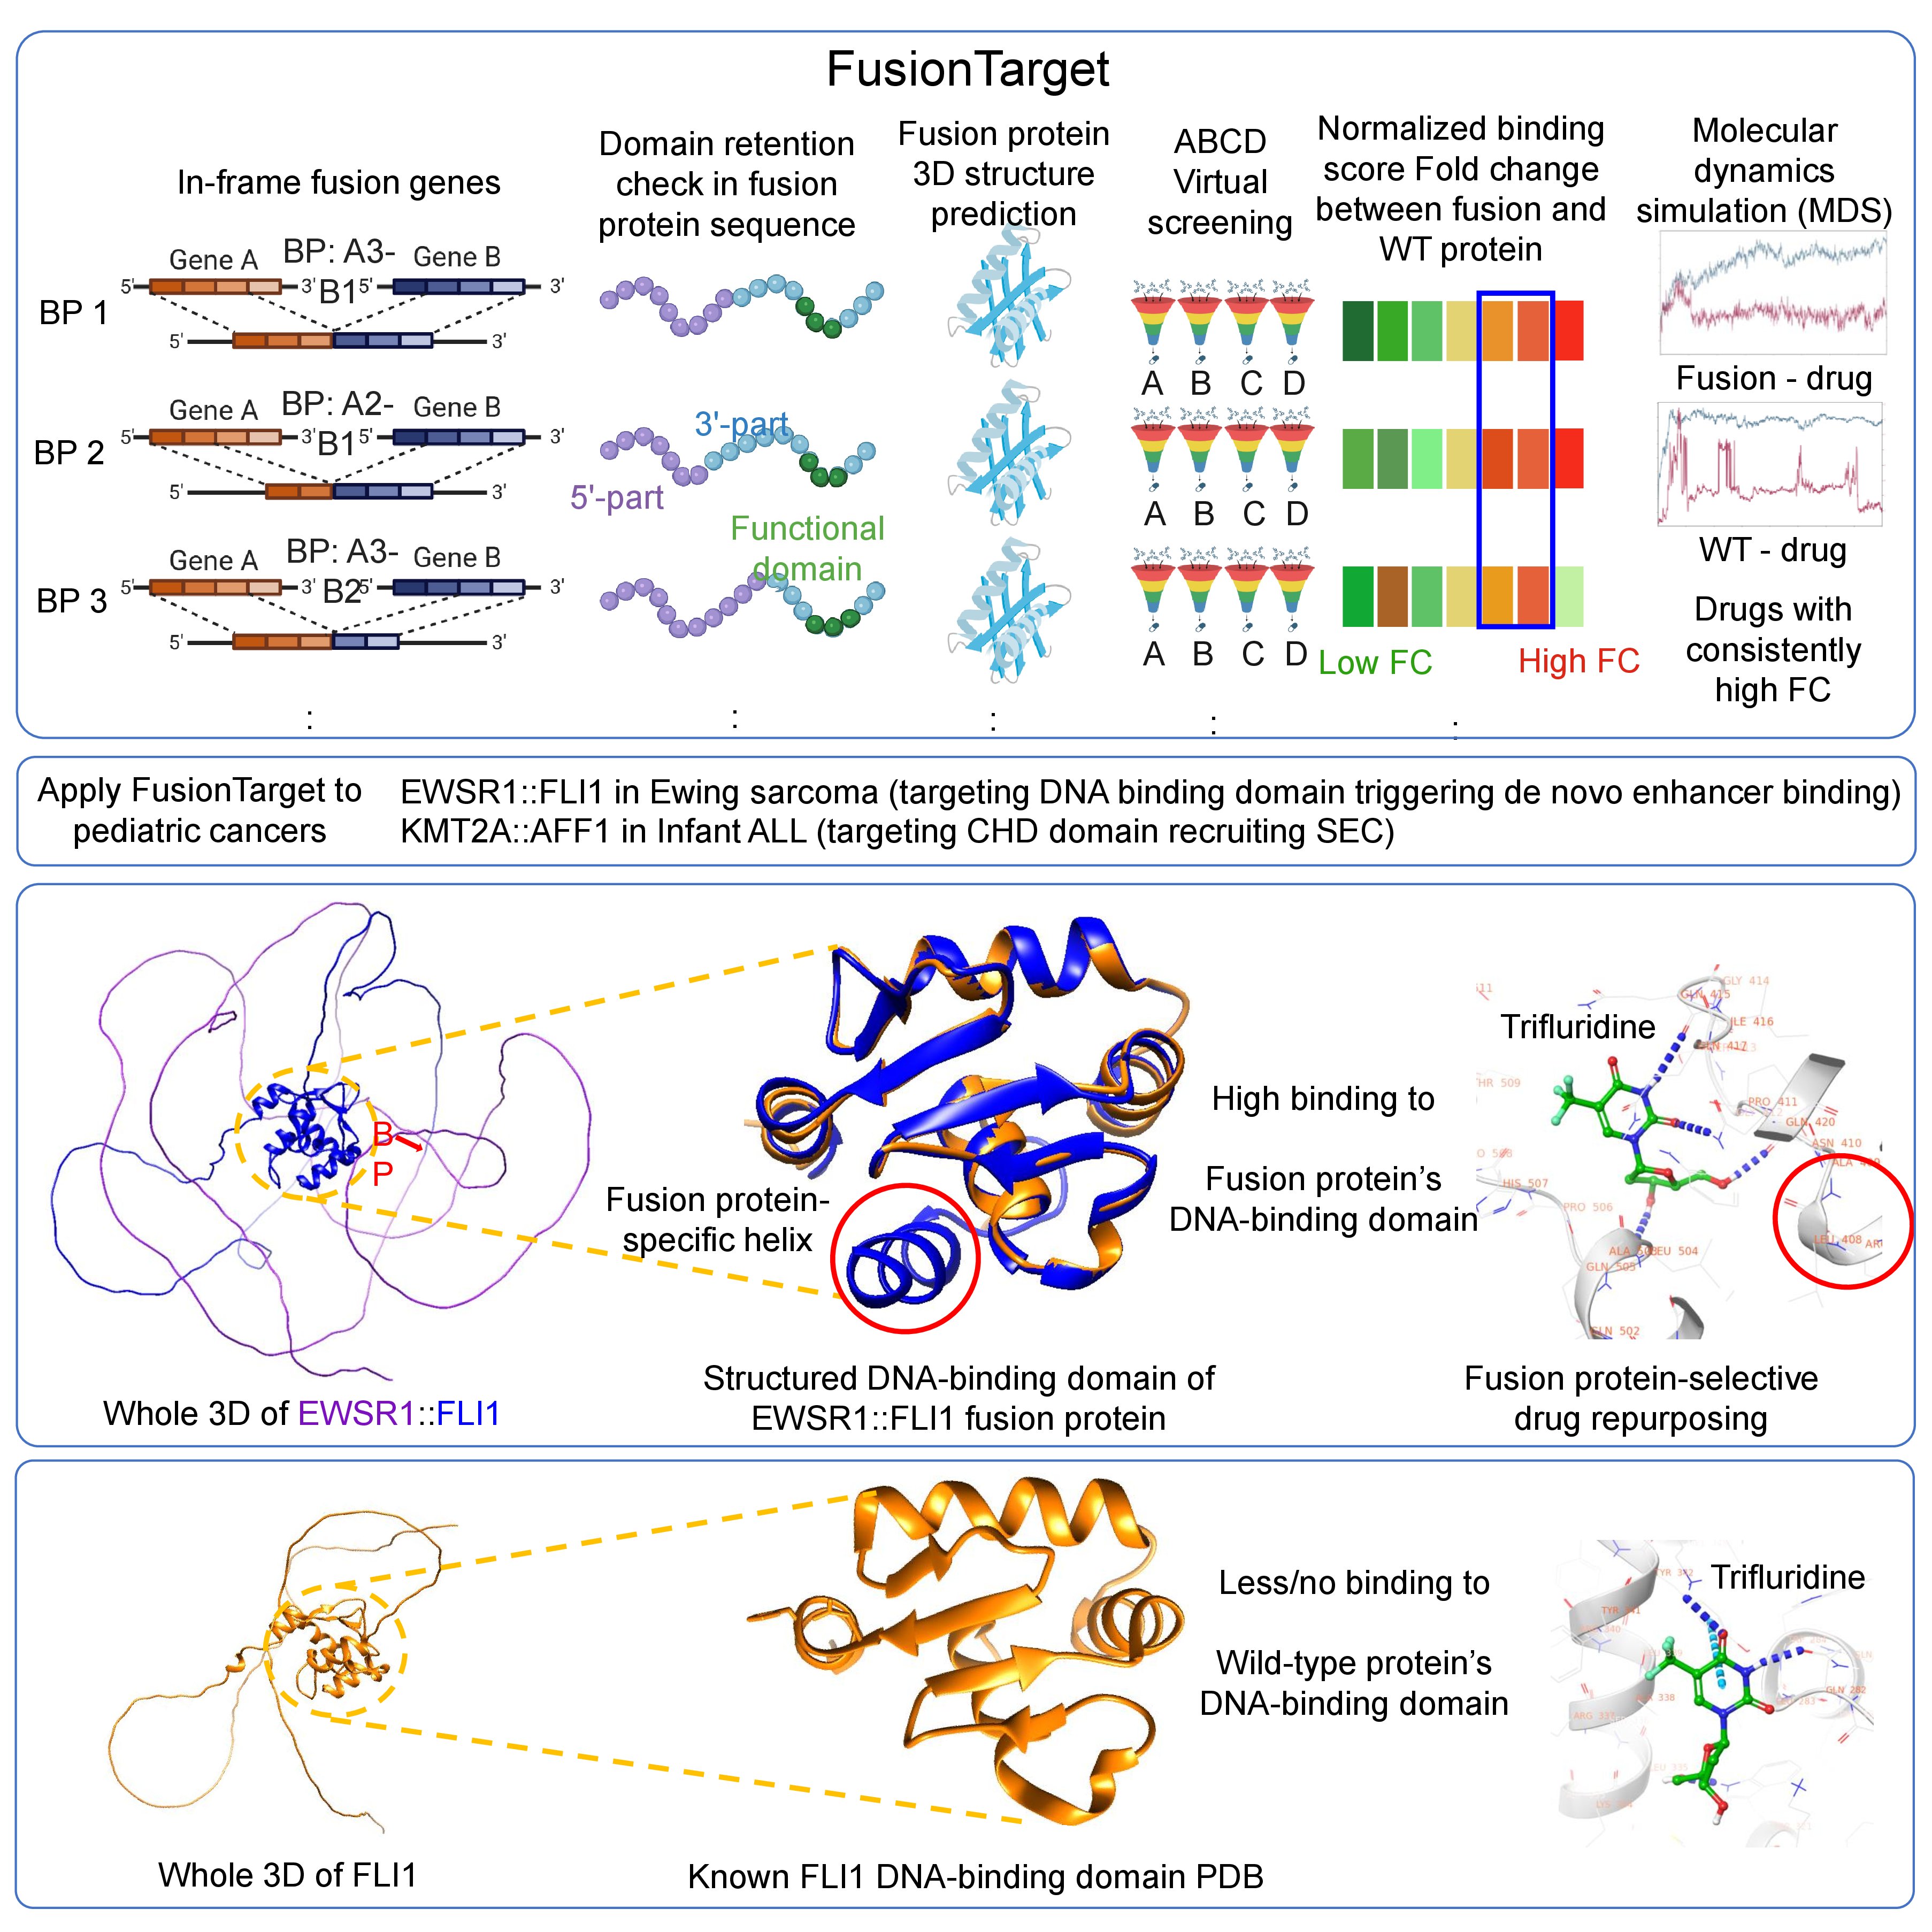
Based on our expertise on the fusion protein 3D structure study, we developed a novel Computational framework for drug repurposing against modeled fusion protein structures from genomic breakpoints, named FusionTarget (Kumar et al., 2026). FusionTarget identifies selective drugs by modeling fusion protein structures. Four conditional screenings ensure high targeting specificity to the fusion protein. We applied FusionTarget pipeline to 2 childhood cancers and identified potential drug repurposing successfully. Trifluridine suppresses oncogenic programs in EWSR1::FLI1 Ewing sarcoma models. Brigatinib disrupts leukemogenic transcription in KMT2A::AFF1 leukemia cells. Utilizing the fusion protein 3D structures from FusionPDB2 and application of FusionTarget pipeline, one can identify a potential drug repurposing of human fusion protein.
 Copyright 2022-Present
The University of Texas Health Science Center at Houston (UTHealth)
Web File Viewing | Emergency Information
Campus Carry|Site Policies