| UTHEALTH HOME ABOUT SBMI A-Z WEBMAIL INSIDE THE UNIVERSITY |
|
|||||||
|

Fusion Protein:RTF1-EHD4 |
Fusion Protein Summary |
 Fusion gene summary Fusion gene summary |
| Fusion partner gene information | Fusion gene name: RTF1-EHD4 | FusionPDB ID: 78514 | FusionGDB2.0 ID: 78514 | Hgene | Tgene | Gene symbol | RTF1 | EHD4 | Gene ID | 23168 | 30844 |
| Gene name | RTF1 homolog, Paf1/RNA polymerase II complex component | EH domain containing 4 | |
| Synonyms | GTL7|KIAA0252 | PAST4 | |
| Cytomap | 15q15.1 | 15q15.1 | |
| Type of gene | protein-coding | protein-coding | |
| Description | RNA polymerase-associated protein RTF1 homologRtf1, Paf1/RNA polymerase II complex component, homologortholog of mouse gene trap locus 7 | EH domain-containing protein 4PAST homolog 4hepatocellular carcinoma-associated protein 10/11hepatocellular carcinoma-associated protein HCA11ortholog of rat pincher | |
| Modification date | 20200313 | 20200313 | |
| UniProtAcc | . | Q9H223 | |
| Ensembl transtripts involved in fusion gene | ENST ids | ENST00000389629, ENST00000462276, | ENST00000220325, |
| Fusion gene scores for assessment (based on all fusion genes of FusionGDB 2.0) | * DoF score | 11 X 9 X 7=693 | 8 X 6 X 7=336 |
| # samples | 13 | 9 | |
| ** MAII score | log2(13/693*10)=-2.41434372910876 possibly effective Gene in Pan-Cancer Fusion Genes (peGinPCFGs). DoF>8 and MAII<0 | log2(9/336*10)=-1.90046432644909 possibly effective Gene in Pan-Cancer Fusion Genes (peGinPCFGs). DoF>8 and MAII<0 | |
| Context (manual curation of fusion genes in FusionPDB) | PubMed: RTF1 [Title/Abstract] AND EHD4 [Title/Abstract] AND fusion [Title/Abstract] | ||
| Most frequent breakpoint (based on all fusion genes of FusionGDB 2.0) | RTF1(41750074)-EHD4(42246138), # samples:2 | ||
| Anticipated loss of major functional domain due to fusion event. | RTF1-EHD4 seems lost the major protein functional domain in Hgene partner, which is a CGC by not retaining the major functional domain in the partially deleted in-frame ORF. RTF1-EHD4 seems lost the major protein functional domain in Hgene partner, which is a CGC by not retaining the major functional domain in the partially deleted in-frame ORF. RTF1-EHD4 seems lost the major protein functional domain in Hgene partner, which is a essential gene by not retaining the major functional domain in the partially deleted in-frame ORF. RTF1-EHD4 seems lost the major protein functional domain in Hgene partner, which is a essential gene by not retaining the major functional domain in the partially deleted in-frame ORF. | ||
| * DoF score (Degree of Frequency) = # partners X # break points X # cancer types ** MAII score (Major Active Isofusion Index) = log2(# samples/DoF score*10) |
| Gene ontology of each fusion partner gene with evidence of Inferred from Direct Assay (IDA) from Entrez |
| Partner | Gene | GO ID | GO term | PubMed ID |
| Hgene | RTF1 | GO:0019827 | stem cell population maintenance | 19345177 |
| Hgene | RTF1 | GO:0032968 | positive regulation of transcription elongation from RNA polymerase II promoter | 20178742 |
| Hgene | RTF1 | GO:0045944 | positive regulation of transcription by RNA polymerase II | 20178742 |
| Fusion gene breakpoints across RTF1 (5'-gene) * Click on the image to open the UCSC genome browser with custom track showing this image in a new window. |
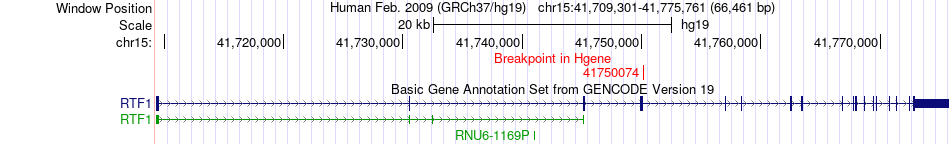 |
| Fusion gene breakpoints across EHD4 (3'-gene) * Click on the image to open the UCSC genome browser with custom track showing this image in a new window. |
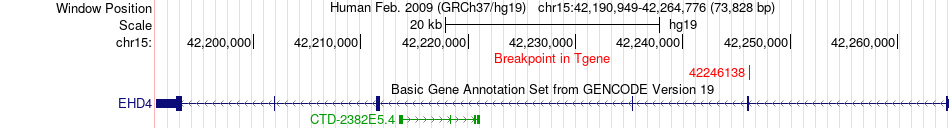 |
Top |
Fusion Gene Sample Information |
| Fusion gene information from FusionGDB2.0. |
| Fusion gene information from two resources (ChiTars 5.0 and ChimerDB 4.0) * All genome coordinats were lifted-over on hg19. * Click on the break point to see the gene structure around the break point region using the UCSC Genome Browser. |
| Source | Disease | Sample | Hgene | Hchr | Hbp | Hstrand | Tgene | Tchr | Tbp | Tstrand |
| ChimerDB4 | PRAD | TCGA-CH-5739-01A | RTF1 | chr15 | 41750074 | + | EHD4 | chr15 | 42246138 | - |
| ChimerDB4 | PRAD | TCGA-CH-5739 | RTF1 | chr15 | 41750074 | + | EHD4 | chr15 | 42246138 | - |
Top |
Fusion ORF Analysis |
| Fusion information from ORFfinder translation from full-length transcript sequence from FusionPDB. |
| Henst | Tenst | Hgene | Hchr | Hbp | Hstrand | Tgene | Tchr | Tbp | Tstrand | Seq length (transcript) | BP loci (transcript) | Predicted start (transcript) | Predicted stop (transcript) | Seq length (amino acids) |
| ENST00000389629 | RTF1 | chr15 | 41750074 | + | ENST00000220325 | EHD4 | chr15 | 42246138 | - | 3957 | 674 | 12 | 2063 | 683 |
| DeepORF prediction of the coding potential based on the fusion transcript sequence of in-frame fusion genes. DeepORF is a coding potential classifier based on convolutional neural network by comparing the real Ribo-seq data. If the no-coding score < 0.5 and coding score > 0.5, then the in-frame fusion transcript is predicted as being likely translated. |
| Henst | Tenst | Hgene | Hchr | Hbp | Hstrand | Tgene | Tchr | Tbp | Tstrand | No-coding score | Coding score |
| ENST00000389629 | ENST00000220325 | RTF1 | chr15 | 41750074 | + | EHD4 | chr15 | 42246138 | - | 0.003962929 | 0.99603707 |
Top |
Fusion Amino Acid Sequences |
| For individual full-length fusion transcript sequence from FusionPDB, we ran ORFfinder and chose the longest ORF among the all predicted ones. |
| >FusionGDB ID_FusionGDB isoform ID_FGname_Hgene_Hchr_Hbp_Henst_Tgene_Tchr_Tbp_Tenst_length(fusion AA) seq_BP >78514_78514_1_RTF1-EHD4_RTF1_chr15_41750074_ENST00000389629_EHD4_chr15_42246138_ENST00000220325_length(amino acids)=683AA_BP=220 MRGRLCVGRAAAAAAAVAVPLAGGQEGSPGGGRRGSRGTTMVKKRKGRVVIDSDTEDSGSDENLDQELLSLAKRKRSDSEEKEPPVSQPA ASSDSETSDSDDEWTFGSNKNKKKGKARKIEKKGTMKKQANKTASSGSSDKDSSAESSAPEEGEVSDSDSNSSSSSSDSDSSSEDEEFHD GYGEDLMGDEEDRARLEQMTEKEREQELFNRIEKREVLKRRYLLEQDFPGMRIGPEPTTDSFIAVMYGETEGSTPGNALVVDPKKPFRKL SRFGNAFLNRFMCSQLPNQVLKSISVIDSPGILSGEKQRISRGYDFCQVLQWFAERVDRIILLFDAHKLDISDEFSEAIKAFRGQDDKIR VVLNKADQVDTQQLMRVYGALMWSLGKVINTPEVLRVYIGSFWAQPLQNTDNRRLFEAEAQDLFRDIQSLPQKAAVRKLNDLIKRARLAK VHAYIISYLKKEMPSVFGKENKKRELISRLPEIYIQLQREYQISAGDFPEVKAMQEQLENYDFTKFHSLKPKLIEAVDNMLSNKISPLMN LISQEETSTPTQLVQGGAFDGTTEGPFNQGYGEGAKEGADEEEWVVAKDKPVYDELFYTLSPINGKISGVNAKKEMVTSKLPNSVLGKIW -------------------------------------------------------------- |
Top |
Fusion Protein Functional Features |
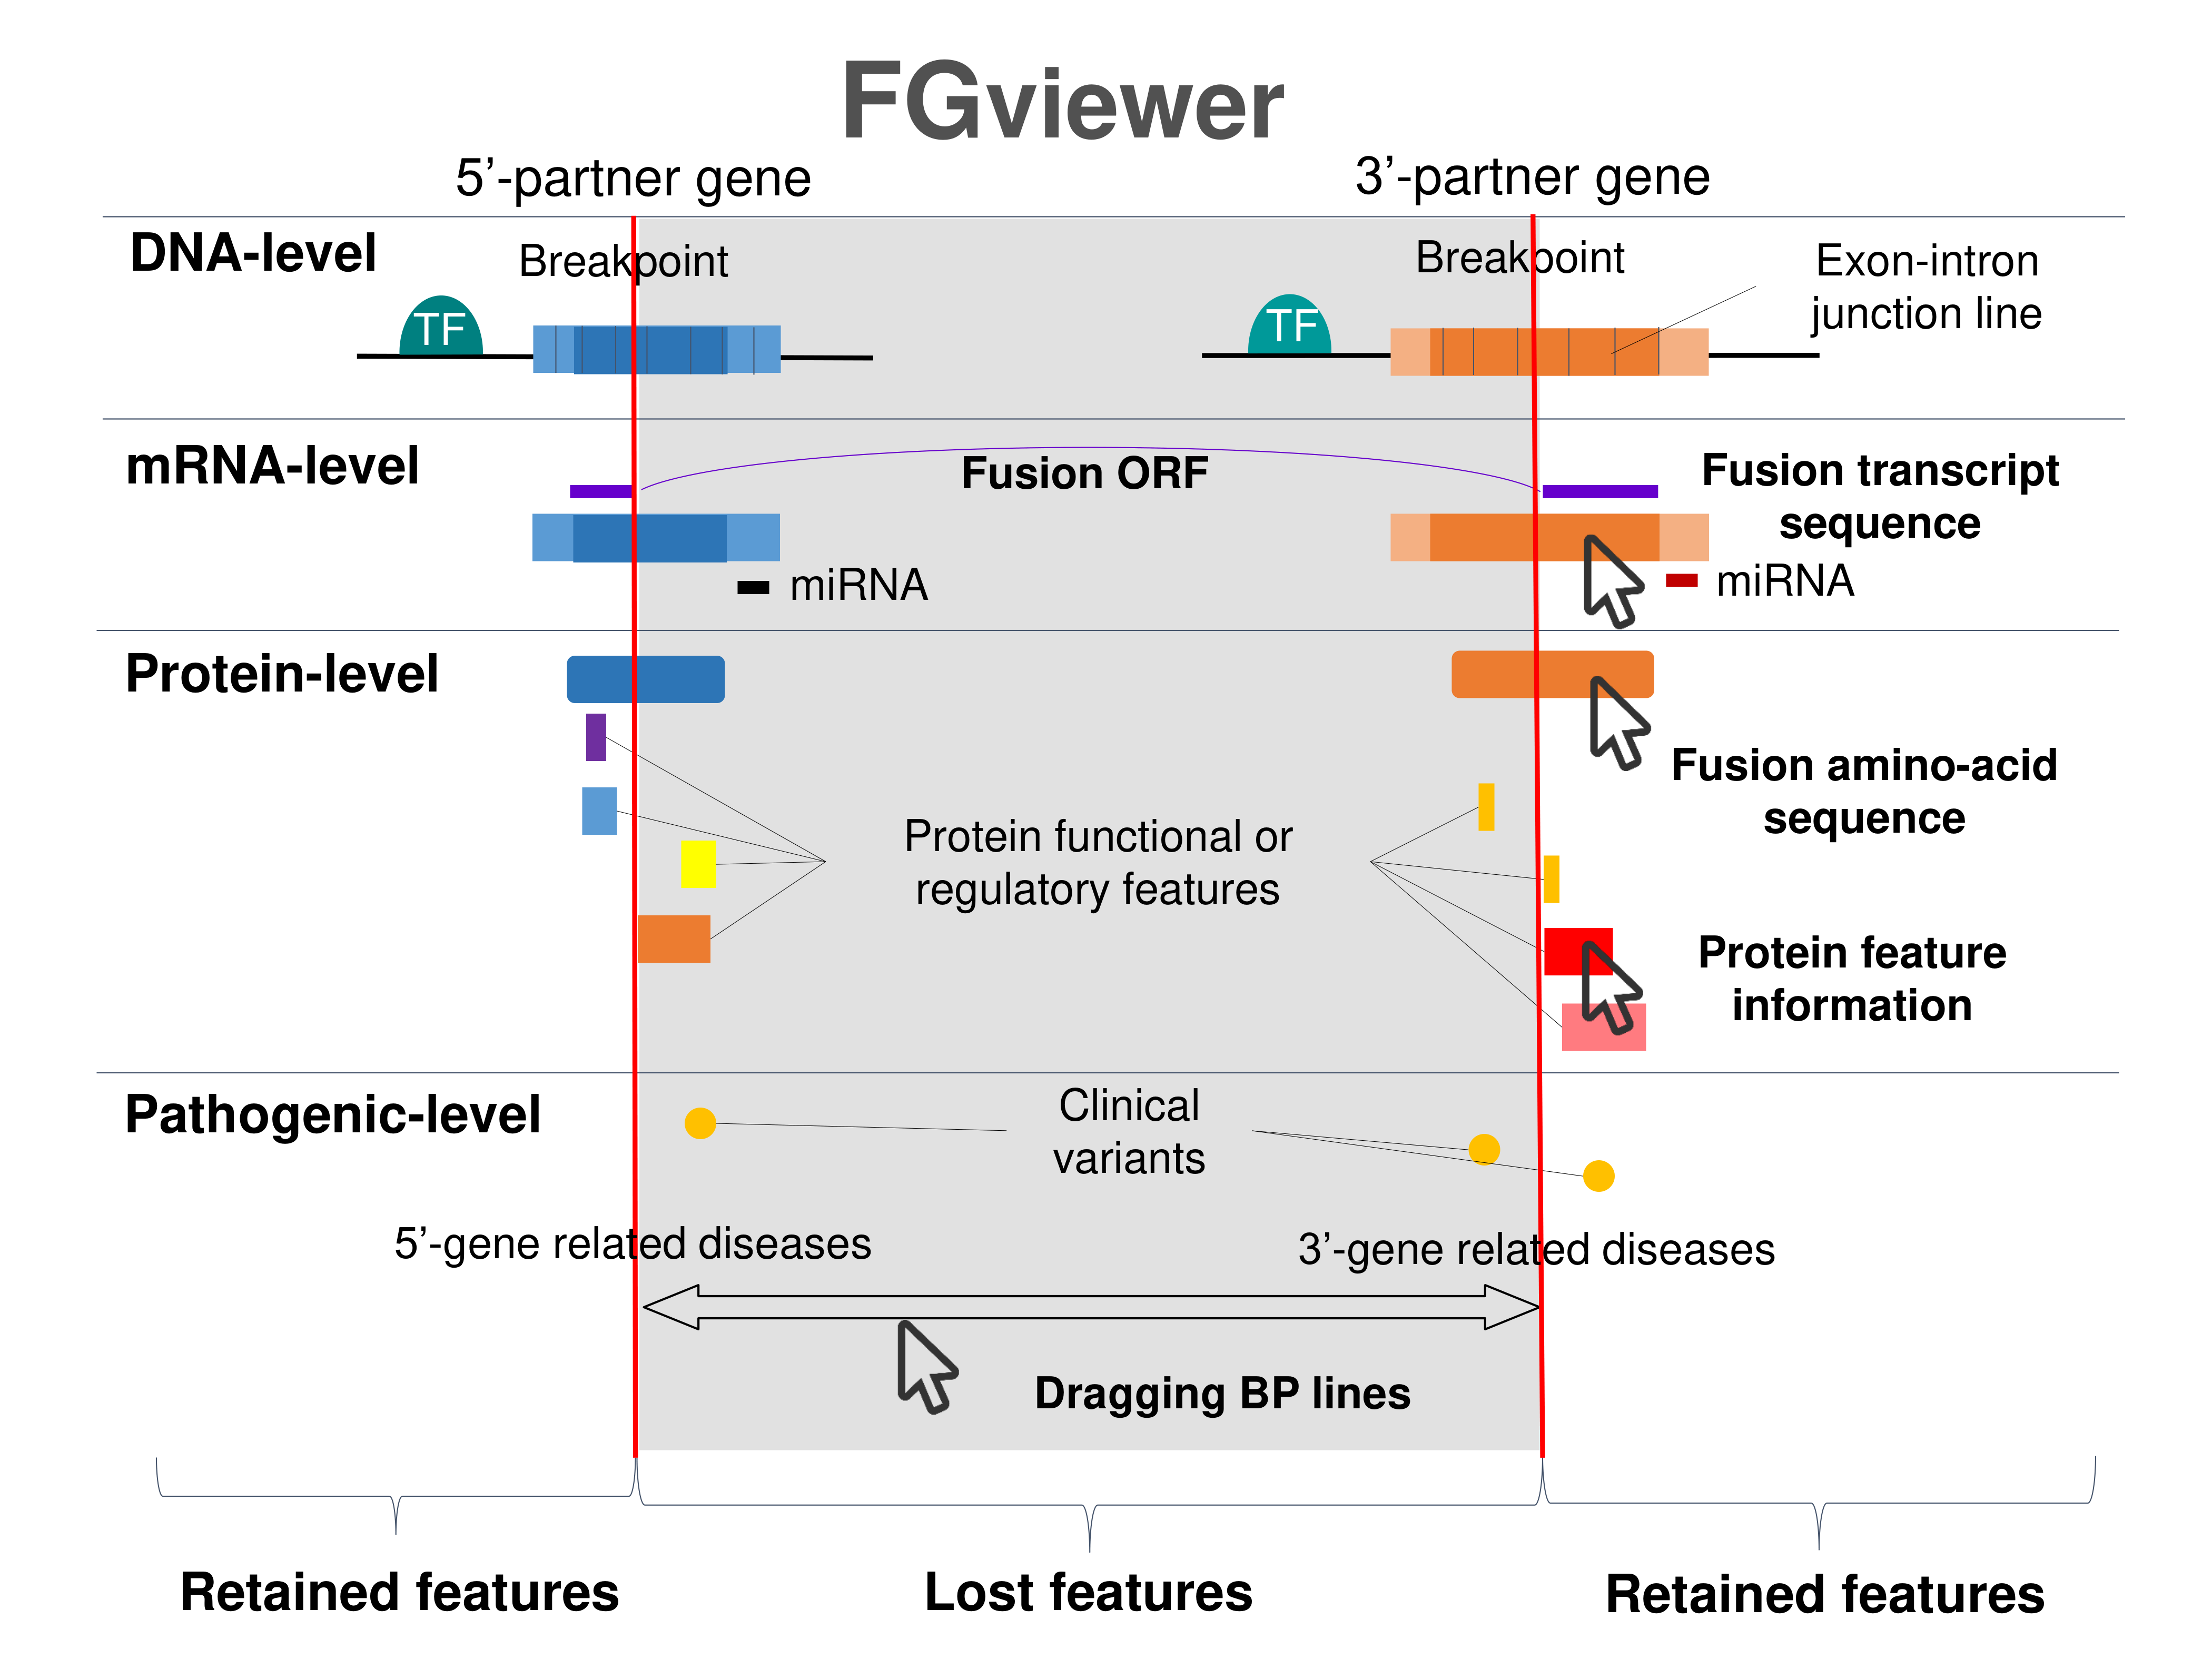
| Four levels of functional features of fusion genes Go to FGviewer search page for the most frequent breakpoint (https://ccsmweb.uth.edu/FGviewer/chr15:41750074/chr15:42246138) - FGviewer provides the online visualization of the retention search of the protein functional features across DNA, RNA, protein, and pathological levels. - How to search 1. Put your fusion gene symbol. 2. Press the tab key until there will be shown the breakpoint information filled. 4. Go down and press 'Search' tab twice. 4. Go down to have the hyperlink of the search result. 5. Click the hyperlink. 6. See the FGviewer result for your fusion gene. |
 |
| Main function of each fusion partner protein. (from UniProt) |
| Hgene | Tgene |
| . | EHD4 |
| FUNCTION: Might normally function as a transcriptional repressor. EWS-fusion-proteins (EFPS) may play a role in the tumorigenic process. They may disturb gene expression by mimicking, or interfering with the normal function of CTD-POLII within the transcription initiation complex. They may also contribute to an aberrant activation of the fusion protein target genes. | FUNCTION: ATP- and membrane-binding protein that probably controls membrane reorganization/tubulation upon ATP hydrolysis. Plays a role in early endosomal transport. {ECO:0000269|PubMed:17233914, ECO:0000269|PubMed:18331452}. |
| Retention analysis result of each fusion partner protein across 39 protein features of UniProt such as six molecule processing features, 13 region features, four site features, six amino acid modification features, two natural variation features, five experimental info features, and 3 secondary structure features. Here, because of limited space for viewing, we only show the protein feature retention information belong to the 13 regional features. All retention annotation result can be downloaded at * Minus value of BPloci means that the break pointn is located before the CDS. |
| - Retained protein feature among the 13 regional features. |
| Partner | Gene | Hbp | Tbp | ENST | Strand | BPexon | TotalExon | Protein feature loci | *BPloci | TotalLen | Protein feature | Protein feature note |
| Hgene | RTF1 | chr15:41750074 | chr15:42246138 | ENST00000389629 | + | 4 | 18 | 10_18 | 220.66666666666666 | 711.0 | Compositional bias | Note=Poly-Ala |
| Hgene | RTF1 | chr15:41750074 | chr15:42246138 | ENST00000389629 | + | 4 | 18 | 135_173 | 220.66666666666666 | 711.0 | Compositional bias | Note=Ser-rich |
| Tgene | EHD4 | chr15:41750074 | chr15:42246138 | ENST00000220325 | 0 | 6 | 492_503 | 78.66666666666667 | 542.0 | Calcium binding | Ontology_term=ECO:0000250,ECO:0000255 | |
| Tgene | EHD4 | chr15:41750074 | chr15:42246138 | ENST00000220325 | 0 | 6 | 447_535 | 78.66666666666667 | 542.0 | Domain | EH | |
| Tgene | EHD4 | chr15:41750074 | chr15:42246138 | ENST00000220325 | 0 | 6 | 479_514 | 78.66666666666667 | 542.0 | Domain | EF-hand | |
| Tgene | EHD4 | chr15:41750074 | chr15:42246138 | ENST00000220325 | 0 | 6 | 156_159 | 78.66666666666667 | 542.0 | Region | G3 motif | |
| Tgene | EHD4 | chr15:41750074 | chr15:42246138 | ENST00000220325 | 0 | 6 | 222_225 | 78.66666666666667 | 542.0 | Region | G4 motif | |
| Tgene | EHD4 | chr15:41750074 | chr15:42246138 | ENST00000220325 | 0 | 6 | 246_246 | 78.66666666666667 | 542.0 | Region | G5 motif | |
| Tgene | EHD4 | chr15:41750074 | chr15:42246138 | ENST00000220325 | 0 | 6 | 94_95 | 78.66666666666667 | 542.0 | Region | G2 motif |
| - Not-retained protein feature among the 13 regional features. |
| Partner | Gene | Hbp | Tbp | ENST | Strand | BPexon | TotalExon | Protein feature loci | *BPloci | TotalLen | Protein feature | Protein feature note |
| Hgene | RTF1 | chr15:41750074 | chr15:42246138 | ENST00000389629 | + | 4 | 18 | 526_560 | 220.66666666666666 | 711.0 | Coiled coil | Ontology_term=ECO:0000255 |
| Hgene | RTF1 | chr15:41750074 | chr15:42246138 | ENST00000389629 | + | 4 | 18 | 174_345 | 220.66666666666666 | 711.0 | Compositional bias | Note=Glu-rich |
| Hgene | RTF1 | chr15:41750074 | chr15:42246138 | ENST00000389629 | + | 4 | 18 | 214_307 | 220.66666666666666 | 711.0 | Compositional bias | Note=Lys-rich |
| Hgene | RTF1 | chr15:41750074 | chr15:42246138 | ENST00000389629 | + | 4 | 18 | 353_484 | 220.66666666666666 | 711.0 | Domain | Plus3 |
| Tgene | EHD4 | chr15:41750074 | chr15:42246138 | ENST00000220325 | 0 | 6 | 58_289 | 78.66666666666667 | 542.0 | Domain | Dynamin-type G | |
| Tgene | EHD4 | chr15:41750074 | chr15:42246138 | ENST00000220325 | 0 | 6 | 68_75 | 78.66666666666667 | 542.0 | Region | G1 motif |
Top |
Fusion Protein Structures |
| PDB and CIF files of the predicted fusion proteins * Here we show the 3D structure of the fusion proteins using Mol*. AlphaFold produces a per-residue confidence score (pLDDT) between 0 and 100. Model confidence is shown from the pLDDT values per residue. pLDDT corresponds to the model’s prediction of its score on the local Distance Difference Test. It is a measure of local accuracy (from AlphfaFold website). To color code individual residues, we transformed individual PDB files into CIF format. |
| Fusion protein PDB link (fusion AA seq ID in FusionPDB) | Hgene | Hchr | Hbp | Hstrand | Tgene | Tchr | Tbp | Tstrand | AA seq | Len(AA seq) |
| PDB file >>>1404_RTF1_41750074_EHD4_42246138_ranked_0.pdb | RTF1 | 41750074 | 41750074 | ENST00000220325 | EHD4 | chr15 | 42246138 | - | MRGRLCVGRAAAAAAAVAVPLAGGQEGSPGGGRRGSRGTTMVKKRKGRVVIDSDTEDSGSDENLDQELLSLAKRKRSDSEEKEPPVSQPA ASSDSETSDSDDEWTFGSNKNKKKGKARKIEKKGTMKKQANKTASSGSSDKDSSAESSAPEEGEVSDSDSNSSSSSSDSDSSSEDEEFHD GYGEDLMGDEEDRARLEQMTEKEREQELFNRIEKREVLKRRYLLEQDFPGMRIGPEPTTDSFIAVMYGETEGSTPGNALVVDPKKPFRKL SRFGNAFLNRFMCSQLPNQVLKSISVIDSPGILSGEKQRISRGYDFCQVLQWFAERVDRIILLFDAHKLDISDEFSEAIKAFRGQDDKIR VVLNKADQVDTQQLMRVYGALMWSLGKVINTPEVLRVYIGSFWAQPLQNTDNRRLFEAEAQDLFRDIQSLPQKAAVRKLNDLIKRARLAK VHAYIISYLKKEMPSVFGKENKKRELISRLPEIYIQLQREYQISAGDFPEVKAMQEQLENYDFTKFHSLKPKLIEAVDNMLSNKISPLMN LISQEETSTPTQLVQGGAFDGTTEGPFNQGYGEGAKEGADEEEWVVAKDKPVYDELFYTLSPINGKISGVNAKKEMVTSKLPNSVLGKIW | 683 |
Top |
pLDDT score distribution |
| pLDDT score distribution of the predicted wild-type structures of two partner proteins from AlphaFold2 * AlphaFold produces a per-residue confidence score (pLDDT) between 0 and 100. |
RTF1_pLDDT.png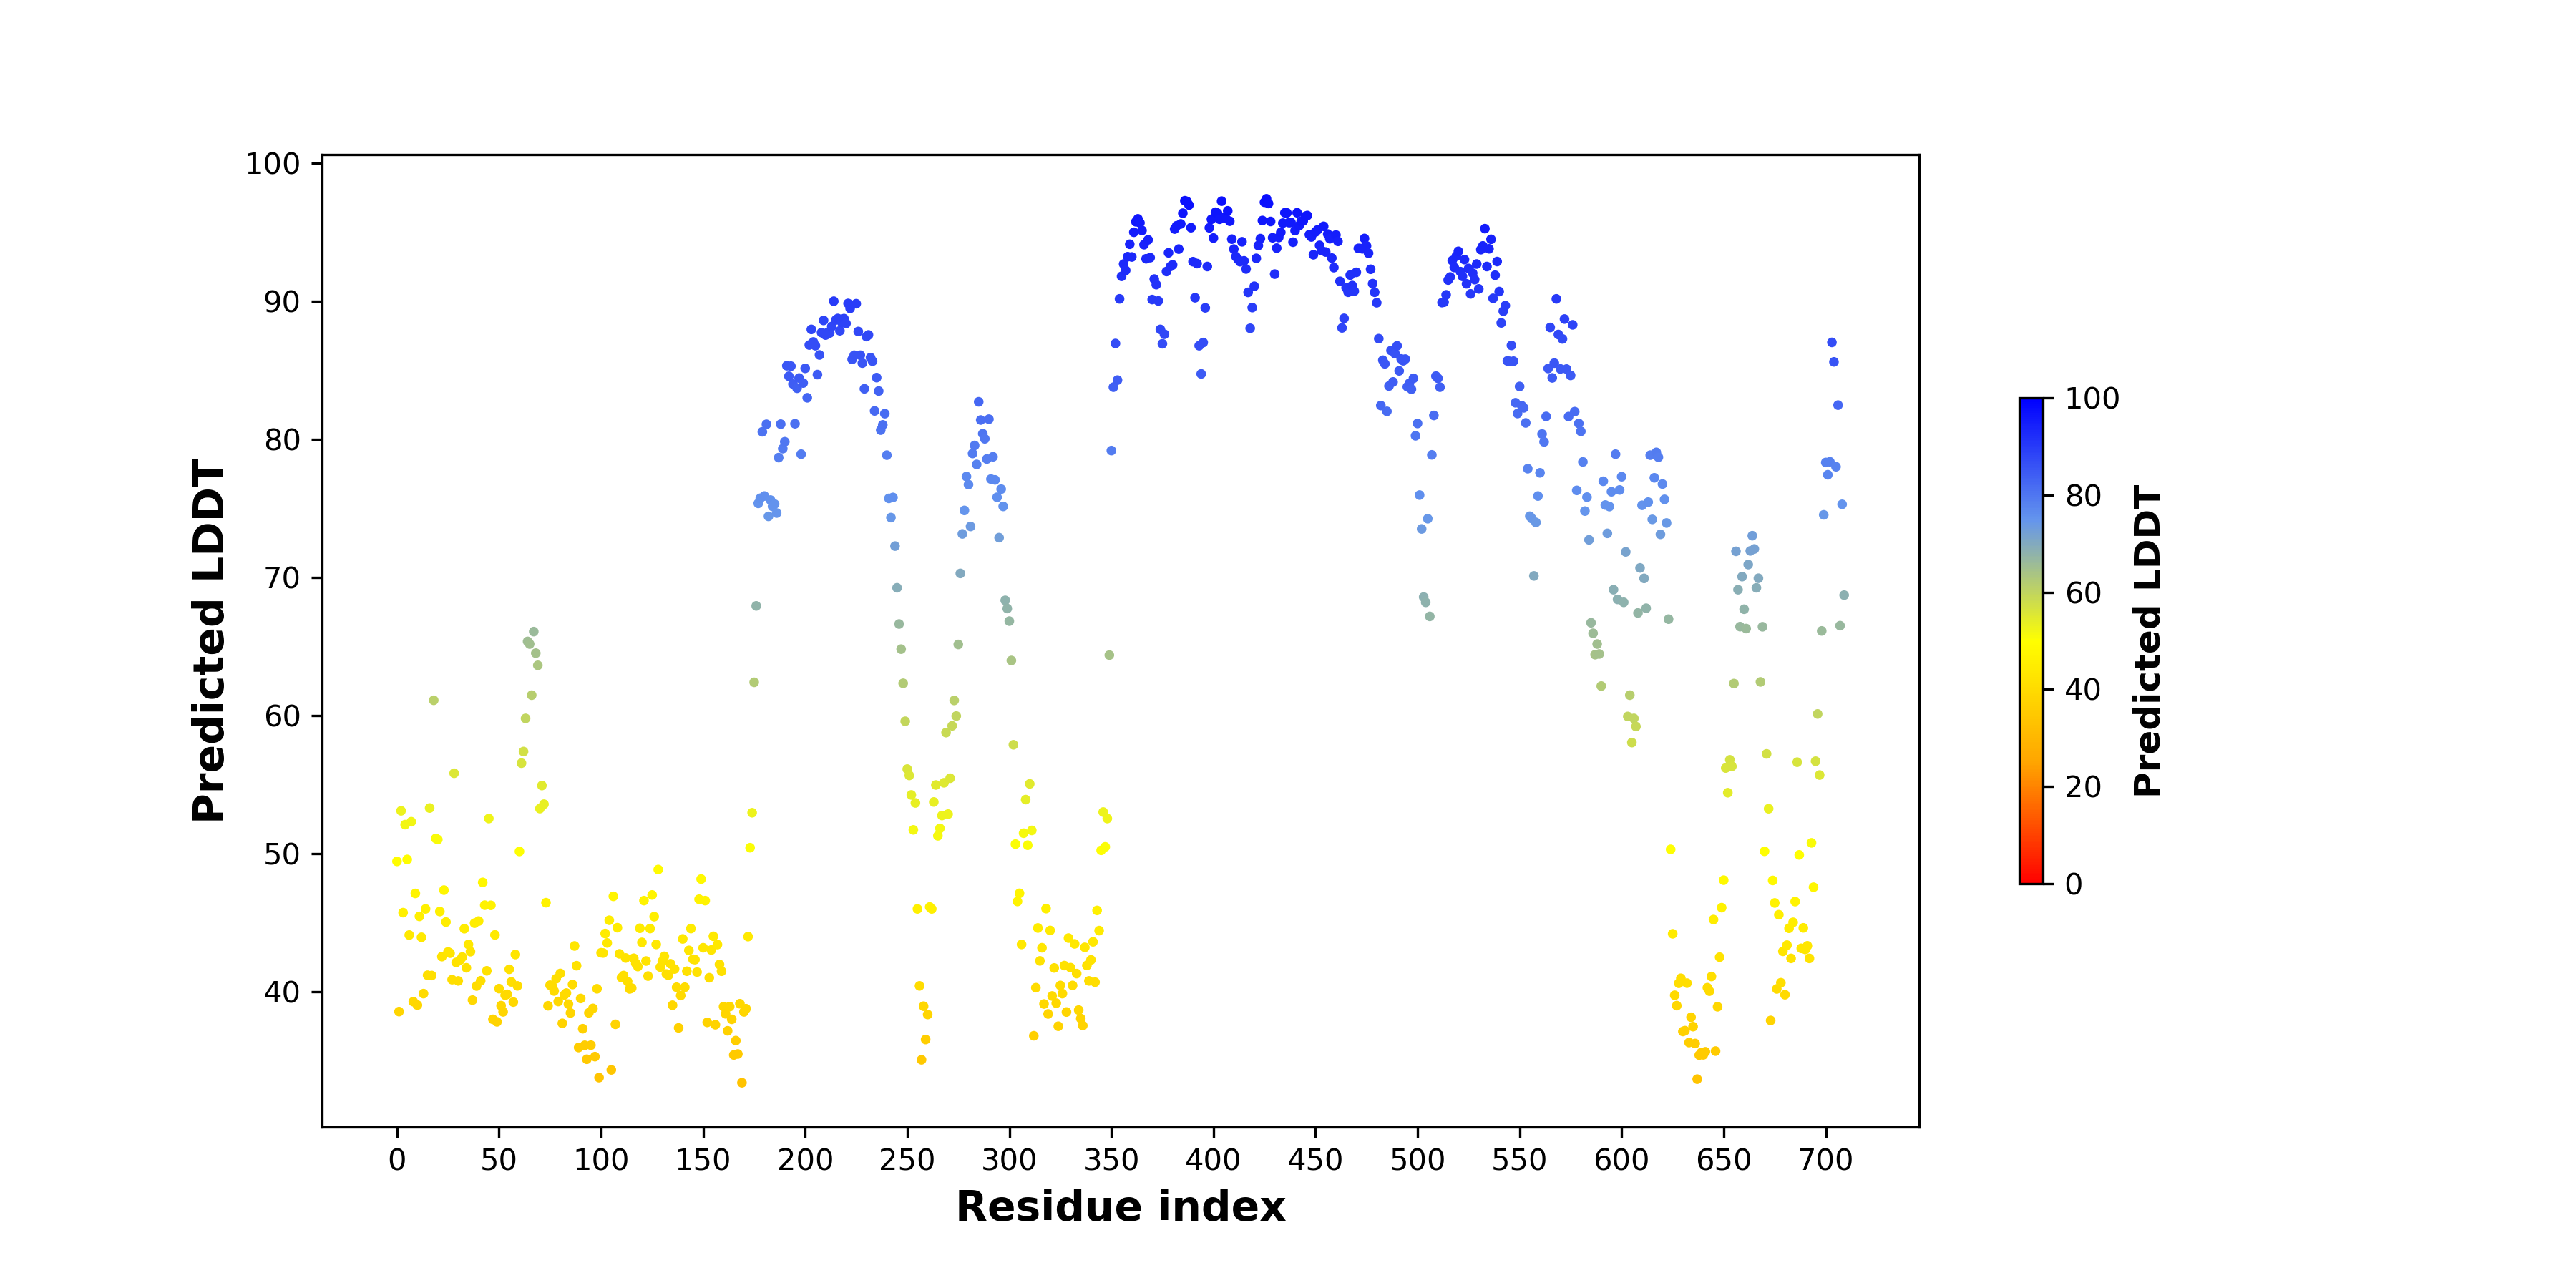  |
EHD4_pLDDT.png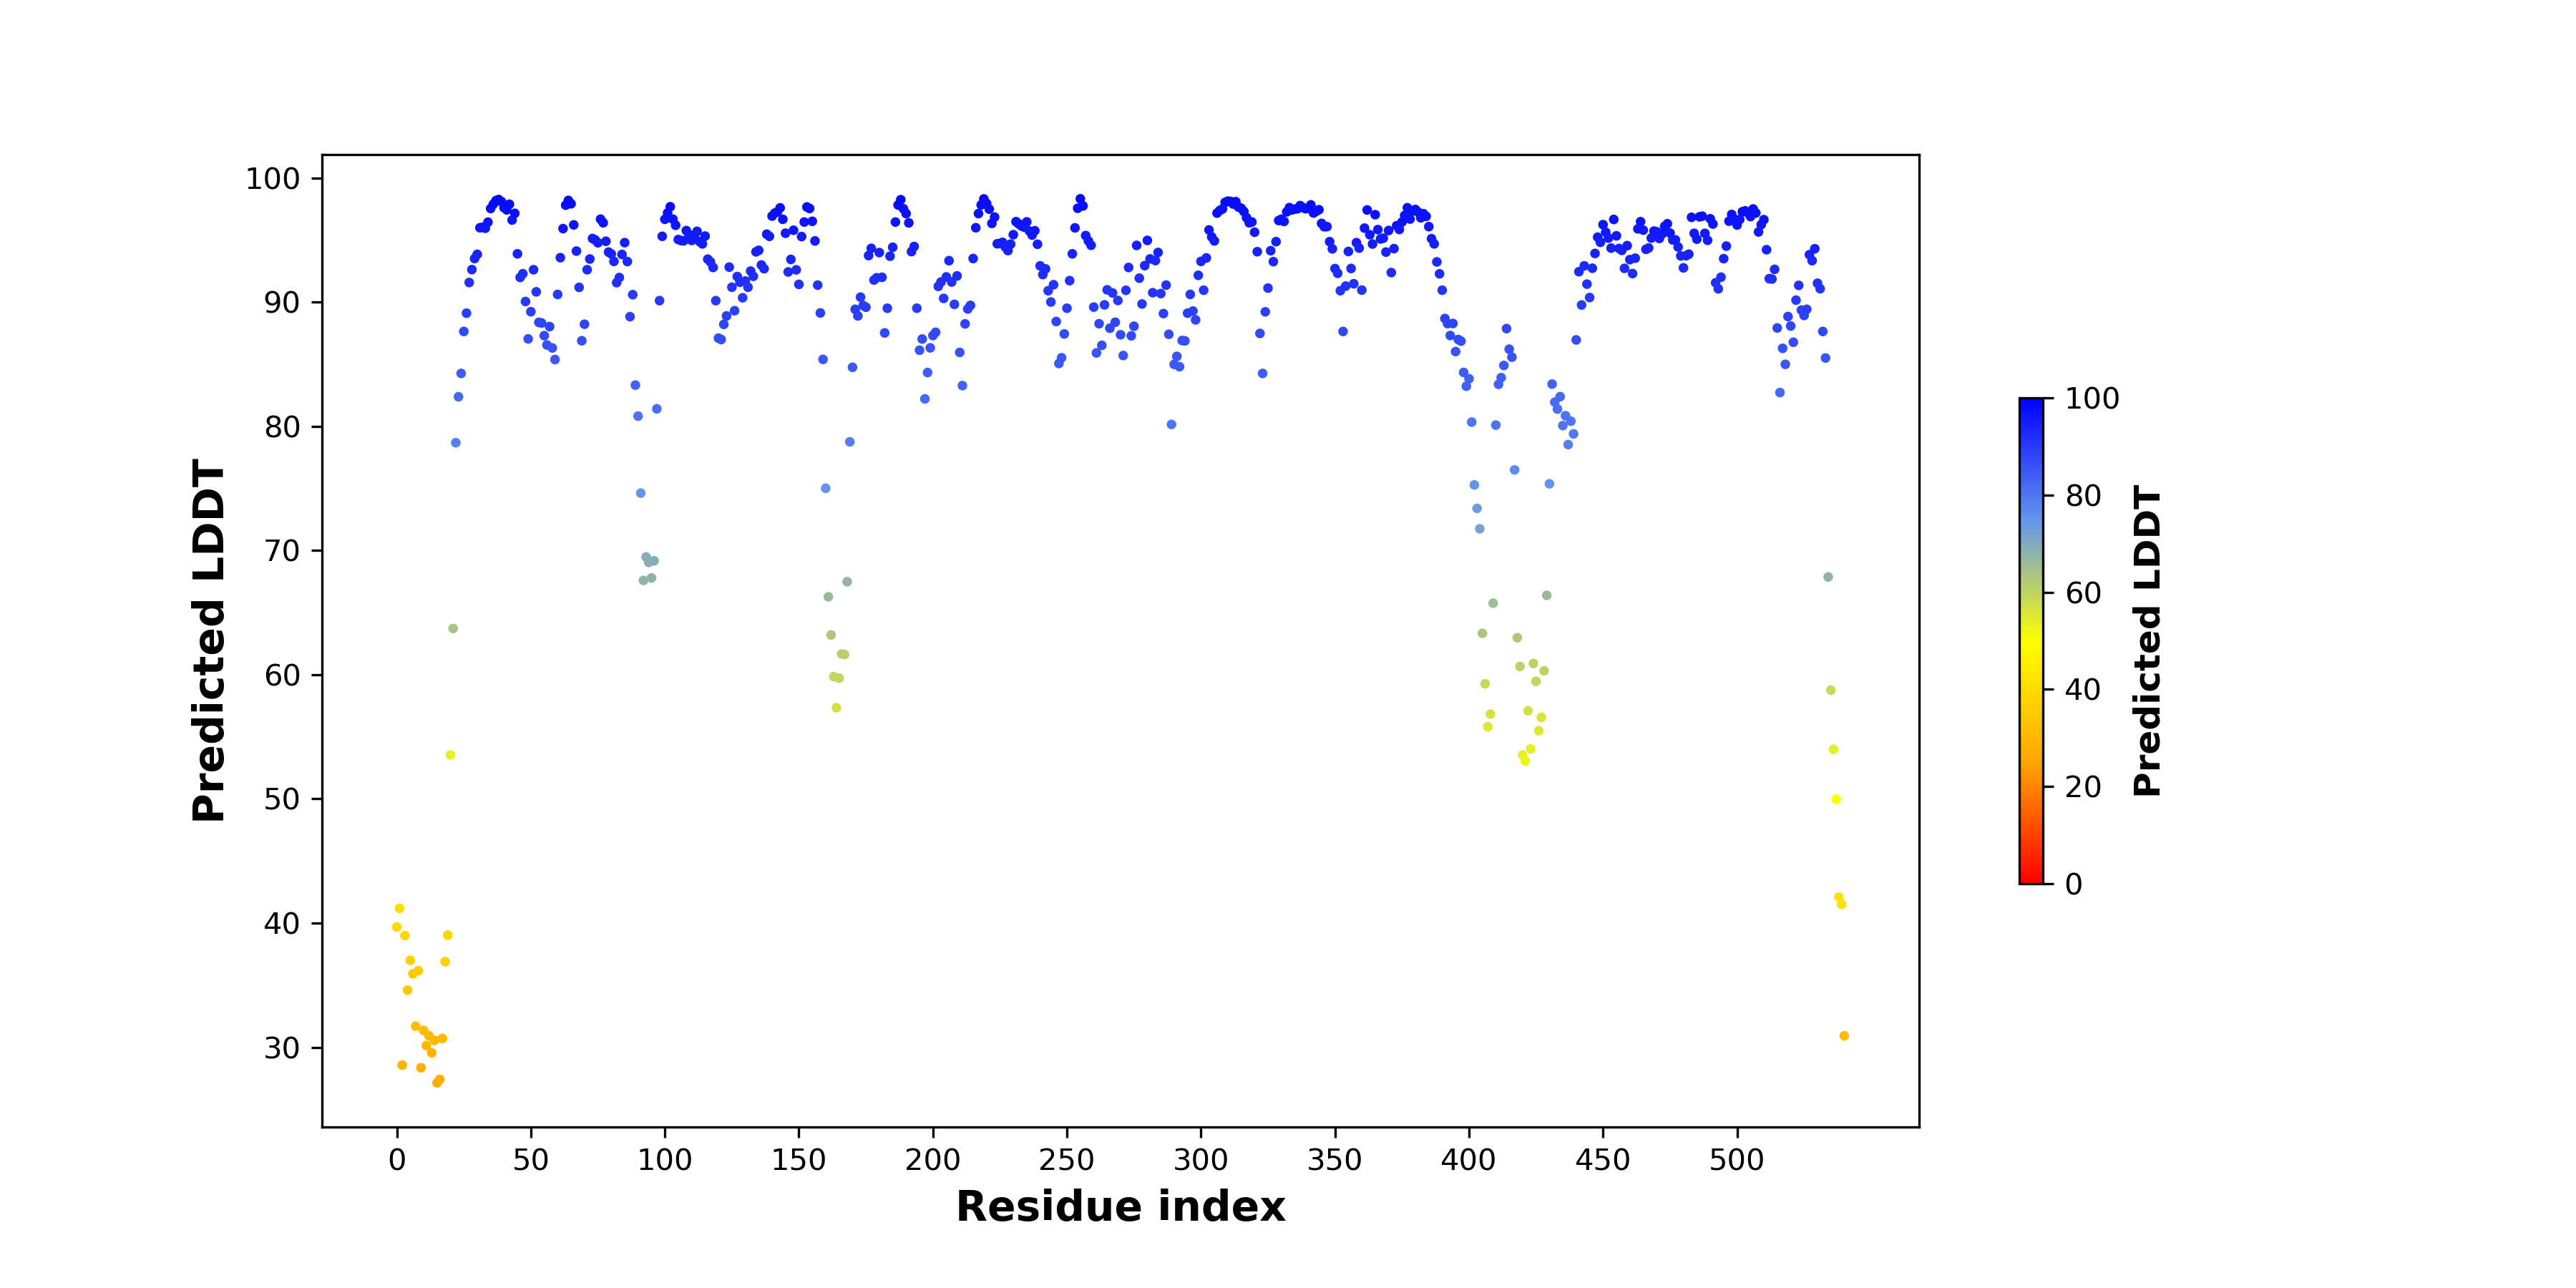  |
| pLDDT score distribution of the predicted fusion protein structures from AlphaFold2 * AlphaFold produces a per-residue confidence score (pLDDT) between 0 and 100. |
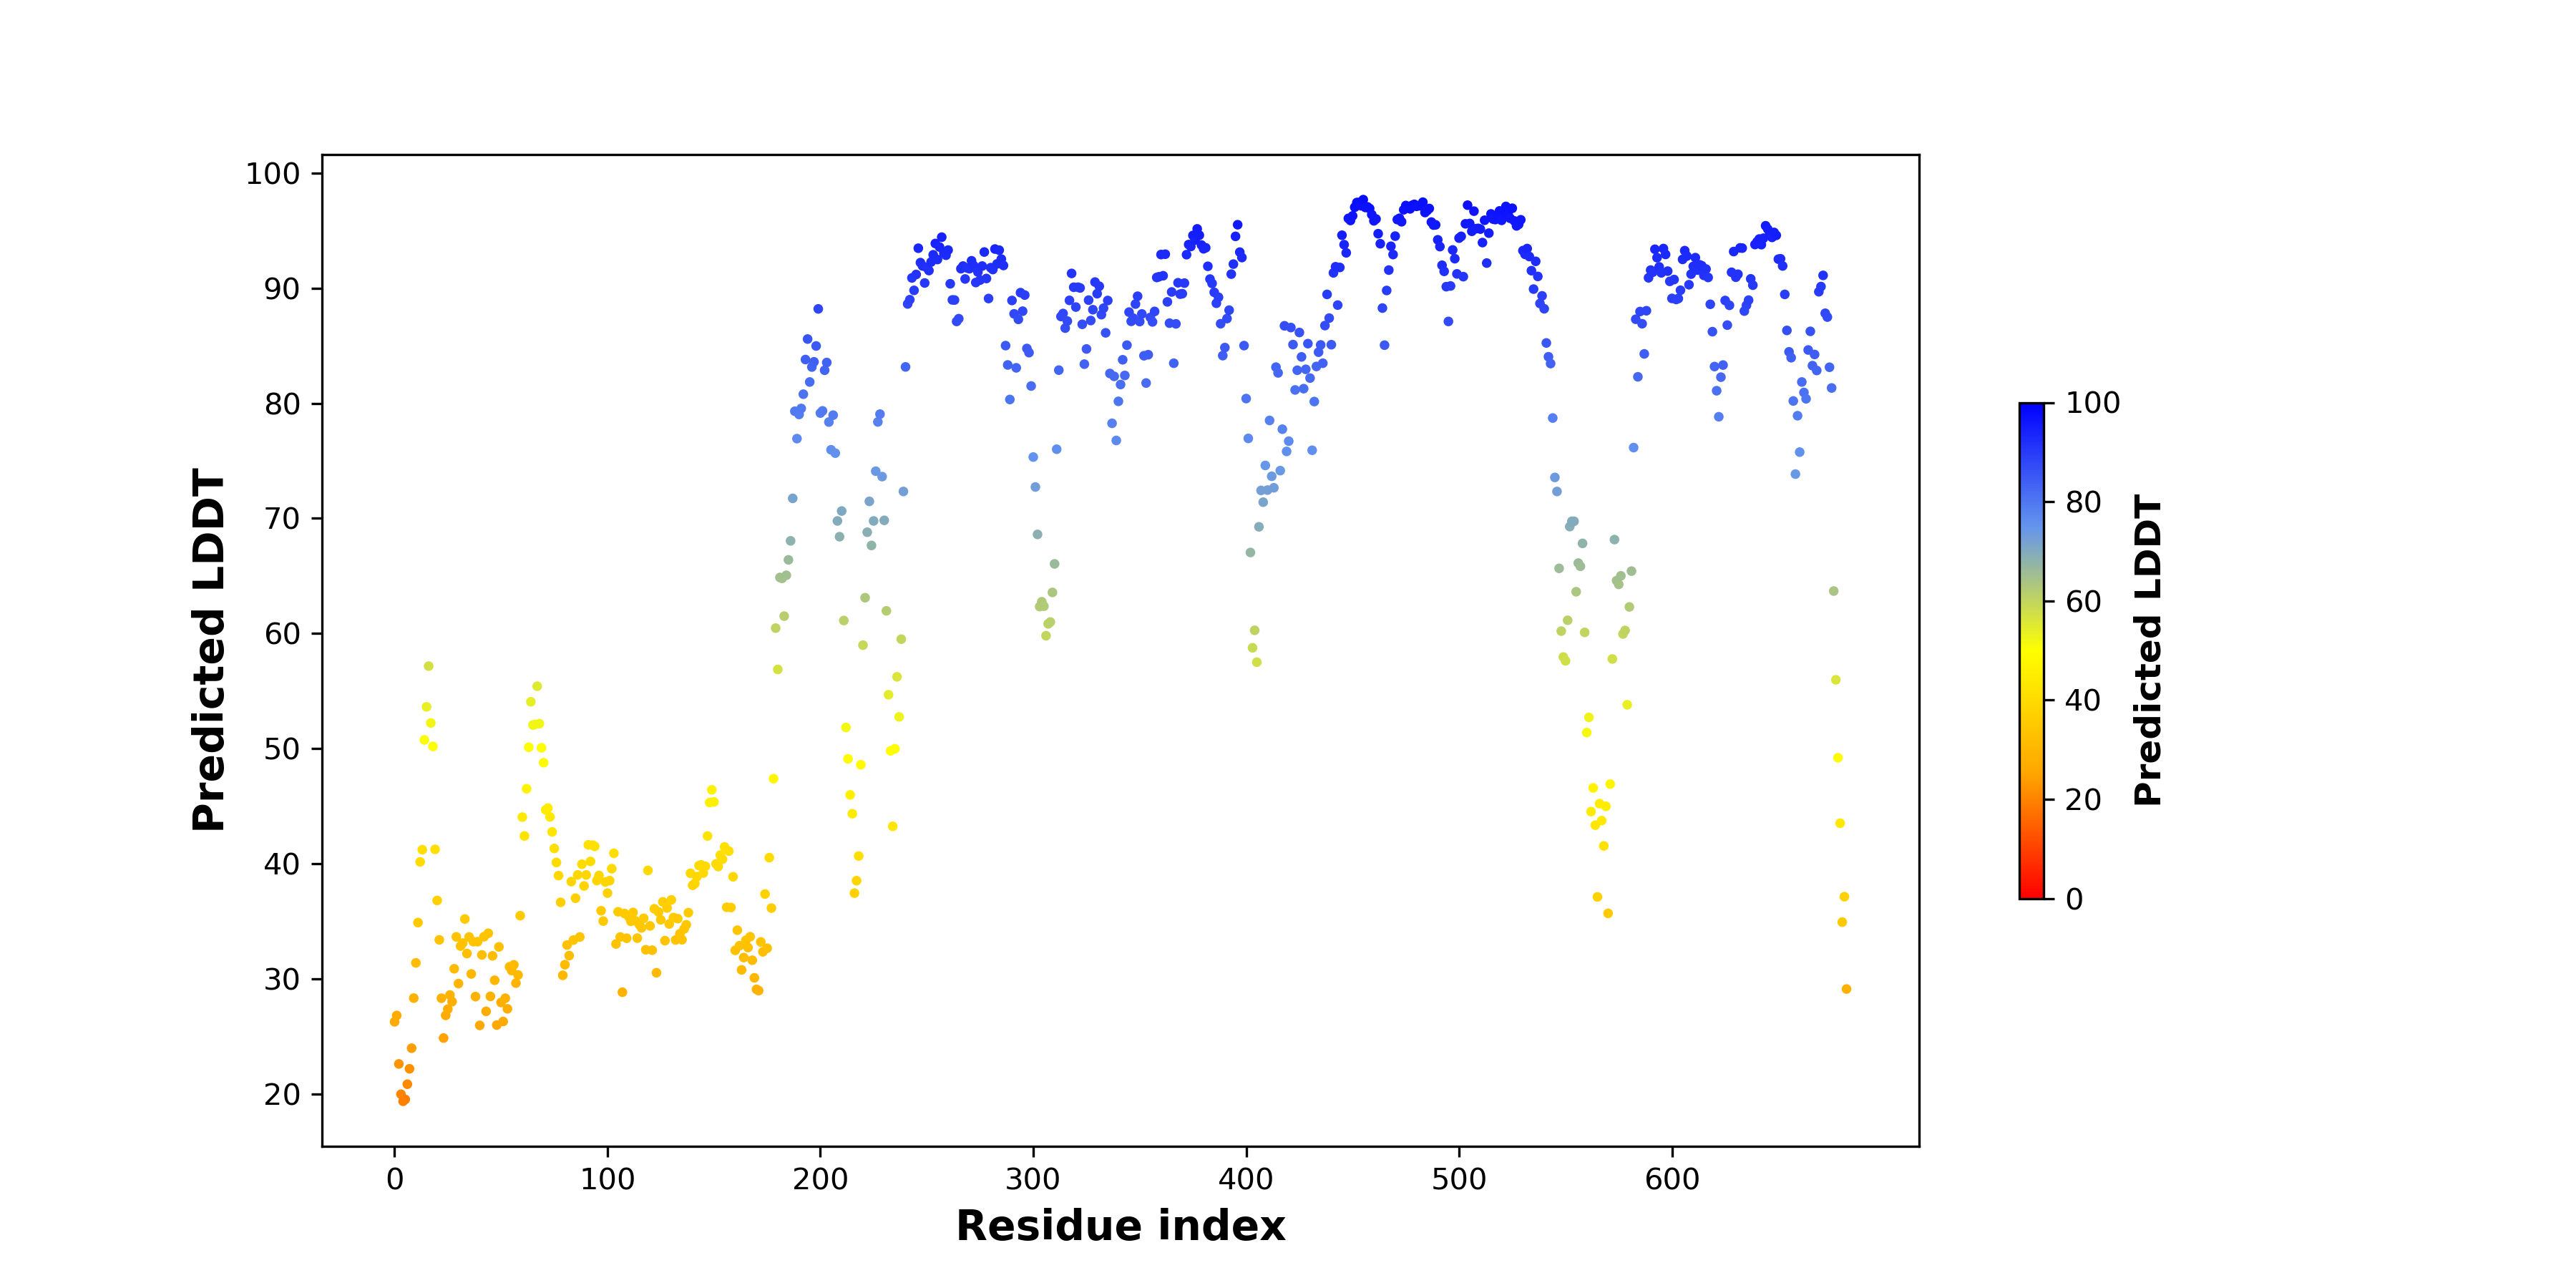 |
Top |
Ramachandran Plot of Fusion Protein Structure |
| Ramachandran plot of the torsional angles - phi (φ)and psi (ψ) - of the residues (amino acids) contained in this fusion protein peptide. |
| Fusion AA seq ID in FusionPDB and their Ramachandran plots |
Top |
Fusion Protein-Protein Interaction |
| Go to ChiPPI (Chimeric Protein-Protein interactions) to see the chimeric PPI interaction in |
| Protein-protein interactors with each fusion partner protein in wild-type from validated records (BIOGRID-3.4.160) |
| Gene | PPI interactors |
| Protein-protein interactors based on sequence similarity (STRING) |
| Gene | STRING network |
| RTF1 | |
| EHD4 |
| - Retained interactions in fusion protein (protein functional feature from UniProt). |
| Partner | Gene | Hbp | Tbp | ENST | Strand | BPexon | TotalExon | Protein feature loci | *BPloci | TotalLen | Still interaction with |
| - Lost interactions due to fusion (protein functional feature from UniProt). |
| Partner | Gene | Hbp | Tbp | ENST | Strand | BPexon | TotalExon | Protein feature loci | *BPloci | TotalLen | Interaction lost with |
Top |
Related Drugs to RTF1-EHD4 |
| Drugs used for this fusion-positive patient. (Manual curation of PubMed, 04-30-2022 + MyCancerGenome) |
| Hgene | Tgene | Drug | Source | PMID |
Top |
Related Diseases to RTF1-EHD4 |
| Diseases that have this fusion gene. (Manual curation of PubMed, 04-30-2022 + MyCancerGenome) |
| Hgene | Tgene | Disease | Source | PMID |
| Diseases associated with fusion partners. (DisGeNet 4.0) |
| Partner | Gene | Disease ID | Disease name | # pubmeds | Source |
(UTHealth)
Web File Viewing | Emergency Information |Campus Carry|Site Policies