
|
||||||
|

Translation Factor: EIF1B (NCBI Gene ID:10289) |
|
 Gene Summary Gene Summary |
| Gene Information | Gene Name: EIF1B | Gene ID: 10289 | Gene Symbol | EIF1B | Gene ID | 10289 |
| Gene Name | eukaryotic translation initiation factor 1B | |
| Synonyms | GC20 | |
| Cytomap | 3p22.1 | |
| Type of Gene | protein-coding | |
| Description | eukaryotic translation initiation factor 1bprotein translation factor SUI1 homolog GC20translation factor sui1 homolog | |
| Modification date | 20200313 | |
| UniProtAcc | O60739 | |
| Child GO biological process term(s) under GO:0006412 |
| GO ID | GO term |
| GO:0006417 | Regulation of translation |
| GO:0008135 | Translation factor activity, RNA binding |
| GO:0006413 | Translational initiation |
| GO:0006412 | Translation |
| Gene ontology of translaction factor with evidence of Inferred from Direct Assay (IDA) from Entrez |
| Partner | Gene | GO ID | GO term | PubMed ID |
| Inferred gene age of translation factor. |
| Gene | Inferred gene age group among (0 - 67.6], (67.6 - 355.7], (355.7 - 733], (733 - 1119.25], >1119.25 |
| EIF1B | >1119.25 |
Top |
|
| We searched PubMed using 'EIF1B[title] AND translation [title] AND human.' |
| Gene | Title | PMID |
| EIF1B | . | . |
Top |
|
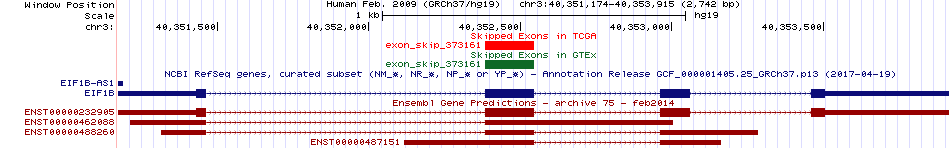
| Skipped exons in TCGA and GTEx based on Ensembl gene isoform structure. * Click on the image to open the UCSC genome browser with custom track showing this image in a new window. For more annotations, please visit our ExonSkipDB. |
 |
| Open reading frame (ORF) analsis of exon skipping events based on Ensembl gene isoform structure. * Click on the break point to see the gene structure around the break point region using the UCSC Genome Browser. |
| ENST | Exon skip start (DNA) | Exon Skip end (DNA) | ORF |
| Exon skipping position in the amino acid sequence. |
| ENST | Exon skip start (DNA) | Exon Skip end (DNA) | Len(transcript seq) | Exon skip start (mRNA) | Exon Skip end (mRNA) | Len(amino acid seq) | Exon skip start (AA) | Exon Skip end (AA) |
| Potentially (partially) lost protein functional features of UniProt. |
| UniProtAcc | Exon skip start (AA) | Exon Skip end (AA) | Function feature start (AA) | Function feature end (AA) | Functional feature type | Functional feature desc. |
Top |
|
| Gene expression level across TCGA pancancer |
 |
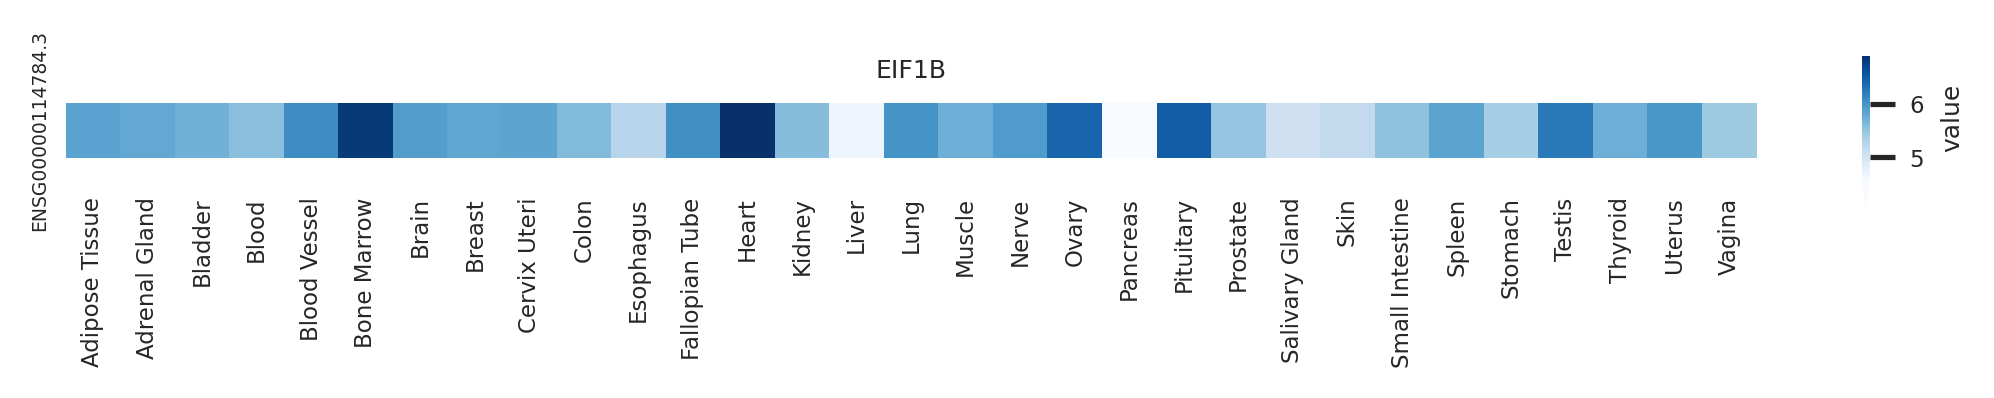
| Gene expression level across GTEx pantissue |
 |
| Expression level of gene isoforms across TCGA pancancer |
 |
| Expression level of gene isoforms across GTEx pantissue |
 |
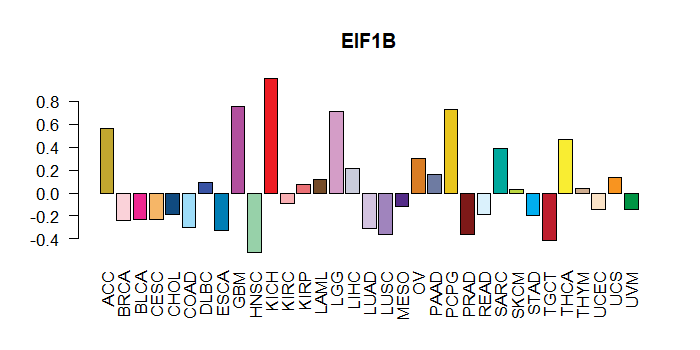
| Cancer(tissue) type-specific expression level of Translation factor using z-score distriution |
 |
| Differential expression between tumor and matched normal (in the cancer types with more than 10 matched samples) |
 |
| Cancer type | Translation factor | FC | adj.pval |
| LIHC | EIF1B | -1.52296643222607 | 0.00467797572102414 |
| HNSC | EIF1B | 1.29022554527937 | 0.00540290265007571 |
| UCEC | EIF1B | -5.93208681724707 | 0.046875 |
Top |
|
| Translation factor expression regulation through miRNA binding |
| Cancer type | Gene | miRNA | TargetScan binding score (Context++ score percentile) | Coefficient | Pvalue |
| Translation factor expression regulation through methylation in the promoter of Translation factor |
 |
| Cancer type | Gene | methyl group b | methyl group a | DEG pval | avg methyl in b | avg methyl in a | avg exp in b | avg exp in a |
| Translation factor expression regulation through methylation in the gene body of Translation factor (positive regulation) |
 |
| Cancer type | Gene | methyl group b | methyl group a | DEG pval | avg methyl in b | avg methyl in a | avg exp in b | avg exp in a |
| Translation factor expression regulation through copy number variation of Translation factor |
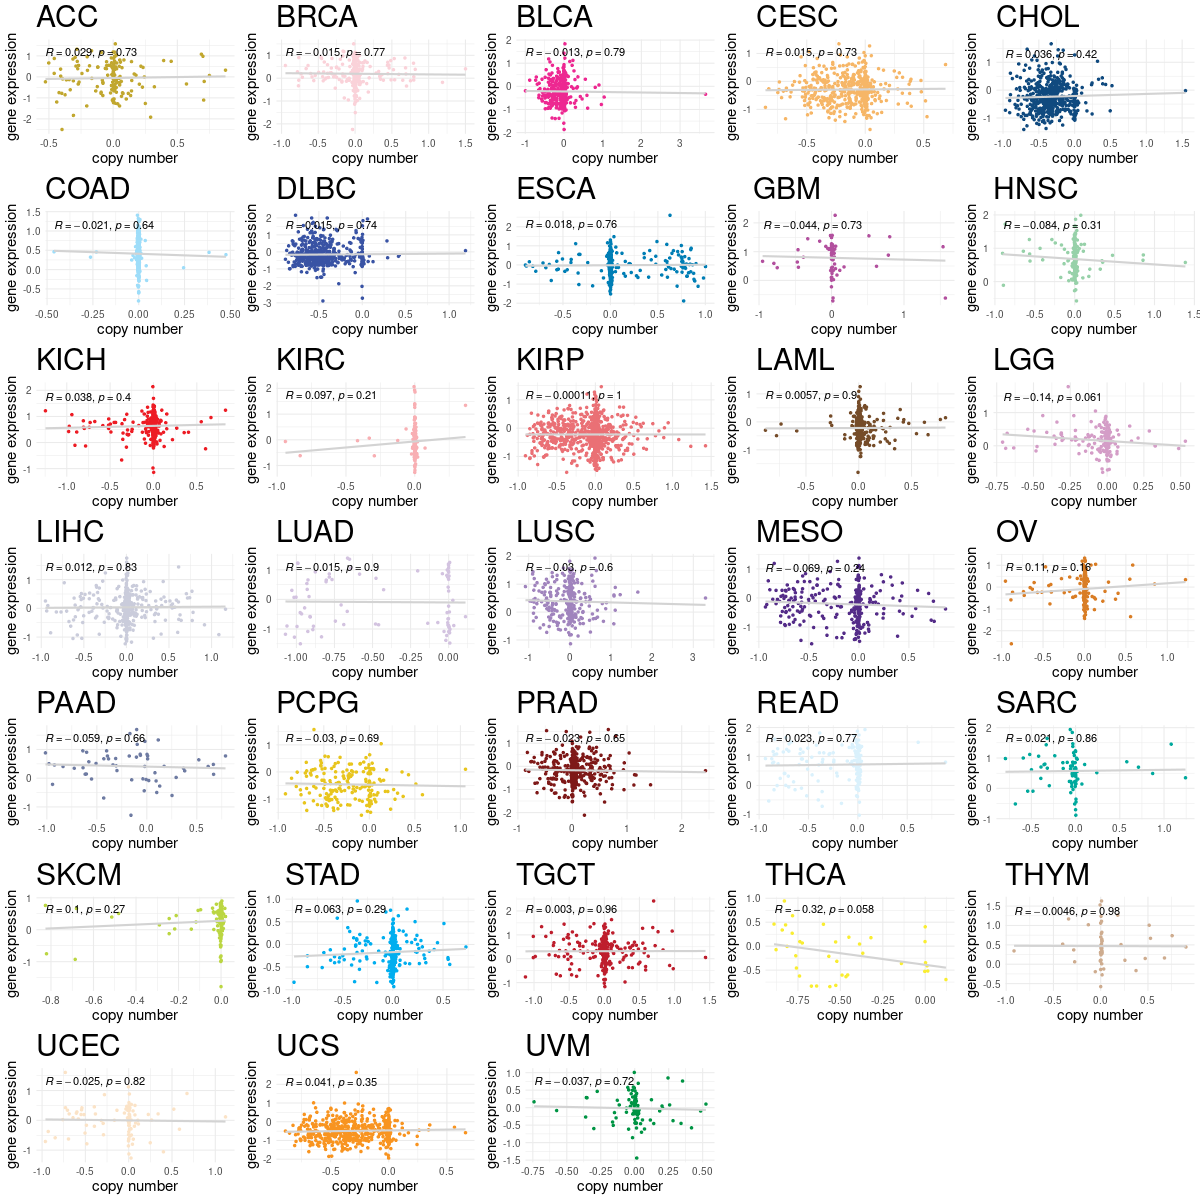 |
| Cancer type | Gene | Coefficient | Pvalue |
Top |
|
| Strongly correlated genes belong to cellular important gene groups with EIF1B (coefficient>0.8, pval<0.05, node color based on FC between tumor and matched normal). Significantly associated important genes in the individual cancer types. * Cell metabolism gene: cell metabolism genes from REACTOME (black edge), IUPHAR: drug target genes from IUPHAR (blue edge), Kinase: human kinase genes (brown edge), CGC: cancer gene census genes (orange edge), TSG: tumor suppresor genes (purple edge), Epifactor: epigenetic factors (light blue edge), TF: transcription factors (green) |
 |
| Cancer type | Gene group | Translation factor | Correlated gene | Coefficient | Pvalue |
| UVM | Cell metabolism gene | EIF1B | CHCHD4 | 0.810836869 | 7.88E-20 |
| UVM | Cell metabolism gene | EIF1B | NMNAT3 | 0.827232274 | 3.20E-21 |
| UVM | Cell metabolism gene | EIF1B | LTA4H | 0.831659181 | 1.27E-21 |
| UVM | Cell metabolism gene | EIF1B | PIK3R4 | 0.841382228 | 1.52E-22 |
| UVM | CGC | EIF1B | RAF1 | 0.925701022 | 1.13E-34 |
| UVM | Epifactor | EIF1B | UBE2E1 | 0.8042742 | 2.61E-19 |
| UVM | Epifactor | EIF1B | WDR82 | 0.806963665 | 1.61E-19 |
| UVM | Epifactor | EIF1B | SATB1 | 0.840196167 | 1.98E-22 |
| UVM | IUPHAR | EIF1B | ATP2C1 | 0.803913803 | 2.78E-19 |
| UVM | IUPHAR | EIF1B | LTA4H | 0.831659181 | 1.27E-21 |
| UVM | IUPHAR | EIF1B | OGG1 | 0.832343423 | 1.10E-21 |
| UVM | IUPHAR | EIF1B | PIK3R4 | 0.841382228 | 1.52E-22 |
| UVM | IUPHAR | EIF1B | NEK11 | 0.843169107 | 1.01E-22 |
| UVM | IUPHAR | EIF1B | SLC25A26 | 0.872037909 | 6.44E-26 |
| UVM | IUPHAR | EIF1B | RAF1 | 0.925701022 | 1.13E-34 |
| UVM | Kinase | EIF1B | PIK3R4 | 0.841382228 | 1.52E-22 |
| UVM | Kinase | EIF1B | NEK11 | 0.843169107 | 1.01E-22 |
| UVM | Kinase | EIF1B | RAF1 | 0.925701022 | 1.13E-34 |
| UVM | TF | EIF1B | ZXDC | 0.804837401 | 2.36E-19 |
| UVM | TF | EIF1B | ZNF391 | 0.812248107 | 6.06E-20 |
| UVM | TF | EIF1B | ZNF415 | 0.829319167 | 2.08E-21 |
| UVM | TF | EIF1B | NFIA | 0.829393538 | 2.05E-21 |
| UVM | TF | EIF1B | SATB1 | 0.840196167 | 1.98E-22 |
| UVM | TF | EIF1B | ZNF667 | 0.842817583 | 1.10E-22 |
| UVM | TF | EIF1B | ZNF835 | 0.882471624 | 2.87E-27 |
| UVM | TSG | EIF1B | RAB7A | 0.804377352 | 2.56E-19 |
| UVM | TSG | EIF1B | MTUS1 | 0.887042017 | 6.67E-28 |
Top |
|
| Protein 3D structure Visit iCn3D. |
Top |
|
| Protein-protein interaction networks * Overlap between up-regulated DEGs (log2FC<-1 and adj.P<0.05) and STRING PPI network (center: Translation factor, node: DEGs, edges: weighted by -log2(adj.P)) |
 |
| Overlap between down-regulated DEGs (log2FC>1 and adj.P<0.05) and STRING PPI network (center: Translation factor, node: DEGs, edges: weighted by -log2(adj.P)) |
 |
 * Edge colors based on TCGA cancer types. |
| * Overlap between DEGs (log2FC>1 and adj.P<0.05) and STRING PPI network per cancer (center: Translation factor, node: DEGs, node color: log2FC, edges: weighted by -log2(adj.P)) |
 |
| Cancer type | Translation factor | Interacting protein coding gene | FC | adj.pval |
| KICH | EIF1B | EIF3I | 1.57310069220802 | 0.000139892101287842 |
| LUAD | EIF1B | EIF3CL | -2.13616202681733 | 0.000327584192623451 |
| PRAD | EIF1B | EIF3A | 1.13680328391952 | 0.000363360004697762 |
| LIHC | EIF1B | EIF3C | -1.23074521883972 | 0.00126327311470459 |
| BRCA | EIF1B | EIF3I | -1.72233459275531 | 0.00191218761269043 |
| LUAD | EIF1B | EIF3J | -1.1109238877878 | 0.00216965225011196 |
| KICH | EIF1B | EIF2S2 | -1.06278646532411 | 0.00308787822723389 |
| KIRP | EIF1B | EIF3G | -2.4178322962129 | 0.00471024587750435 |
| BLCA | EIF1B | EIF3A | -4.45104058307747 | 0.00532913208007812 |
| LUSC | EIF1B | EIF3CL | -1.65891070592699 | 0.00704157337736851 |
| BRCA | EIF1B | EIF3CL | -1.45129115344564 | 0.0202464785451748 |
| HNSC | EIF1B | EIF3CL | -1.69346209598213 | 0.028266192551655 |
| UCEC | EIF1B | EIF3G | -3.35078334696571 | 0.03125 |
| BLCA | EIF1B | EIF3G | -3.07707559649091 | 0.0323410034179688 |
| LUAD | EIF1B | EIF3B | -5.80435587546762 | 1.0542655358657e-09 |
| THCA | EIF1B | EIF3J | 1.32428508175103 | 1.19078203681914e-07 |
| BRCA | EIF1B | EIF2S2 | -2.57303037687825 | 1.70212120584918e-09 |
| BRCA | EIF1B | EIF3G | 1.87948385011271 | 1.9107949115022e-06 |
| KIRC | EIF1B | EIF3B | -1.56313263784517 | 2.35252849767166e-12 |
| STAD | EIF1B | EIF2S2 | -2.13186277769467 | 3.17529775202275e-05 |
| KICH | EIF1B | EIF3J | 2.09716749126717 | 3.19480895996094e-05 |
| STAD | EIF1B | EIF3B | -4.7724660972007 | 3.25962901115418e-08 |
| HNSC | EIF1B | EIF3B | 2.6202554263604 | 4.48234413852334e-06 |
| KIRP | EIF1B | EIF3B | -2.7592297042974 | 4.6566128730774e-09 |
| BRCA | EIF1B | EIF3A | -1.218215573148 | 7.39403582934137e-06 |
| KIRP | EIF1B | EIF1AX | 1.69033449545845 | 9.99853946268559e-05 |
| Protein-protein interactors with this translation factor (BIOGRID-3.4.160) |
| PPI interactors with EIF1B |
| EIF3A, EIF3L, EIF3M, EIF3F, EIF3D, EIF3E, ACTR3, RPS11, EIF2S3, RPS3A, EIF3H, RPS9, EIF3I, RPA3, HPRT1, RPS29, YARS, SHMT2, TAGLN2, EIF3K, ERH, PCMT1, TCEB1, EIF3G, EIF2S1, TSR1, MYL12A, ACAT1, RAB7A, ELAVL1, EIF2D, ATXN1, PEX19, TRIM38, DHX9, TJP2, DVL2, TNIP2, LARP7, ATG16L1, SPG21, DVL3, CHMP4C, FZR1, GRSF1, EEF1A2, POTEI, |
Top |
|
| Clinically associated variants from ClinVar. |
| Gene | Chr | Position | RefSeq | VarSeq | RefSeeq | VarType | Pathogenic | Disease | VarInfo |
| nsSNVs with sample frequency (size of circle) from TCGA 33 cancers. |
 |
| SNVs and Indels |
| Gene | Cancer type | Chromosome | Start | End | RefSeeq | MutSeq | Mutation type | AAchange | # samples |
| EIF1B | LIHC | chr3 | 40352421 | 40352421 | C | - | Frame_Shift_Del | p.L23fs | 3 |
| EIF1B | LIHC | chr3 | 40353035 | 40353035 | A | - | Frame_Shift_Del | p.R90fs | 3 |
| EIF1B | UVM | chr3 | 40352412 | 40352412 | C | G | Missense_Mutation | p.D20E | 3 |
| EIF1B | LIHC | chr3 | 40351444 | 40351444 | C | - | Frame_Shift_Del | p.I4fs | 2 |
| EIF1B | UCEC | chr3 | 40352547 | 40352547 | G | T | Missense_Mutation | p.K65N | 2 |
| EIF1B | UVM | chr3 | 40352412 | 40352412 | C | G | Missense_Mutation | 2 | |
| EIF1B | LIHC | chr3 | 40352428 | 40352428 | G | - | Frame_Shift_Del | p.G26fs | 2 |
| EIF1B | LUAD | chr3 | 40352459 | 40352459 | A | T | Missense_Mutation | p.Q36L | 2 |
| EIF1B | UVM | chr3 | 40353009 | 40353010 | - | T | Frame_Shift_Ins | p.V82fs | 2 |
| EIF1B | LUAD | chr3 | 40352529 | 40352529 | T | A | Silent | p.L59L | 2 |
| EIF1B | BLCA | chr3 | 40352532 | 40352532 | G | A | Silent | p.V60V | 2 |
| EIF1B | UVM | chr3 | 40353009 | 40353010 | - | - | Frame_Shift_Ins | 1 | |
| EIF1B | BLCA | chr3 | 40352532 | 40352532 | G | A | Silent | 1 | |
| EIF1B | BLCA | chr3 | 40352498 | 40352498 | G | A | Missense_Mutation | 1 | |
| EIF1B | UVM | chr3 | 40353009 | 40353010 | - | T | Frame_Shift_Ins | p.Y82fs | 1 |
| EIF1B | LUAD | chr3 | 40352406 | 40352406 | G | C | Missense_Mutation | p.K18N | 1 |
| EIF1B | BLCA | chr3 | 40352498 | 40352498 | G | A | Missense_Mutation | p.G49D | 1 |
| EIF1B | LUSC | chr3 | 40352450 | 40352450 | T | C | Missense_Mutation | p.I33T | 1 |
| EIF1B | CESC | chr3 | 40351430 | 40351430 | C | G | Missense_Mutation | 1 | |
| EIF1B | SARC | chr3 | 40353017 | 40353017 | G | T | Missense_Mutation | 1 | |
| EIF1B | HNSC | chr3 | 40353003 | 40353003 | G | A | Missense_Mutation | 1 | |
| EIF1B | SKCM | chr3 | 40352422 | 40352422 | C | T | Missense_Mutation | p.P24S | 1 |
| EIF1B | HNSC | chr3 | 40353003 | 40353003 | G | A | Missense_Mutation | p.G80R | 1 |
| EIF1B | SKCM | chr3 | 40352421 | 40352421 | C | T | Silent | p.L23L | 1 |
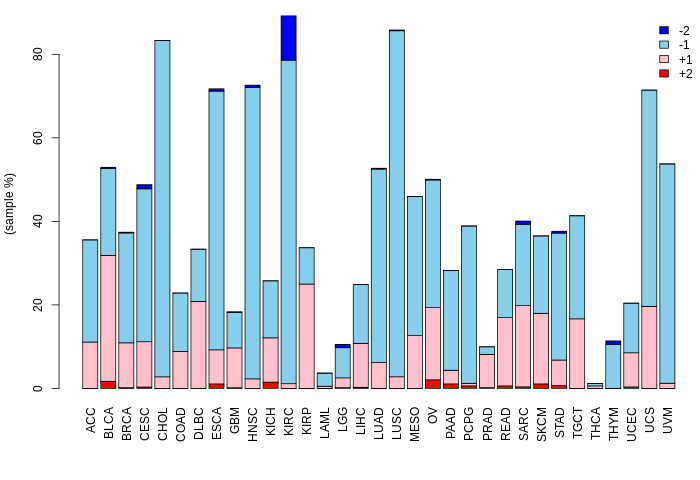
| Copy number variation (CNV) of EIF1B * Click on the image to open the original image in a new window. |
 |
| Fusion gene breakpoints (product of the structural variants (SVs)) across EIF1B * Click on the image to open the UCSC genome browser with custom track showing this image in a new window. |
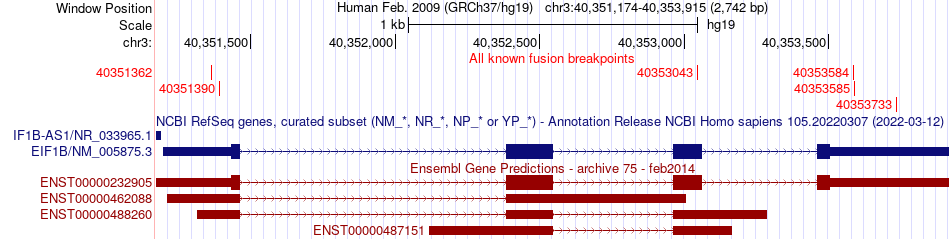 |
| Fusion genes with this translation factor from FusionGDB2.0. |
| FusionGDB2 ID | Disease | Sample | Hgene | Hchr | Hbp | Hstrand | Tgene | Tchr | Tbp | Tstrand |
| 56852 | N/A | AA740716 | EIF1B | chr3 | 40353585 | - | EIF1B | chr3 | 40351390 | + |
| 56852 | N/A | AW205722 | EIF1B | chr3 | 40353584 | - | EIF1B | chr3 | 40351390 | + |
| 102669 | N/A | FN114103 | EIF1B | chr3 | 40353043 | - | SH3BP4 | chr2 | 235942659 | - |
| 56855 | LIHC | TCGA-DD-A116-01A | MYRIP | chr3 | 39942417 | + | EIF1B | chr3 | 40351362 | + |
Top |
|
| Kaplan-Meier plots with logrank tests of overall survival (OS) |
 |
| Cancer type | Translation factor | Coefficent | Hazard ratio | Wald test pval | Likelihool ratio pval | Logrank test pval | # samples |
Top |
|
| Differential gene expression between female and male. (Wilcoxon test, pval<0.05) |
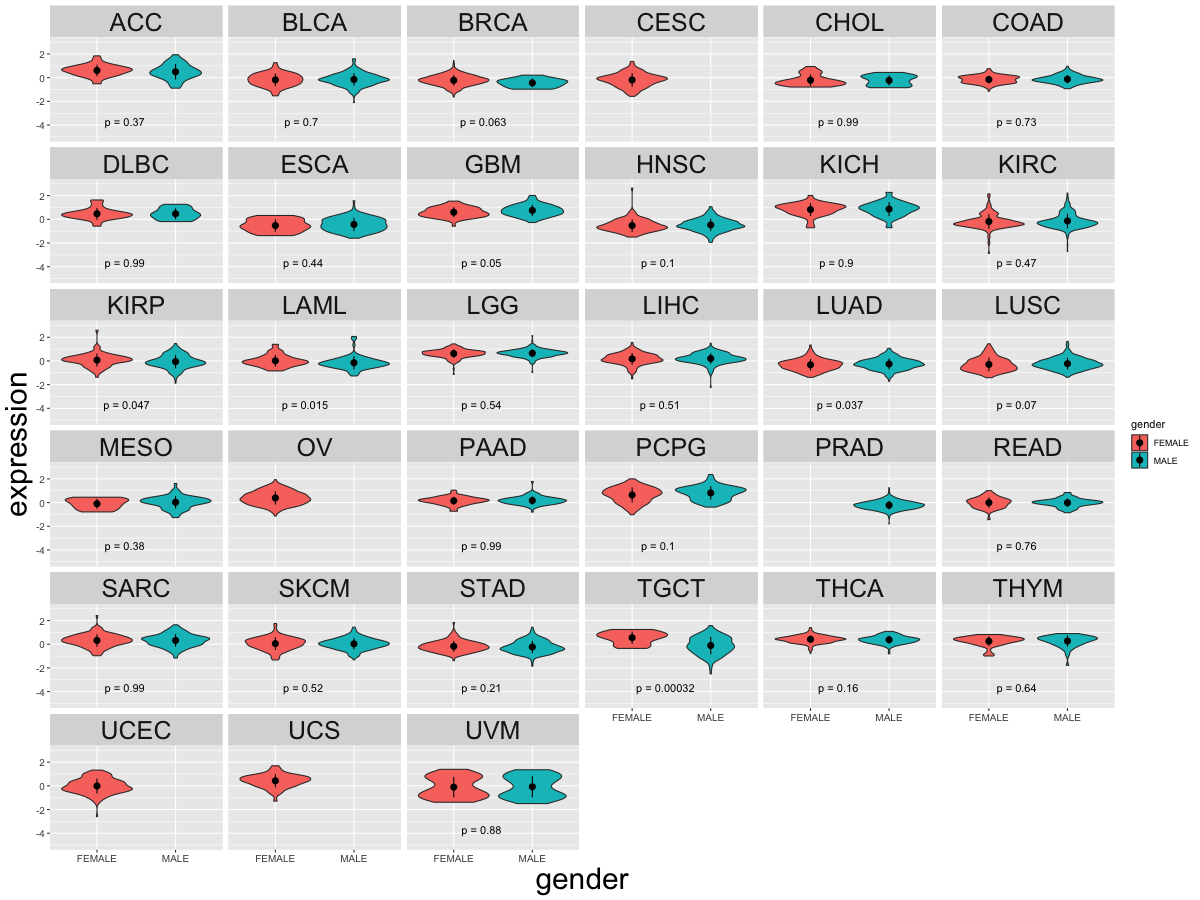 |
| Cancer type | Translation factor | pval | adj.p |
| TGCT | EIF1B | 0.000318114276322512 | 0.0089 |
| LAML | EIF1B | 0.0148015597103191 | 0.4 |
| LUAD | EIF1B | 0.0367086212921785 | 0.95 |
| KIRP | EIF1B | 0.0466896174909081 | 1 |
| GBM | EIF1B | 0.0496775086745391 | 1 |
Top |
|
| Differential gene expression between young and old age groups (Wilcoxon test, pval<0.05) |
 |
| Cancer type | Translation factor | pval | adj.p |
| TGCT | EIF1B | 0.0230086206641211 | 0.69 |
| LUSC | EIF1B | 0.0337074914215358 | 0.94 |
| GBM | EIF1B | 0.0147243404426862 | 0.46 |
| LGG | EIF1B | 3.52894544599618e-06 | 0.00012 |
| BRCA | EIF1B | 0.0236572958515485 | 0.69 |
| OV | EIF1B | 0.0028687357002971 | 0.092 |
| CESC | EIF1B | 0.0437821002707061 | 1 |
Top |
|
| Drugs targeting genes involved in this translation factor. (DrugBank Version 5.1.8 2021-05-08) |
| UniProtAcc | DrugBank ID | Drug name | Drug activity | Drug type | Drug status |
Top |
|
| Diseases associated with this translation factor. (DisGeNet 4.0) |
| Disease ID | Disease Name | # PubMeds | Disease source |
(UTHealth)
Web File Viewing | Emergency Information |Campus Carry|Site Policies