
|
||||||
|

Translation Factor: EIF3M (NCBI Gene ID:10480) |
|
 Gene Summary Gene Summary |
| Gene Information | Gene Name: EIF3M | Gene ID: 10480 | Gene Symbol | EIF3M | Gene ID | 10480 |
| Gene Name | eukaryotic translation initiation factor 3 subunit M | |
| Synonyms | B5|GA17|PCID1|TANGO7|hfl-B5 | |
| Cytomap | 11p13 | |
| Type of Gene | protein-coding | |
| Description | eukaryotic translation initiation factor 3 subunit MB5 receptorPCI domain containing 1 (herpesvirus entry mediator)PCI domain-containing protein 1dendritic cell proteinfetal lung protein B5transport and golgi organization 7 homolog | |
| Modification date | 20200313 | |
| UniProtAcc | Q7L2H7 | |
| Child GO biological process term(s) under GO:0006412 |
| GO ID | GO term |
| GO:0006417 | Regulation of translation |
| GO:0008135 | Translation factor activity, RNA binding |
| GO:0002181 | Cytoplasmic translation |
| GO:0006413 | Translational initiation |
| GO:0006412 | Translation |
| Gene ontology of translaction factor with evidence of Inferred from Direct Assay (IDA) from Entrez |
| Partner | Gene | GO ID | GO term | PubMed ID |
| Inferred gene age of translation factor. |
| Gene | Inferred gene age group among (0 - 67.6], (67.6 - 355.7], (355.7 - 733], (733 - 1119.25], >1119.25 |
| EIF3M | >1119.25 |
Top |
|
| We searched PubMed using 'EIF3M[title] AND translation [title] AND human.' |
| Gene | Title | PMID |
| EIF3M | . | . |
Top |
|
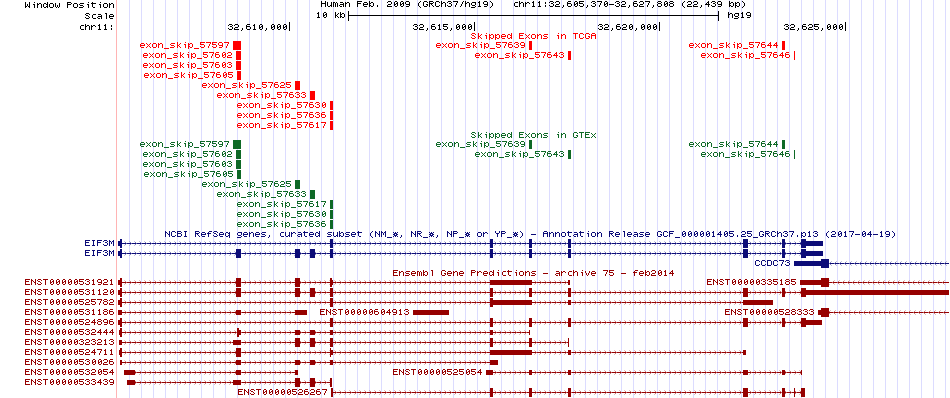
| Skipped exons in TCGA and GTEx based on Ensembl gene isoform structure. * Click on the image to open the UCSC genome browser with custom track showing this image in a new window. For more annotations, please visit our ExonSkipDB. |
 |
| Open reading frame (ORF) analsis of exon skipping events based on Ensembl gene isoform structure. * Click on the break point to see the gene structure around the break point region using the UCSC Genome Browser. |
| ENST | Exon skip start (DNA) | Exon Skip end (DNA) | ORF |
| ENST00000531120 | 32608557 | 32608690 | Frame-shift |
| ENST00000531120 | 32610557 | 32610681 | Frame-shift |
| ENST00000531120 | 32616459 | 32616559 | Frame-shift |
| ENST00000531120 | 32617511 | 32617593 | Frame-shift |
| ENST00000531120 | 32623307 | 32623368 | Frame-shift |
| Exon skipping position in the amino acid sequence. |
| ENST | Exon skip start (DNA) | Exon Skip end (DNA) | Len(transcript seq) | Exon skip start (mRNA) | Exon Skip end (mRNA) | Len(amino acid seq) | Exon skip start (AA) | Exon Skip end (AA) |
| Potentially (partially) lost protein functional features of UniProt. |
| UniProtAcc | Exon skip start (AA) | Exon Skip end (AA) | Function feature start (AA) | Function feature end (AA) | Functional feature type | Functional feature desc. |
Top |
|
| Gene expression level across TCGA pancancer |
 |
| Gene expression level across GTEx pantissue |
 |
| Expression level of gene isoforms across TCGA pancancer |
 |
| Expression level of gene isoforms across GTEx pantissue |
 |
| Cancer(tissue) type-specific expression level of Translation factor using z-score distriution |
 |
| Differential expression between tumor and matched normal (in the cancer types with more than 10 matched samples) |
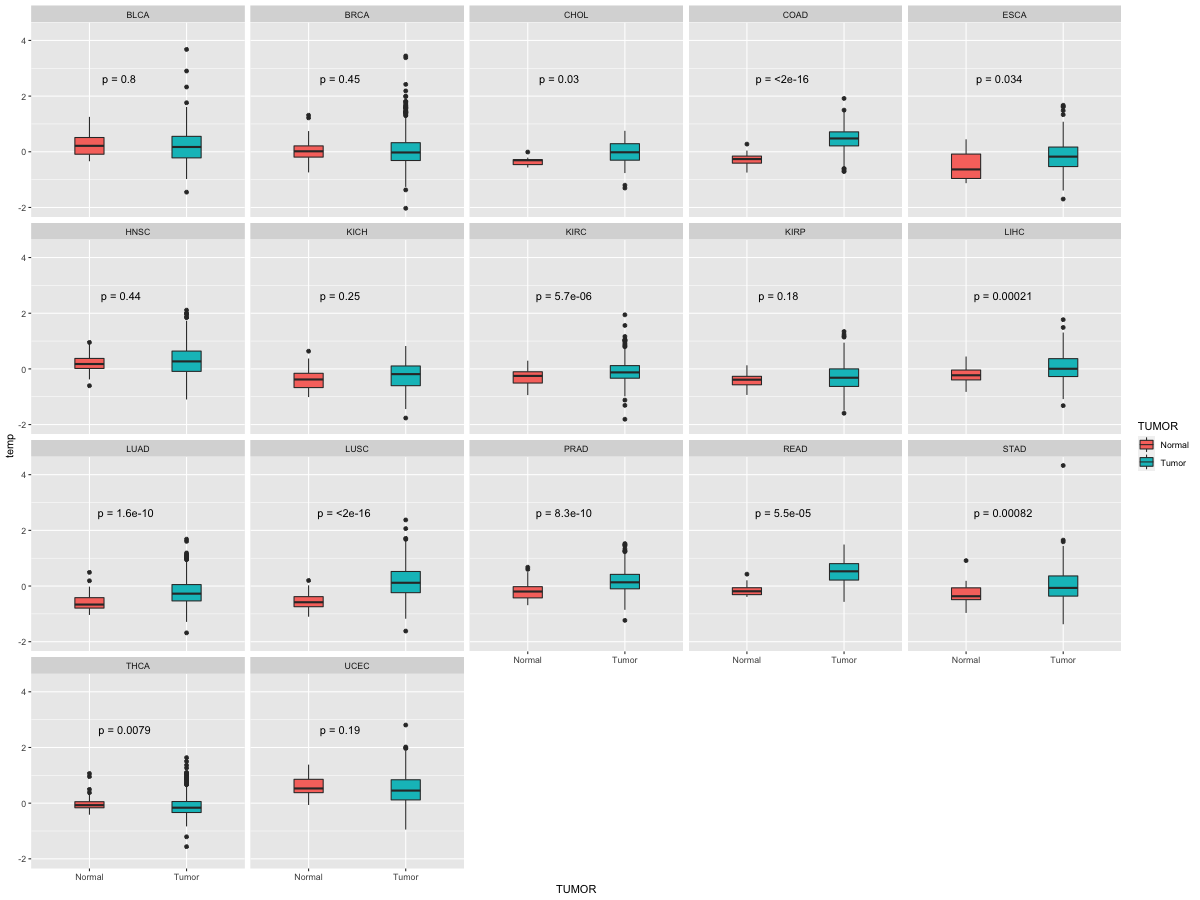 |
| Cancer type | Translation factor | FC | adj.pval |
| LUAD | EIF3M | -1.5429573968308 | 4.40678669801292e-06 |
| KIRC | EIF3M | -2.00888134658998 | 8.07326657761222e-05 |
Top |
|
| Translation factor expression regulation through miRNA binding |
| Cancer type | Gene | miRNA | TargetScan binding score (Context++ score percentile) | Coefficient | Pvalue |
| Translation factor expression regulation through methylation in the promoter of Translation factor |
 |
| Cancer type | Gene | methyl group b | methyl group a | DEG pval | avg methyl in b | avg methyl in a | avg exp in b | avg exp in a |
| Translation factor expression regulation through methylation in the gene body of Translation factor (positive regulation) |
 |
| Cancer type | Gene | methyl group b | methyl group a | DEG pval | avg methyl in b | avg methyl in a | avg exp in b | avg exp in a |
| Translation factor expression regulation through copy number variation of Translation factor |
 |
| Cancer type | Gene | Coefficient | Pvalue |
Top |
|
| Strongly correlated genes belong to cellular important gene groups with EIF3M (coefficient>0.8, pval<0.05, node color based on FC between tumor and matched normal). Significantly associated important genes in the individual cancer types. * Cell metabolism gene: cell metabolism genes from REACTOME (black edge), IUPHAR: drug target genes from IUPHAR (blue edge), Kinase: human kinase genes (brown edge), CGC: cancer gene census genes (orange edge), TSG: tumor suppresor genes (purple edge), Epifactor: epigenetic factors (light blue edge), TF: transcription factors (green) |
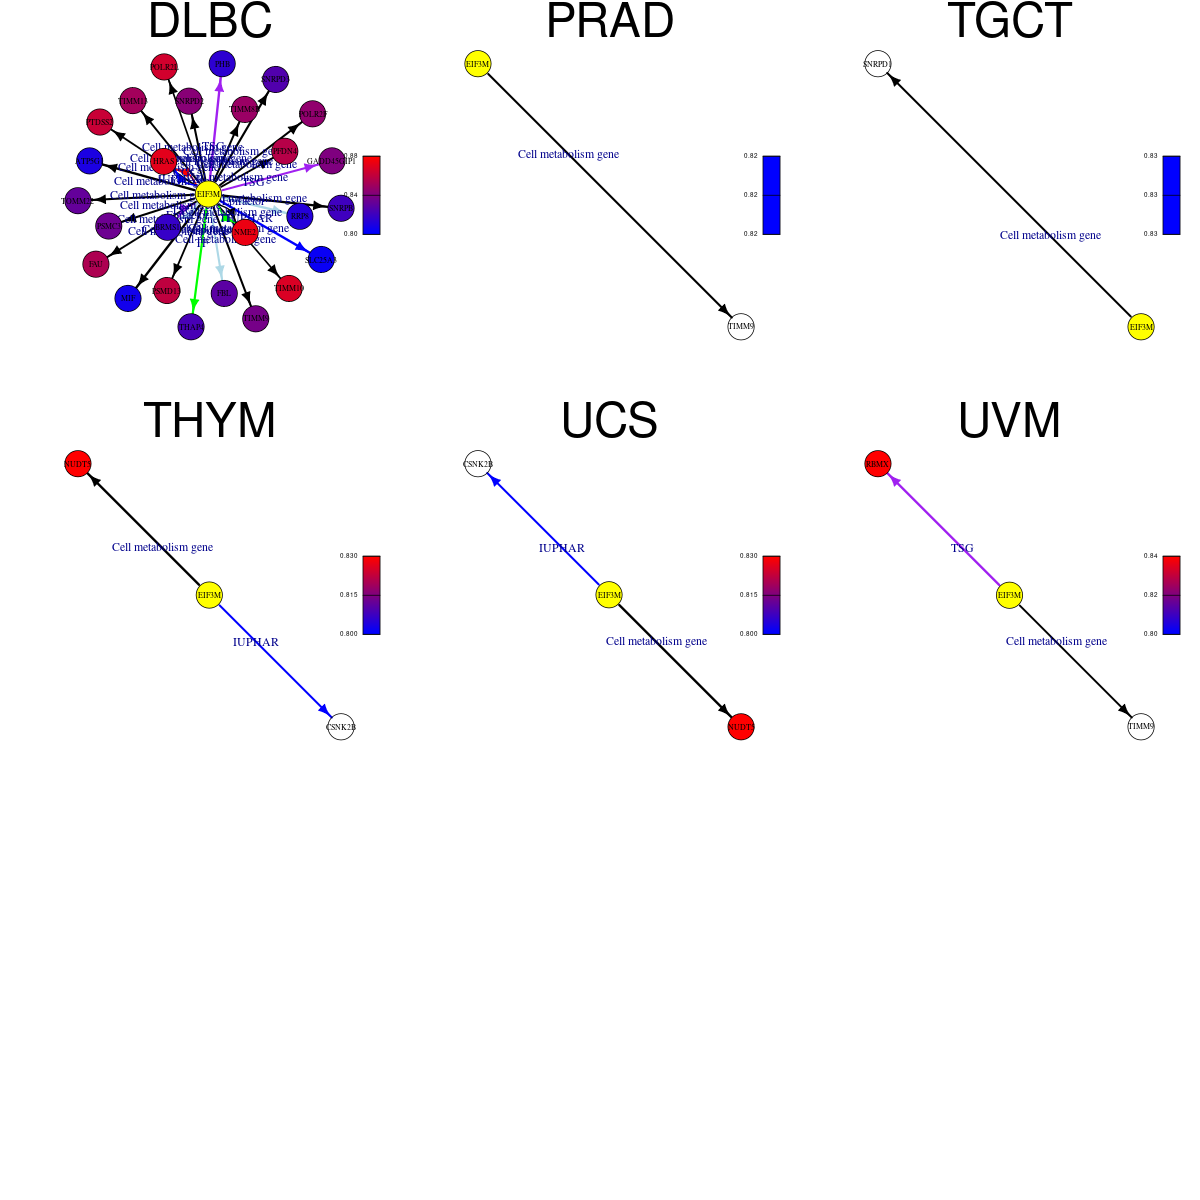 |
| Cancer type | Gene group | Translation factor | Correlated gene | Coefficient | Pvalue |
| DLBC | Cell metabolism gene | EIF3M | MIF | 0.801654585 | 7.59E-12 |
| DLBC | Cell metabolism gene | EIF3M | ATP5G1 | 0.802238059 | 7.14E-12 |
| DLBC | Cell metabolism gene | EIF3M | SNRPB | 0.80976611 | 3.19E-12 |
| DLBC | Cell metabolism gene | EIF3M | SNRPD3 | 0.819456109 | 1.07E-12 |
| DLBC | Cell metabolism gene | EIF3M | TOMM22 | 0.823330679 | 6.81E-13 |
| DLBC | Cell metabolism gene | EIF3M | PSMC3 | 0.825304732 | 5.38E-13 |
| DLBC | Cell metabolism gene | EIF3M | TIMM9 | 0.827014667 | 4.37E-13 |
| DLBC | Cell metabolism gene | EIF3M | SNRPD2 | 0.827996972 | 3.88E-13 |
| DLBC | Cell metabolism gene | EIF3M | POLR2F | 0.829004593 | 3.43E-13 |
| DLBC | Cell metabolism gene | EIF3M | TIMM8B | 0.830346932 | 2.90E-13 |
| DLBC | Cell metabolism gene | EIF3M | TIMM13 | 0.835386466 | 1.54E-13 |
| DLBC | Cell metabolism gene | EIF3M | FAU | 0.837472912 | 1.17E-13 |
| DLBC | Cell metabolism gene | EIF3M | PFDN4 | 0.840161875 | 8.25E-14 |
| DLBC | Cell metabolism gene | EIF3M | PSMD13 | 0.843768521 | 5.09E-14 |
| DLBC | Cell metabolism gene | EIF3M | PTDSS2 | 0.845835998 | 3.83E-14 |
| DLBC | Cell metabolism gene | EIF3M | POLR2L | 0.855070963 | 1.03E-14 |
| DLBC | Cell metabolism gene | EIF3M | TIMM10 | 0.855454822 | 9.71E-15 |
| DLBC | Cell metabolism gene | EIF3M | NME2 | 0.877217357 | 2.91E-16 |
| DLBC | CGC | EIF3M | HRAS | 0.858731258 | 5.95E-15 |
| DLBC | Epifactor | EIF3M | RRP8 | 0.802346016 | 7.06E-12 |
| DLBC | Epifactor | EIF3M | BRMS1 | 0.806586713 | 4.51E-12 |
| DLBC | Epifactor | EIF3M | FBL | 0.822397008 | 7.60E-13 |
| DLBC | IUPHAR | EIF3M | SLC25A3 | 0.801036516 | 8.10E-12 |
| DLBC | IUPHAR | EIF3M | HRAS | 0.858731258 | 5.95E-15 |
| DLBC | TF | EIF3M | THAP4 | 0.813954723 | 2.01E-12 |
| DLBC | TF | EIF3M | NME2 | 0.877217357 | 2.91E-16 |
| DLBC | TSG | EIF3M | PHB | 0.803150538 | 6.49E-12 |
| DLBC | TSG | EIF3M | BRMS1 | 0.806586713 | 4.51E-12 |
| DLBC | TSG | EIF3M | GADD45GIP1 | 0.827611383 | 4.07E-13 |
| PRAD | Cell metabolism gene | EIF3M | TIMM9 | 0.824670691 | 9.92E-138 |
| TGCT | Cell metabolism gene | EIF3M | SNRPD1 | 0.828043665 | 1.54E-40 |
| THYM | Cell metabolism gene | EIF3M | NUDT5 | 0.801229542 | 1.55E-28 |
| THYM | IUPHAR | EIF3M | CSNK2B | 0.829035104 | 4.46E-32 |
| UCS | Cell metabolism gene | EIF3M | NUDT5 | 0.801229542 | 1.55E-28 |
| UCS | IUPHAR | EIF3M | CSNK2B | 0.829035104 | 4.46E-32 |
| UVM | Cell metabolism gene | EIF3M | TIMM9 | 0.838255662 | 3.06E-22 |
| UVM | TSG | EIF3M | RBMX | 0.803547984 | 2.97E-19 |
Top |
|
| Protein 3D structure Visit iCn3D. |
Top |
|
| Protein-protein interaction networks * Overlap between up-regulated DEGs (log2FC<-1 and adj.P<0.05) and STRING PPI network (center: Translation factor, node: DEGs, edges: weighted by -log2(adj.P)) |
 |
| Overlap between down-regulated DEGs (log2FC>1 and adj.P<0.05) and STRING PPI network (center: Translation factor, node: DEGs, edges: weighted by -log2(adj.P)) |
 |
 * Edge colors based on TCGA cancer types. |
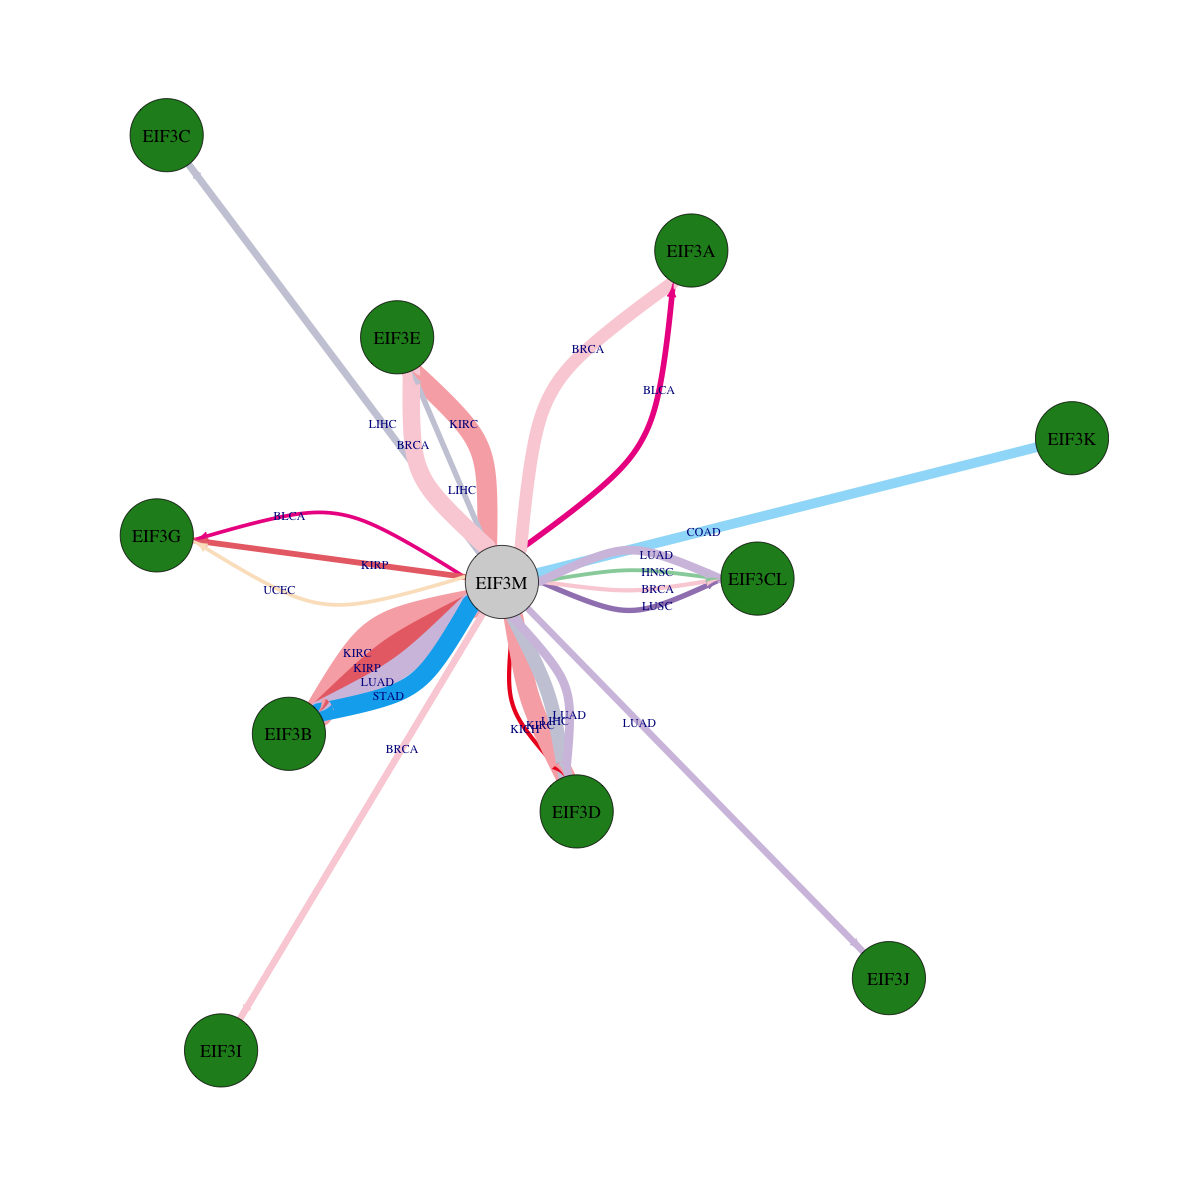
| * Overlap between DEGs (log2FC>1 and adj.P<0.05) and STRING PPI network per cancer (center: Translation factor, node: DEGs, node color: log2FC, edges: weighted by -log2(adj.P)) |
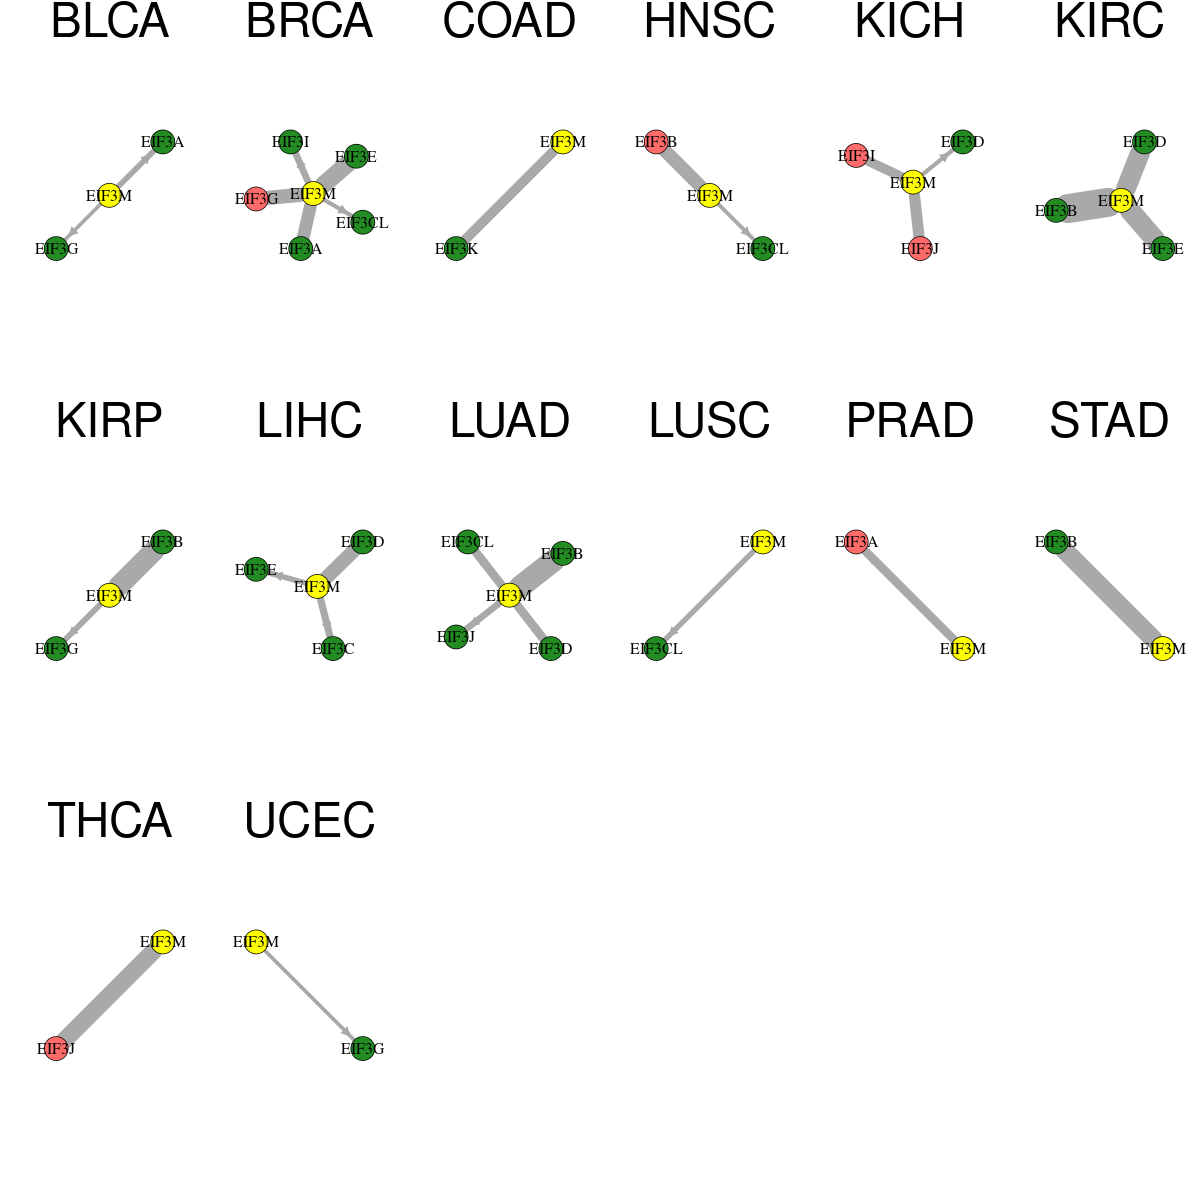 |
| Cancer type | Translation factor | Interacting protein coding gene | FC | adj.pval |
| COAD | EIF3M | EIF3K | -1.81556046390697 | 0.000109195709228516 |
| KICH | EIF3M | EIF3I | 1.57310069220802 | 0.000139892101287842 |
| LUAD | EIF3M | EIF3D | -2.4724631441106 | 0.000299564272708473 |
| LUAD | EIF3M | EIF3CL | -2.13616202681733 | 0.000327584192623451 |
| PRAD | EIF3M | EIF3A | 1.13680328391952 | 0.000363360004697762 |
| LIHC | EIF3M | EIF3C | -1.23074521883972 | 0.00126327311470459 |
| BRCA | EIF3M | EIF3I | -1.72233459275531 | 0.00191218761269043 |
| LUAD | EIF3M | EIF3J | -1.1109238877878 | 0.00216965225011196 |
| KIRP | EIF3M | EIF3G | -2.4178322962129 | 0.00471024587750435 |
| BLCA | EIF3M | EIF3A | -4.45104058307747 | 0.00532913208007812 |
| LIHC | EIF3M | EIF3E | -5.1722332599854 | 0.00593802028362182 |
| LUSC | EIF3M | EIF3CL | -1.65891070592699 | 0.00704157337736851 |
| BRCA | EIF3M | EIF3CL | -1.45129115344564 | 0.0202464785451748 |
| KICH | EIF3M | EIF3D | -5.64942867023017 | 0.0202749371528625 |
| HNSC | EIF3M | EIF3CL | -1.69346209598213 | 0.028266192551655 |
| UCEC | EIF3M | EIF3G | -3.35078334696571 | 0.03125 |
| BLCA | EIF3M | EIF3G | -3.07707559649091 | 0.0323410034179688 |
| LUAD | EIF3M | EIF3B | -5.80435587546762 | 1.0542655358657e-09 |
| KIRC | EIF3M | EIF3D | -2.33501876832058 | 1.16831478033445e-08 |
| THCA | EIF3M | EIF3J | 1.32428508175103 | 1.19078203681914e-07 |
| BRCA | EIF3M | EIF3G | 1.87948385011271 | 1.9107949115022e-06 |
| KIRC | EIF3M | EIF3B | -1.56313263784517 | 2.35252849767166e-12 |
| LIHC | EIF3M | EIF3D | -2.51854304632799 | 2.35319665208461e-06 |
| KICH | EIF3M | EIF3J | 2.09716749126717 | 3.19480895996094e-05 |
| STAD | EIF3M | EIF3B | -4.7724660972007 | 3.25962901115418e-08 |
| HNSC | EIF3M | EIF3B | 2.6202554263604 | 4.48234413852334e-06 |
| KIRP | EIF3M | EIF3B | -2.7592297042974 | 4.6566128730774e-09 |
| BRCA | EIF3M | EIF3A | -1.218215573148 | 7.39403582934137e-06 |
| KIRC | EIF3M | EIF3E | -4.49824101219462 | 7.8509870430991e-09 |
| BRCA | EIF3M | EIF3E | -1.48408348062463 | 9.51829316317813e-08 |
| Protein-protein interactors with this translation factor (BIOGRID-3.4.160) |
| PPI interactors with EIF3M |
| EIF1B, EIF4A2, EIF3A, EIF3F, EIF3H, TADA2A, Eif3a, EIF3B, APP, EIF3C, EIF3E, EIF3D, EIF3I, EIF3K, EIF3L, EIF3G, gag-pol, MMS19, NPM1, EXOSC10, SRPK1, rev, FAM96B, HUWE1, EGFR, EIF3CL, USP34, HSPB1, AHCYL1, COPS4, RPN1, EIF3J, NTRK1, MED4, HERC2, Eif3e, Eif3i, Rpl35, NF2, PTP4A1, PSMD12, EIF4A1, GPBP1L1, UBE2N, CYLD, DLD, TRIM25, G3BP1, BRCA1, HNRNPL, CFTR, PSMD1, VPS72, ZNF598, RMND5A, PRPF8, EFTUD2, ESR2, HEXIM1, MEPCE, LARP7, RECQL4, ELAVL1, KCNJ2, ZFP36L2, MYC, TP53, KIAA1429, EIF4B, ATG16L1, TGFBR2, METTL3, USP14, NR2C2, GBF1, CD74, DDX60, RAB27A, BIRC3, WWP2, nsp2ab, CMTR1, ZMYND10, ABI3, TRIML2, ZNF783, CUL7, PLEKHA4, MIB1, DOK2, RAB5A, nsp1, nsp7, ESR1, CIT, ANLN, CHMP4C, ECT2, ACACA, BRD4, Apc2, BKRF1, EIF4E, ANGEL1, EIF4G3, EIF4EBP2, EIF4ENIF1, EIF4EBP1, EIF4G1, UBQLN1, FZR1, WDR5, PSD4, PNMA2, GSTA5, EP300, FBXO32, OPTN, SLFN11, |
Top |
|
| Clinically associated variants from ClinVar. |
| Gene | Chr | Position | RefSeq | VarSeq | RefSeeq | VarType | Pathogenic | Disease | VarInfo |
| nsSNVs with sample frequency (size of circle) from TCGA 33 cancers. |
 |
| SNVs and Indels |
| Gene | Cancer type | Chromosome | Start | End | RefSeeq | MutSeq | Mutation type | AAchange | # samples |
| EIF3M | STAD | chr11 | 32610588 | 32610588 | G | C | Missense_Mutation | p.K115N | 4 |
| EIF3M | KIRP | chr11 | 32623898 | 32623898 | A | T | Missense_Mutation | p.N360Y | 4 |
| EIF3M | LIHC | chr11 | 32610663 | 32610663 | C | - | Frame_Shift_Del | p.I140fs | 3 |
| EIF3M | COAD | chr11 | 32611130 | 32611130 | A | - | Frame_Shift_Del | p.E159fs | 3 |
| EIF3M | LIHC | chr11 | 32616533 | 32616533 | T | - | Frame_Shift_Del | p.F231fs | 3 |
| EIF3M | HNSC | chr11 | 32615476 | 32615476 | G | T | Missense_Mutation | p.A200S | 3 |
| EIF3M | BRCA | chr11 | 32608625 | 32608625 | G | C | Missense_Mutation | p.G37A | 3 |
| EIF3M | UCEC | chr11 | 32615480 | 32615480 | G | A | Missense_Mutation | p.R201Q | 3 |
| EIF3M | GBM | chr11 | 32615446 | 32615446 | G | A | Missense_Mutation | p.G190R | 3 |
| EIF3M | UCEC | chr11 | 32611116 | 32611116 | G | T | Missense_Mutation | p.W154C | 3 |
| EIF3M | BLCA | chr11 | 32622318 | 32622318 | G | C | Missense_Mutation | p.D295H | 2 |
| EIF3M | STAD | chr11 | 32610169 | 32610169 | T | A | Missense_Mutation | p.S69T | 2 |
| EIF3M | UCEC | chr11 | 32605475 | 32605475 | G | T | Missense_Mutation | p.Q14H | 2 |
| EIF3M | STAD | chr11 | 32623875 | 32623875 | A | G | Missense_Mutation | p.D352G | 2 |
| EIF3M | UCEC | chr11 | 32608616 | 32608616 | C | T | Missense_Mutation | p.S34L | 2 |
| EIF3M | STAD | chr11 | 32615494 | 32615494 | A | G | Missense_Mutation | p.R206G | 2 |
| EIF3M | UCEC | chr11 | 32617542 | 32617542 | G | A | Missense_Mutation | p.A250T | 2 |
| EIF3M | STAD | chr11 | 32616545 | 32616545 | G | A | Missense_Mutation | p.E235K | 2 |
| EIF3M | LIHC | chr11 | 32623334 | 32623334 | A | - | Frame_Shift_Del | p.K324fs | 2 |
| EIF3M | UCEC | chr11 | 32622234 | 32622234 | G | T | Splice_Site | e9-1 | 2 |
| EIF3M | HNSC | chr11 | 32615458 | 32615458 | G | C | Missense_Mutation | p.E194Q | 2 |
| EIF3M | LIHC | chr11 | 32623354 | 32623354 | A | - | Frame_Shift_Del | p.R330fs | 2 |
| EIF3M | UCEC | chr11 | 32622308 | 32622308 | A | C | Missense_Mutation | p.E291D | 2 |
| EIF3M | KIRC | chr11 | 32610272 | 32610272 | T | C | Missense_Mutation | p.L103P | 2 |
| EIF3M | UCEC | chr11 | 32622377 | 32622377 | C | T | Silent | p.D314 | 2 |
| EIF3M | CESC | chr11 | 32610234 | 32610234 | G | A | Silent | 2 | |
| EIF3M | BLCA | chr11 | 32610646 | 32610646 | G | A | Missense_Mutation | p.G135R | 2 |
| EIF3M | LIHC | chr11 | 32610277 | 32610277 | T | C | Silent | 2 | |
| EIF3M | GBM | chr11 | 32610174 | 32610174 | A | G | Silent | 1 | |
| EIF3M | SKCM | chr11 | 32610244 | 32610244 | C | T | Missense_Mutation | p.R94C | 1 |
| EIF3M | UCEC | chr11 | 32622234 | 32622234 | G | T | Splice_Site | p.G267_splice | 1 |
| EIF3M | COAD | chr11 | 32610208 | 32610208 | T | A | Missense_Mutation | p.L82M | 1 |
| EIF3M | OV | chr11 | 32608572 | 32608572 | T | G | Silent | p.R19R | 1 |
| EIF3M | GBM | chr11 | 32615446 | 32615446 | G | A | Missense_Mutation | 1 | |
| EIF3M | BLCA | chr11 | 32605464 | 32605464 | G | A | Missense_Mutation | p.E11K | 1 |
| EIF3M | LIHC | chr11 | 32610226 | 32610227 | - | A | Frame_Shift_Ins | p.K88fs | 1 |
| EIF3M | COAD | chr11 | 32610209 | 32610209 | T | A | Nonsense_Mutation | p.L82X | 1 |
| EIF3M | PAAD | chr11 | 32610244 | 32610244 | C | A | Missense_Mutation | 1 | |
| EIF3M | HNSC | chr11 | 32615458 | 32615458 | G | C | Missense_Mutation | 1 | |
| EIF3M | BLCA | chr11 | 32615485 | 32615485 | G | C | Missense_Mutation | p.D203H | 1 |
| EIF3M | LIHC | chr11 | 32610240 | 32610241 | - | T | Frame_Shift_Ins | p.S93fs | 1 |
| EIF3M | PRAD | chr11 | 32610621 | 32610621 | C | T | Silent | p.S126S | 1 |
| EIF3M | HNSC | chr11 | 32615476 | 32615476 | G | T | Missense_Mutation | 1 | |
| EIF3M | BLCA | chr11 | 32608636 | 32608636 | G | A | Missense_Mutation | p.D41N | 1 |
| EIF3M | COAD | chr11 | 32615495 | 32615495 | G | T | Missense_Mutation | p.R206M | 1 |
| EIF3M | SARC | chr11 | 32605438 | 32605438 | G | T | Missense_Mutation | 1 | |
| EIF3M | BLCA | chr11 | 32610646 | 32610646 | G | A | Missense_Mutation | 1 | |
| EIF3M | BLCA | chr11 | 32615424 | 32615424 | A | G | Silent | p.S182S | 1 |
| EIF3M | DLBC | chr11 | 32622233 | 32622233 | A | T | Splice_Site | . | 1 |
| EIF3M | SARC | chr11 | 32610205 | 32610205 | G | T | Missense_Mutation | 1 | |
| EIF3M | BLCA | chr11 | 32622318 | 32622318 | G | C | Missense_Mutation | 1 | |
| EIF3M | THCA | chr11 | 32611145 | 32611145 | T | C | Missense_Mutation | 1 | |
| EIF3M | BLCA | chr11 | 32608657 | 32608657 | G | T | Missense_Mutation | p.A48S | 1 |
| EIF3M | DLBC | chr11 | 32610617 | 32610617 | G | T | Missense_Mutation | p.C125F | 1 |
| EIF3M | SARC | chr11 | 32610620 | 32610620 | G | T | Missense_Mutation | 1 | |
| EIF3M | BLCA | chr11 | 32605464 | 32605464 | G | A | Missense_Mutation | 1 | |
| EIF3M | THCA | chr11 | 32611145 | 32611145 | T | C | Missense_Mutation | p.L164P | 1 |
| EIF3M | LIHC | chr11 | 32608638 | 32608638 | T | - | Frame_Shift_Del | p.D41fs | 1 |
| EIF3M | ESCA | chr11 | 32622329 | 32622329 | G | T | Missense_Mutation | 1 | |
| EIF3M | SARC | chr11 | 32622348 | 32622348 | G | T | Missense_Mutation | 1 | |
| EIF3M | BLCA | chr11 | 32615485 | 32615485 | G | C | Missense_Mutation | 1 | |
| EIF3M | THYM | chr11 | 32608617 | 32608617 | G | T | Silent | p.S34S | 1 |
| EIF3M | LUAD | chr11 | 32610279 | 32610279 | G | A | Splice_Site | 1 | |
| EIF3M | ESCA | chr11 | 32616545 | 32616545 | G | T | Nonsense_Mutation | p.E235X | 1 |
| EIF3M | SARC | chr11 | 32610620 | 32610620 | G | T | Missense_Mutation | p.S126I | 1 |
| EIF3M | BLCA | chr11 | 32608636 | 32608636 | G | A | Missense_Mutation | 1 | |
| EIF3M | KIRP | chr11 | 32623898 | 32623898 | A | T | Missense_Mutation | 1 | |
| EIF3M | UCEC | chr11 | 32611144 | 32611144 | C | A | Missense_Mutation | p.L164I | 1 |
| EIF3M | CESC | chr11 | 32610664 | 32610664 | C | A | Missense_Mutation | 1 | |
| EIF3M | LUAD | chr11 | 32622378 | 32622378 | G | T | Splice_Site | p.A315_splice | 1 |
| EIF3M | ESCA | chr11 | 32622329 | 32622329 | G | T | Missense_Mutation | p.Q298H | 1 |
| EIF3M | SARC | chr11 | 32605438 | 32605438 | G | T | Missense_Mutation | p.S2I | 1 |
| EIF3M | BLCA | chr11 | 32605455 | 32605455 | G | T | Missense_Mutation | 1 | |
| EIF3M | LIHC | chr11 | 32610571 | 32610571 | T | C | Missense_Mutation | 1 | |
| EIF3M | CESC | chr11 | 32610234 | 32610234 | G | A | Silent | p.L90 | 1 |
| EIF3M | LUAD | chr11 | 32610279 | 32610279 | G | A | Splice_Site | p.L105_splice | 1 |
| EIF3M | SKCM | chr11 | 32610214 | 32610214 | G | A | Missense_Mutation | p.E84K | 1 |
| EIF3M | COAD | chr11 | 32610207 | 32610207 | T | A | Silent | p.A81A | 1 |
| EIF3M | LUSC | chr11 | 32616471 | 32616471 | G | T | Missense_Mutation | p.R210L | 1 |
| Copy number variation (CNV) of EIF3M * Click on the image to open the original image in a new window. |
 |
| Fusion gene breakpoints (product of the structural variants (SVs)) across EIF3M * Click on the image to open the UCSC genome browser with custom track showing this image in a new window. |
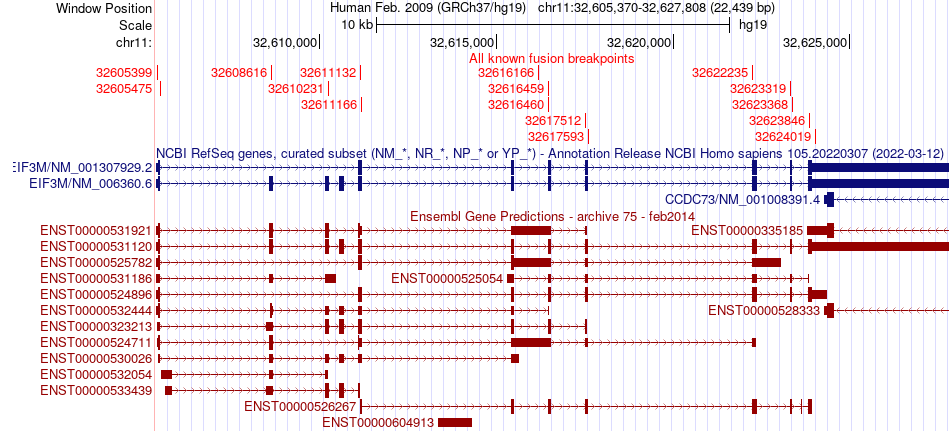 |
| Fusion genes with this translation factor from FusionGDB2.0. |
| FusionGDB2 ID | Disease | Sample | Hgene | Hchr | Hbp | Hstrand | Tgene | Tchr | Tbp | Tstrand |
| 96910 | PRAD | TCGA-G9-6348-01A | ATP6AP2 | chrX | 40465889 | - | EIF3M | chr11 | 32611132 | + |
| 96910 | N/A | FN096427 | CCDC73 | chr11 | 32623828 | - | EIF3M | chr11 | 32623846 | - |
| 103100 | N/A | NM_006360 | EIF3M | chr11 | 32623368 | + | CCDC73 | chr11 | 32623825 | + |
| 45813 | OV | TCGA-57-1993-01A | EIF3M | chr11 | 32605475 | + | CSTF3 | chr11 | 33163532 | - |
| 96910 | N/A | BQ428530 | EIF3M | chr11 | 32611166 | - | EIF3M | chr11 | 32616460 | + |
| 96910 | N/A | CA312302 | EIF3M | chr11 | 32623319 | - | EIF3M | chr11 | 32617512 | + |
| 65787 | STAD | TCGA-IN-A7NT | EIF3M | chr11 | 32605475 | + | FAM118A | chr22 | 45726483 | + |
| 94802 | N/A | BG002942 | EIF3M | chr11 | 32616166 | - | KRT7 | chr12 | 52637084 | - |
| 102197 | N/A | AF277183 | EIF3M | chr11 | 32624019 | + | NLRP5 | chr19 | 56523928 | + |
| 102982 | N/A | BP428638 | EIF3M | chr11 | 32608616 | + | PPIE | chr1 | 40219177 | + |
| 101351 | N/A | BC019360 | EIF3M | chr11 | 32605399 | - | SYNCRIP | chr6 | 86352608 | - |
| 101258 | SARC | TCGA-DX-A1KU-01A | EIF3M | chr11 | 32617593 | + | UEVLD | chr11 | 18591924 | - |
| 96910 | HNSC | TCGA-CQ-A4C9-01A | ELP4 | chr11 | 31671769 | + | EIF3M | chr11 | 32616460 | + |
| 96910 | BRCA | TCGA-C8-A12V-01A | PDHX | chr11 | 34979130 | + | EIF3M | chr11 | 32622235 | + |
| 96910 | BRCA | TCGA-E2-A573-01A | PNN | chr14 | 39645353 | + | EIF3M | chr11 | 32616460 | + |
| 96910 | CESC | TCGA-WL-A834-01A | PRRG4 | chr11 | 32860476 | + | EIF3M | chr11 | 32622235 | + |
| 96910 | CESC | TCGA-WL-A834-01A | PRRG4 | chr11 | 32861785 | + | EIF3M | chr11 | 32622235 | + |
| 96910 | OV | TCGA-04-1350 | RPL5 | chr1 | 93297674 | + | EIF3M | chr11 | 32616459 | + |
| 96910 | N/A | BF753104 | SSRP1 | chr11 | 57099366 | + | EIF3M | chr11 | 32610231 | + |
| 96914 | PRAD | TCGA-EJ-5494-01A | UPF1 | chr19 | 18979038 | - | EIF3M | chr11 | 32611132 | + |
Top |
|
| Kaplan-Meier plots with logrank tests of overall survival (OS) |
 |
| Cancer type | Translation factor | Coefficent | Hazard ratio | Wald test pval | Likelihool ratio pval | Logrank test pval | # samples |
Top |
|
| Differential gene expression between female and male. (Wilcoxon test, pval<0.05) |
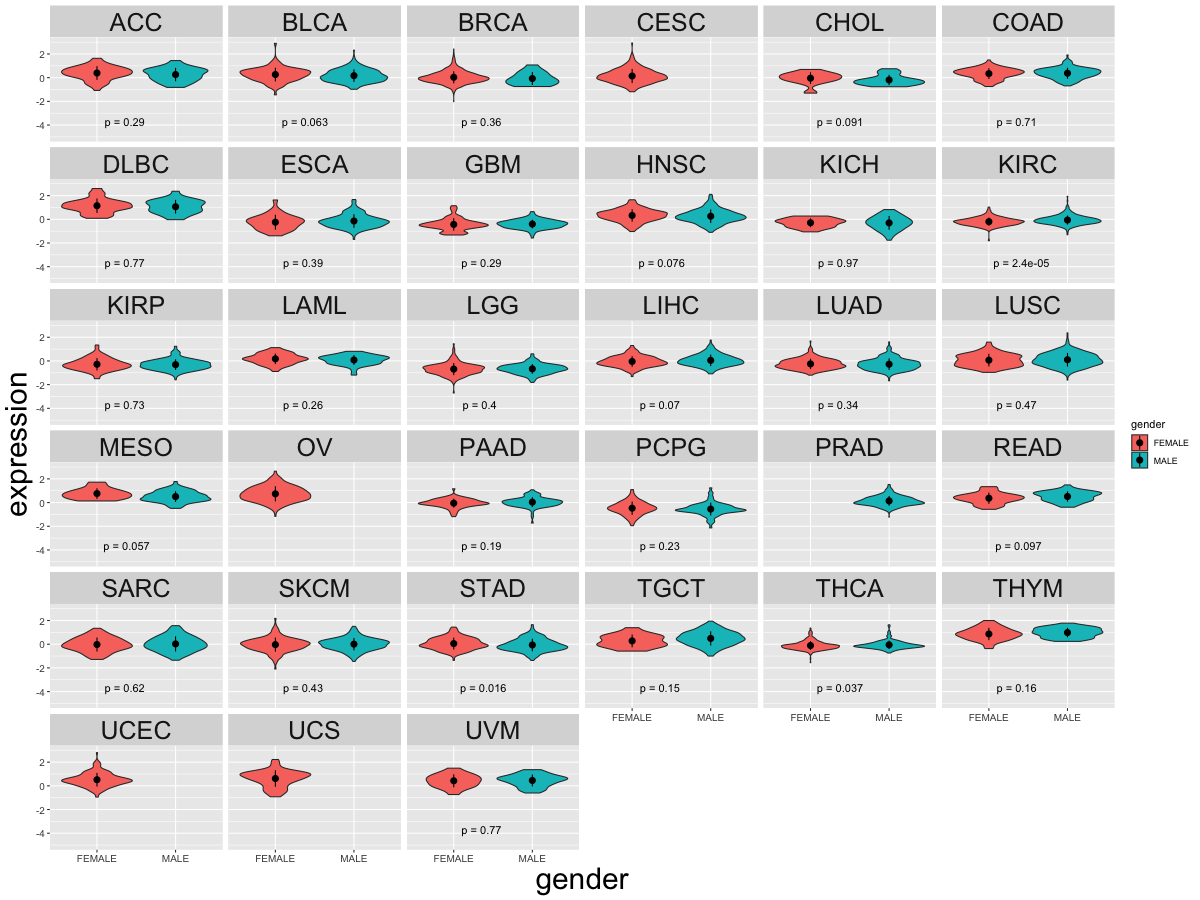 |
| Cancer type | Translation factor | pval | adj.p |
| STAD | EIF3M | 0.0187131007146727 | 0.51 |
| THCA | EIF3M | 0.0369211887056317 | 0.96 |
| BLCA | EIF3M | 0.0471743935565358 | 1 |
| KIRC | EIF3M | 2.35218640964699e-05 | 0.00066 |
Top |
|
| Differential gene expression between young and old age groups (Wilcoxon test, pval<0.05) |
 |
| Cancer type | Translation factor | pval | adj.p |
| LUSC | EIF3M | 0.0447828710088935 | 1 |
| THCA | EIF3M | 0.0419924916540688 | 1 |
| PAAD | EIF3M | 0.0331219861085606 | 1 |
Top |
|
| Drugs targeting genes involved in this translation factor. (DrugBank Version 5.1.8 2021-05-08) |
| UniProtAcc | DrugBank ID | Drug name | Drug activity | Drug type | Drug status |
Top |
|
| Diseases associated with this translation factor. (DisGeNet 4.0) |
| Disease ID | Disease Name | # PubMeds | Disease source |
(UTHealth)
Web File Viewing | Emergency Information |Campus Carry|Site Policies