
|
||||||
|

Translation Factor: TMED2 (NCBI Gene ID:10959) |
|
 Gene Summary Gene Summary |
| Gene Information | Gene Name: TMED2 | Gene ID: 10959 | Gene Symbol | TMED2 | Gene ID | 10959 |
| Gene Name | transmembrane p24 trafficking protein 2 | |
| Synonyms | P24A|RNP24|p24|p24b1|p24beta1 | |
| Cytomap | 12q24.31 | |
| Type of Gene | protein-coding | |
| Description | transmembrane emp24 domain-containing protein 2coated vesicle membrane proteinmembrane protein p24Ap24 family protein beta-1transmembrane emp24 domain trafficking protein 2 | |
| Modification date | 20200313 | |
| UniProtAcc | Q15363 | |
| Child GO biological process term(s) under GO:0006412 |
| GO ID | GO term |
| GO:0006417 | Regulation of translation |
| GO:0006413 | Translational initiation |
| GO:0006412 | Translation |
| Gene ontology of translaction factor with evidence of Inferred from Direct Assay (IDA) from Entrez |
| Partner | Gene | GO ID | GO term | PubMed ID |
| Hgene | TMED2 | GO:0006886 | intracellular protein transport | 20427317 |
| Hgene | TMED2 | GO:0034260 | negative regulation of GTPase activity | 10761932 |
| Hgene | TMED2 | GO:0072659 | protein localization to plasma membrane | 20361938 |
| Inferred gene age of translation factor. |
| Gene | Inferred gene age group among (0 - 67.6], (67.6 - 355.7], (355.7 - 733], (733 - 1119.25], >1119.25 |
| TMED2 | >1119.25 |
Top |
|
| We searched PubMed using 'TMED2[title] AND translation [title] AND human.' |
| Gene | Title | PMID |
| TMED2 | . | . |
Top |
|
| Skipped exons in TCGA and GTEx based on Ensembl gene isoform structure. * Click on the image to open the UCSC genome browser with custom track showing this image in a new window. For more annotations, please visit our ExonSkipDB. |
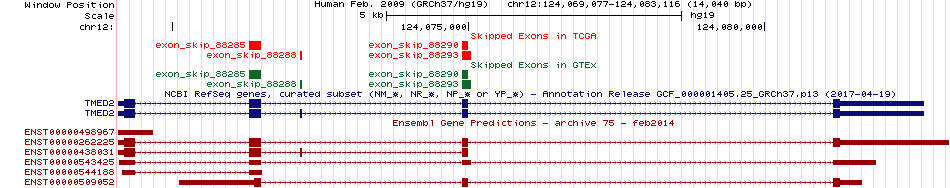 |
| Open reading frame (ORF) analsis of exon skipping events based on Ensembl gene isoform structure. * Click on the break point to see the gene structure around the break point region using the UCSC Genome Browser. |
| ENST | Exon skip start (DNA) | Exon Skip end (DNA) | ORF |
| ENST00000262225 | 124074888 | 124074996 | In-frame |
| Exon skipping position in the amino acid sequence. |
| ENST | Exon skip start (DNA) | Exon Skip end (DNA) | Len(transcript seq) | Exon skip start (mRNA) | Exon Skip end (mRNA) | Len(amino acid seq) | Exon skip start (AA) | Exon Skip end (AA) |
| ENST00000262225 | 124074888 | 124074996 | 2569 | 480 | 587 | 201 | 124 | 160 |
| Potentially (partially) lost protein functional features of UniProt. |
| UniProtAcc | Exon skip start (AA) | Exon Skip end (AA) | Function feature start (AA) | Function feature end (AA) | Functional feature type | Functional feature desc. |
| Q15363 | 124 | 160 | 21 | 201 | Chain | ID=PRO_0000010381;Note=Transmembrane emp24 domain-containing protein 2 |
| Q15363 | 124 | 160 | 21 | 168 | Topological domain | Note=Lumenal;Ontology_term=ECO:0000255;evidence=ECO:0000255 |
| Q15363 | 124 | 160 | 1 | 181 | Region | Note=Interaction with F2RL1;Ontology_term=ECO:0000269;evidence=ECO:0000269|PubMed:17693410;Dbxref=PMID:17693410 |
| Q15363 | 124 | 160 | 118 | 157 | Region | Note=Required for TMED10 and TMED2 cis-Golgi network localization |
| Q15363 | 124 | 160 | 117 | 167 | Coiled coil | Ontology_term=ECO:0000255;evidence=ECO:0000255 |
Top |
|
| Gene expression level across TCGA pancancer |
 |
| Gene expression level across GTEx pantissue |
 |
| Expression level of gene isoforms across TCGA pancancer |
 |
| Expression level of gene isoforms across GTEx pantissue |
 |
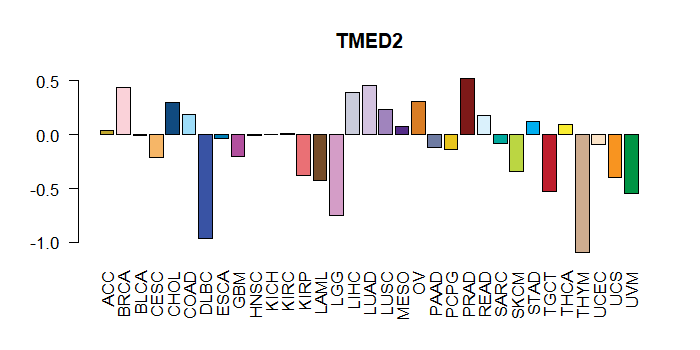
| Cancer(tissue) type-specific expression level of Translation factor using z-score distriution |
 |
| Differential expression between tumor and matched normal (in the cancer types with more than 10 matched samples) |
 |
| Cancer type | Translation factor | FC | adj.pval |
| KIRP | TMED2 | -1.31893777335992 | 0.000713176093995571 |
Top |
|
| Translation factor expression regulation through miRNA binding |
| Cancer type | Gene | miRNA | TargetScan binding score (Context++ score percentile) | Coefficient | Pvalue |
| DLBC | TMED2 | hsa-miR-30a-5p | 88 | 0.331290471785384 | 0.0233863014717027 |
| KICH | TMED2 | hsa-miR-30a-5p | 88 | -0.327872444011685 | 0.00332077402304602 |
| PCPG | TMED2 | hsa-miR-30c-5p | 86 | 0.410832521908471 | 0.000192345442558435 |
| Translation factor expression regulation through methylation in the promoter of Translation factor |
 |
| Cancer type | Gene | methyl group b | methyl group a | DEG pval | avg methyl in b | avg methyl in a | avg exp in b | avg exp in a |
| Translation factor expression regulation through methylation in the gene body of Translation factor (positive regulation) |
 |
| Cancer type | Gene | methyl group b | methyl group a | DEG pval | avg methyl in b | avg methyl in a | avg exp in b | avg exp in a |
| Translation factor expression regulation through copy number variation of Translation factor |
 |
| Cancer type | Gene | Coefficient | Pvalue |
| MESO | TMED2 | -0.062529651 | 0.037023001 |
| PAAD | TMED2 | 0.192415156 | 0.045775891 |
| THYM | TMED2 | 0.175888302 | 0.046430552 |
| SARC | TMED2 | 0.294605444 | 0.046497195 |
Top |
|
| Strongly correlated genes belong to cellular important gene groups with TMED2 (coefficient>0.8, pval<0.05, node color based on FC between tumor and matched normal). Significantly associated important genes in the individual cancer types. * Cell metabolism gene: cell metabolism genes from REACTOME (black edge), IUPHAR: drug target genes from IUPHAR (blue edge), Kinase: human kinase genes (brown edge), CGC: cancer gene census genes (orange edge), TSG: tumor suppresor genes (purple edge), Epifactor: epigenetic factors (light blue edge), TF: transcription factors (green) |
 |
| Cancer type | Gene group | Translation factor | Correlated gene | Coefficient | Pvalue |
| THYM | Cell metabolism gene | TMED2 | GFPT1 | 0.846835651 | 1.07E-34 |
| THYM | Cell metabolism gene | TMED2 | ALG10 | 0.848458387 | 5.91E-35 |
| THYM | Cell metabolism gene | TMED2 | LMAN1 | 0.866256999 | 5.72E-38 |
| THYM | Epifactor | TMED2 | AEBP2 | 0.816049412 | 2.39E-30 |
| THYM | IUPHAR | TMED2 | TNFRSF10A | 0.802347062 | 1.15E-28 |
| THYM | IUPHAR | TMED2 | ATP2A2 | 0.82922002 | 4.20E-32 |
| THYM | TF | TMED2 | ADNP2 | 0.810586297 | 1.16E-29 |
| THYM | TF | TMED2 | AEBP2 | 0.816049412 | 2.39E-30 |
| THYM | TF | TMED2 | ZNF664 | 0.839119518 | 1.60E-33 |
| THYM | TSG | TMED2 | TNFRSF10A | 0.802347062 | 1.15E-28 |
| UCS | Cell metabolism gene | TMED2 | GFPT1 | 0.846835651 | 1.07E-34 |
| UCS | Cell metabolism gene | TMED2 | ALG10 | 0.848458387 | 5.91E-35 |
| UCS | Cell metabolism gene | TMED2 | LMAN1 | 0.866256999 | 5.72E-38 |
| UCS | Epifactor | TMED2 | AEBP2 | 0.816049412 | 2.39E-30 |
| UCS | IUPHAR | TMED2 | TNFRSF10A | 0.802347062 | 1.15E-28 |
| UCS | IUPHAR | TMED2 | ATP2A2 | 0.82922002 | 4.20E-32 |
| UCS | TF | TMED2 | ADNP2 | 0.810586297 | 1.16E-29 |
| UCS | TF | TMED2 | AEBP2 | 0.816049412 | 2.39E-30 |
| UCS | TF | TMED2 | ZNF664 | 0.839119518 | 1.60E-33 |
| UCS | TSG | TMED2 | TNFRSF10A | 0.802347062 | 1.15E-28 |
| UVM | Cell metabolism gene | TMED2 | SLC25A32 | 0.800097014 | 5.46E-19 |
| UVM | IUPHAR | TMED2 | SLC25A32 | 0.800097014 | 5.46E-19 |
| UVM | IUPHAR | TMED2 | IDE | 0.801650418 | 4.15E-19 |
| UVM | IUPHAR | TMED2 | SLC35E3 | 0.8059063 | 1.94E-19 |
| UVM | IUPHAR | TMED2 | SLC30A6 | 0.822449824 | 8.43E-21 |
| UVM | TSG | TMED2 | DNAJA3 | 0.802324021 | 3.69E-19 |
Top |
|
| Protein 3D structure Visit iCn3D. |
Top |
|
| Protein-protein interaction networks * Overlap between up-regulated DEGs (log2FC<-1 and adj.P<0.05) and STRING PPI network (center: Translation factor, node: DEGs, edges: weighted by -log2(adj.P)) |
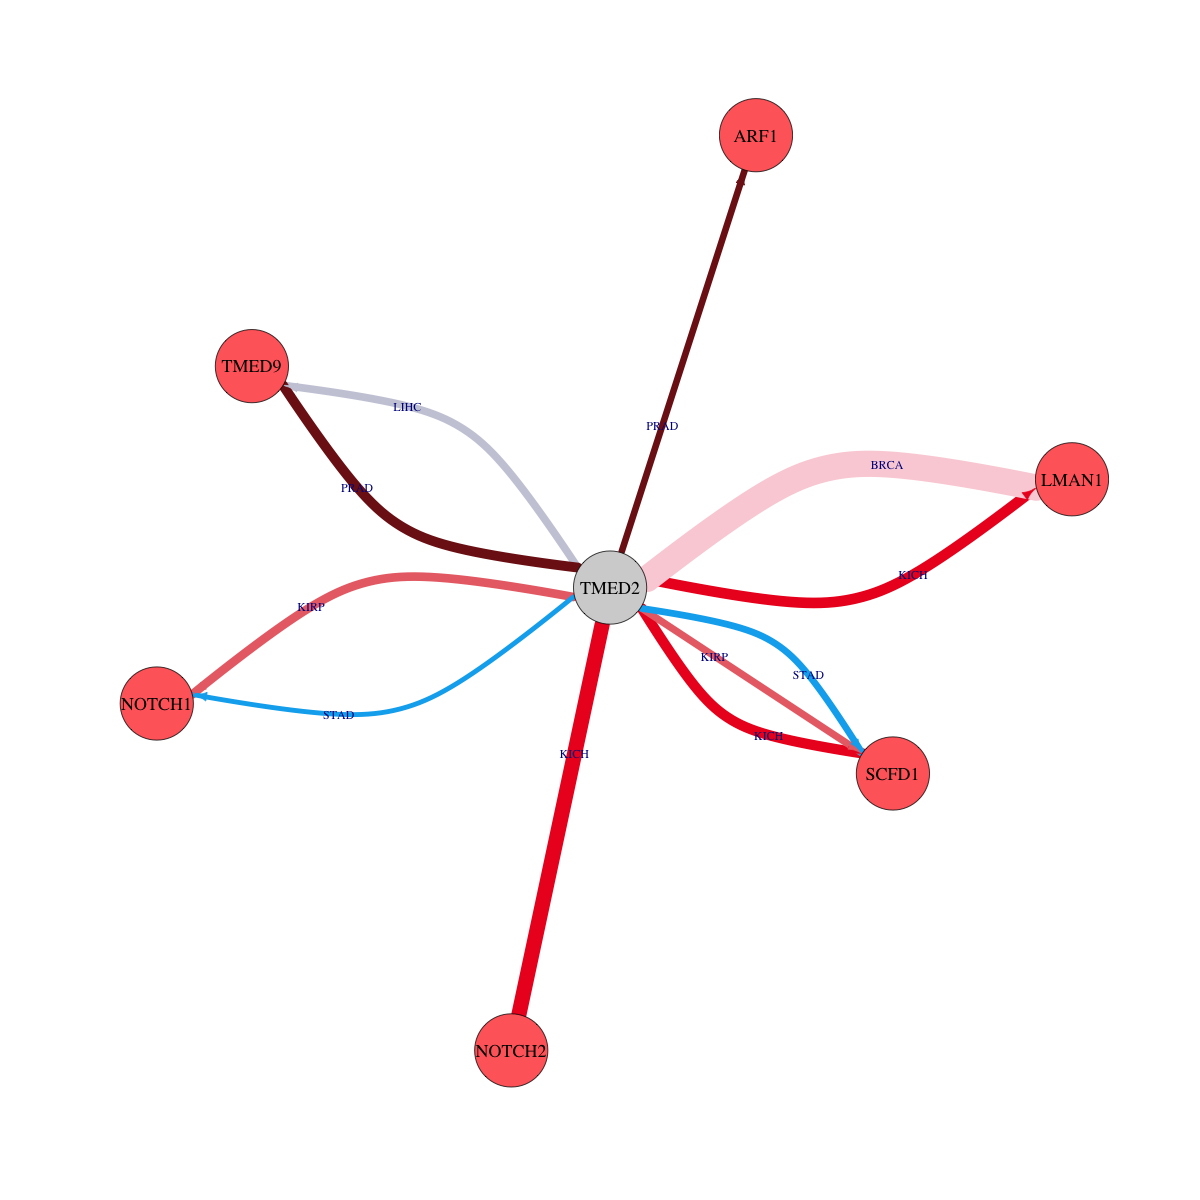 |
| Overlap between down-regulated DEGs (log2FC>1 and adj.P<0.05) and STRING PPI network (center: Translation factor, node: DEGs, edges: weighted by -log2(adj.P)) |
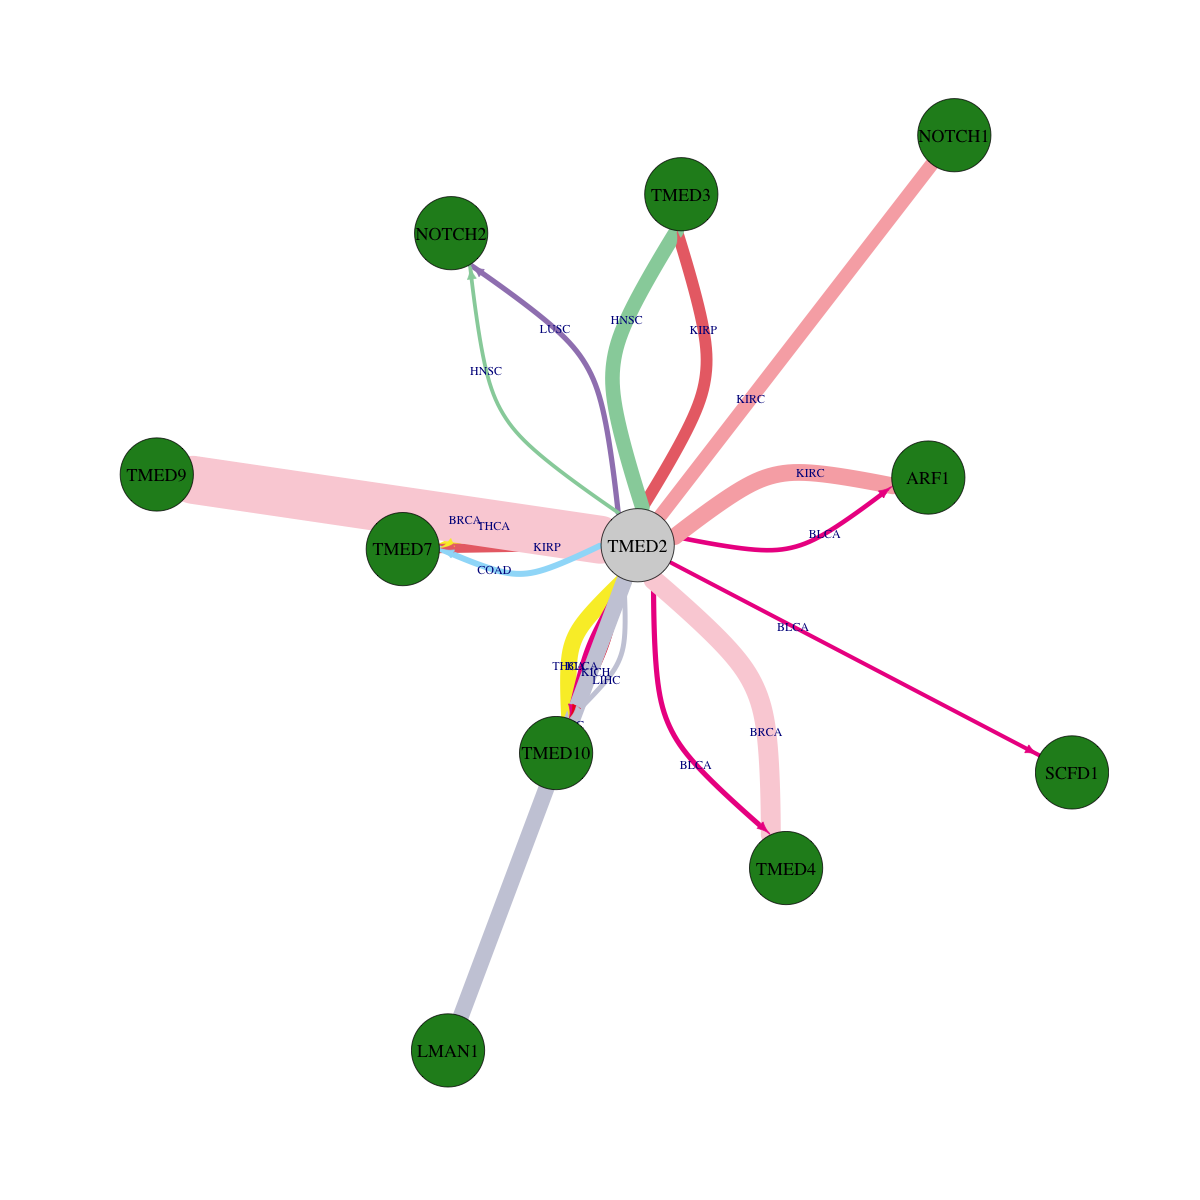 |
 * Edge colors based on TCGA cancer types. |
| * Overlap between DEGs (log2FC>1 and adj.P<0.05) and STRING PPI network per cancer (center: Translation factor, node: DEGs, node color: log2FC, edges: weighted by -log2(adj.P)) |
 |
| Cancer type | Translation factor | Interacting protein coding gene | FC | adj.pval |
| PRAD | TMED2 | TMED9 | 1.52305630485258 | 0.000110686569292389 |
| KIRP | TMED2 | TMED7 | -4.96458336532143 | 0.000177780166268349 |
| THCA | TMED2 | TMED7 | -1.18842245190368 | 0.000184004079391529 |
| KIRP | TMED2 | NOTCH1 | 2.42717060781601 | 0.000334546435624361 |
| LIHC | TMED2 | TMED9 | 1.27624924626935 | 0.000837680065881122 |
| KIRP | TMED2 | SCFD1 | 1.71013810252937 | 0.00133262807503343 |
| STAD | TMED2 | SCFD1 | 1.98803301799122 | 0.00192895717918873 |
| PRAD | TMED2 | ARF1 | 1.25327075473145 | 0.00224782609453915 |
| COAD | TMED2 | TMED7 | -2.76841912505026 | 0.00390031933784485 |
| BLCA | TMED2 | TMED10 | -1.75880699412505 | 0.00391769409179688 |
| LUSC | TMED2 | NOTCH2 | -2.40370704331476 | 0.00765883184752251 |
| BLCA | TMED2 | TMED4 | -2.63520977431679 | 0.00823211669921875 |
| LIHC | TMED2 | TMED10 | -10.9431952070679 | 0.0105240117726964 |
| STAD | TMED2 | NOTCH1 | 1.53524076803986 | 0.0111397774890065 |
| BLCA | TMED2 | ARF1 | -2.85492040338458 | 0.014068603515625 |
| BLCA | TMED2 | SCFD1 | -2.80983082393531 | 0.0229873657226562 |
| HNSC | TMED2 | NOTCH2 | -2.74060158635258 | 0.0301271170746986 |
| KICH | TMED2 | TMED10 | -1.5749810971249 | 0.0318078398704529 |
| BRCA | TMED2 | TMED4 | -2.0648208914464 | 1.06097090545132e-08 |
| HNSC | TMED2 | TMED3 | -1.91925251290308 | 1.37760207508109e-06 |
| KIRP | TMED2 | TMED3 | -1.73469503524547 | 1.80229544639588e-05 |
| KIRC | TMED2 | ARF1 | -1.3497769633198 | 1.88365218821087e-07 |
| THCA | TMED2 | TMED10 | -3.09421108482075 | 2.69027427455582e-07 |
| BRCA | TMED2 | LMAN1 | 1.86923174354104 | 2.92764034831899e-11 |
| KIRC | TMED2 | NOTCH1 | -2.64675932514903 | 3.2413838720108e-06 |
| LIHC | TMED2 | LMAN1 | -1.28943371397605 | 3.4520382341717e-07 |
| KICH | TMED2 | LMAN1 | 1.44685942277428 | 5.38825988769531e-05 |
| BRCA | TMED2 | TMED9 | -3.09752077578269 | 5.68656170814884e-20 |
| KICH | TMED2 | SCFD1 | 1.7973677375698 | 7.49826431274414e-05 |
| KICH | TMED2 | NOTCH2 | 2.1975198671307 | 8.34465026855468e-07 |
| Protein-protein interactors with this translation factor (BIOGRID-3.4.160) |
| PPI interactors with TMED2 |
| GORASP2, GORASP1, GOLGA2, Gorasp1, ELAVL1, TMED4, SDHB, LMAN1, TMED9, SEC23B, UBL4A, AKT2, TMED10, TMED3, CHST8, ERGIC1, HNRNPUL1, HSD17B12, RPS10, TM9SF4, ATP1A1, EIF3I, LMAN2, RAB1A, RAB1B, LOC101929876, RPS26, SRPRB, MED20, TCTN3, CEP128, TCTN1, Tmed10, FAF2, PTAR1, GOLGB1, TMED7, DNAJC30, USP22, FGFRL1, ATP9A, PNPT1, TMED1, LIPG, OSBPL6, ATP8B2, ATP12A, TMED5, PTPRO, LNX1, ESR2, AGR2, RECQL4, KIAA1429, KRAS, CYB5R3, TOMM6, NOD2, CALR3, FANCD2, M, ORF7b, RAB5A, EMC1, EMC2, MMGT1, nsp4, nsp5, nsp6, ORF6, E, ESR1, ORF8, ORF7a, HSCB, CIT, PRC1, FASN, NR3C1, DNAJC25, PMAIP1, DDRGK1, CALU, LRRC59, PDIA4, SEC61B, SYNE3, VAPA, FGF3, CDK5RAP3, HERC5, CTXN1, ZDHHC13, CYBA, ERGIC2, SMPD2, PA2G4, MAGT1, UQCRH, ERGIC3, SPPL2B, EMC7, TMEM106B, CNR2, KLF16, KLF8, |
Top |
|
| Clinically associated variants from ClinVar. |
| Gene | Chr | Position | RefSeq | VarSeq | RefSeeq | VarType | Pathogenic | Disease | VarInfo |
| nsSNVs with sample frequency (size of circle) from TCGA 33 cancers. |
 |
| SNVs and Indels |
| Gene | Cancer type | Chromosome | Start | End | RefSeeq | MutSeq | Mutation type | AAchange | # samples |
| TMED2 | SKCM | chr12 | 124071410 | 124071410 | C | T | Silent | p.S99S | 2 |
| TMED2 | BRCA | chr12 | 124074976 | 124074976 | G | A | Missense_Mutation | p.R154Q | 2 |
| TMED2 | UCEC | chr12 | 124071385 | 124071385 | A | G | Missense_Mutation | p.K91R | 2 |
| TMED2 | SKCM | chr12 | 124081261 | 124081261 | C | T | Silent | p.V197V | 2 |
| TMED2 | UCEC | chr12 | 124071422 | 124071422 | A | T | Silent | p.P103 | 2 |
| TMED2 | BRCA | chr12 | 124081212 | 124081212 | T | A | Missense_Mutation | p.V181D | 2 |
| TMED2 | UCEC | chr12 | 124081218 | 124081223 | TGACAT | - | In_Frame_Del | p.TL184in_frame_del | 2 |
| TMED2 | STAD | chr12 | 124069277 | 124069277 | T | C | Missense_Mutation | p.C32R | 2 |
| TMED2 | STAD | chr12 | 124074954 | 124074954 | G | A | Missense_Mutation | p.E147K | 2 |
| TMED2 | STAD | chr12 | 124074934 | 124074934 | C | T | Missense_Mutation | p.A140V | 2 |
| TMED2 | KIRC | chr12 | 124069276 | 124069276 | G | A | Silent | p.E31E | 2 |
| TMED2 | SARC | chr12 | 124069230 | 124069230 | C | T | Missense_Mutation | p.A16V | 2 |
| TMED2 | UCEC | chr12 | 124071320 | 124071320 | T | G | Missense_Mutation | p.I69M | 2 |
| TMED2 | UCEC | chr12 | 124071330 | 124071330 | G | A | Missense_Mutation | p.D73N | 2 |
| TMED2 | UCEC | chr12 | 124071336 | 124071336 | G | T | Nonsense_Mutation | p.E75* | 2 |
| TMED2 | LUAD | chr12 | 124071432 | 124071432 | A | T | Missense_Mutation | p.M107L | 1 |
| TMED2 | LUSC | chr12 | 124074954 | 124074954 | G | T | Nonsense_Mutation | p.E147* | 1 |
| TMED2 | MESO | chr12 | 124069211 | 124069211 | C | G | Missense_Mutation | 1 | |
| TMED2 | SKCM | chr12 | 124081262 | 124081262 | C | T | Missense_Mutation | p.R198W | 1 |
| TMED2 | CHOL | chr12 | 124069354 | 124069354 | C | T | Silent | 1 | |
| TMED2 | MESO | chr12 | 124069211 | 124069211 | C | G | Missense_Mutation | p.L10V | 1 |
| TMED2 | SKCM | chr12 | 124081200 | 124081200 | C | T | Missense_Mutation | p.A177V | 1 |
| TMED2 | CHOL | chr12 | 124071376 | 124071376 | G | T | Missense_Mutation | 1 | |
| TMED2 | SARC | chr12 | 124071371 | 124071371 | G | T | Translation_Start_Site | 1 | |
| TMED2 | CHOL | chr12 | 124071376 | 124071376 | G | T | Missense_Mutation | p.G88V | 1 |
| TMED2 | SARC | chr12 | 124071360 | 124071360 | G | T | Missense_Mutation | 1 | |
| TMED2 | HNSC | chr12 | 124069243 | 124069243 | C | G | Silent | 1 | |
| TMED2 | SARC | chr12 | 124069230 | 124069230 | C | T | Missense_Mutation | 1 | |
| TMED2 | HNSC | chr12 | 124069243 | 124069243 | C | G | Silent | p.G20G | 1 |
| TMED2 | SARC | chr12 | 124069231 | 124069231 | C | T | Silent | 1 | |
| TMED2 | UCEC | chr12 | 124081218 | 124081223 | TGACAT | - | In_Frame_Del | p.TL184del | 1 |
| TMED2 | KIRC | chr12 | 124069310 | 124069310 | A | G | Missense_Mutation | p.M43V | 1 |
| TMED2 | SARC | chr12 | 124069231 | 124069231 | C | T | Silent | p.A16A | 1 |
| TMED2 | BLCA | chr12 | 124069350 | 124069350 | A | G | Missense_Mutation | 1 | |
| TMED2 | LIHC | chr12 | 124069288 | 124069288 | G | T | Missense_Mutation | 1 | |
| TMED2 | SARC | chr12 | 124069231 | 124069231 | C | T | Silent | p.A16 | 1 |
| TMED2 | BLCA | chr12 | 124069350 | 124069350 | A | G | Missense_Mutation | p.D56G | 1 |
| Copy number variation (CNV) of TMED2 * Click on the image to open the original image in a new window. |
 |
| Fusion gene breakpoints (product of the structural variants (SVs)) across TMED2 * Click on the image to open the UCSC genome browser with custom track showing this image in a new window. |
 |
| Fusion genes with this translation factor from FusionGDB2.0. |
| FusionGDB2 ID | Disease | Sample | Hgene | Hchr | Hbp | Hstrand | Tgene | Tchr | Tbp | Tstrand |
| 91451 | STAD | TCGA-BR-8364-01A | CLIP1 | chr12 | 122861936 | - | TMED2 | chr12 | 124081152 | + |
| 91451 | N/A | AX188335 | CMTM4 | chr16 | 66697019 | + | TMED2 | chr12 | 124081799 | - |
| 91451 | N/A | BE858941 | MDK | chr11 | 46405298 | - | TMED2 | chr12 | 124081861 | - |
| 91451 | BRCA | TCGA-LD-A7W6-01A | PCBP2 | chr12 | 53862616 | + | TMED2 | chr12 | 124082475 | + |
| 91451 | N/A | EC573613 | RP11-445O3.2 | chr5 | 4546969 | + | TMED2 | chr12 | 124082289 | + |
| 91452 | N/A | AX184750 | TMED2 | chr12 | 124081799 | + | CMTM4 | chr16 | 66697019 | - |
| 102664 | LUAD | TCGA-86-6851-01A | TMED2 | chr12 | 124074996 | + | FAM101A | chr12 | 124796364 | + |
| 101073 | N/A | AX395954 | TMED2 | chr12 | 124082631 | + | LGR5 | chr12 | 71978829 | - |
| 92317 | BRCA | TCGA-A8-A08L-01A | TMED2 | chr12 | 124074996 | + | MTCP1 | chrX | 154293812 | - |
| 91452 | N/A | DA857875 | TMED2 | chr12 | 124069276 | + | PARM1 | chr4 | 75858327 | + |
| 98007 | N/A | BM752192 | TMED2 | chr12 | 124082124 | + | PPIA | chr7 | 44836280 | + |
| 100924 | N/A | AX341547 | TMED2 | chr12 | 124081633 | + | PPP2R5E | chr14 | 63840897 | + |
| 91452 | N/A | AA469160 | TMED2 | chr12 | 124083129 | + | SYN3 | chr22 | 33082398 | - |
| 100772 | STAD | TCGA-BR-A4PE-01A | TMED2 | chr12 | 124074996 | + | TGIF1 | chr18 | 3456352 | + |
| 91452 | N/A | AA533651 | TMED2 | chr12 | 124081419 | + | TMED2 | chr12 | 124081353 | - |
| 91452 | N/A | AI791655 | TMED2 | chr12 | 124081353 | + | TMED2 | chr12 | 124081419 | - |
| 91452 | N/A | BQ776227 | TMED2 | chr12 | 124071308 | - | TMED2 | chr12 | 124069247 | + |
| 100388 | N/A | CF125471 | TMED2 | chr12 | 124071482 | + | WLS | chr1 | 68698039 | - |
Top |
|
| Kaplan-Meier plots with logrank tests of overall survival (OS) |
 |
| Cancer type | Translation factor | Coefficent | Hazard ratio | Wald test pval | Likelihool ratio pval | Logrank test pval | # samples |
Top |
|
| Differential gene expression between female and male. (Wilcoxon test, pval<0.05) |
 |
| Cancer type | Translation factor | pval | adj.p |
| KIRP | TMED2 | 0.00384037036160169 | 0.11 |
| LUAD | TMED2 | 0.0347211684342591 | 0.94 |
Top |
|
| Differential gene expression between young and old age groups (Wilcoxon test, pval<0.05) |
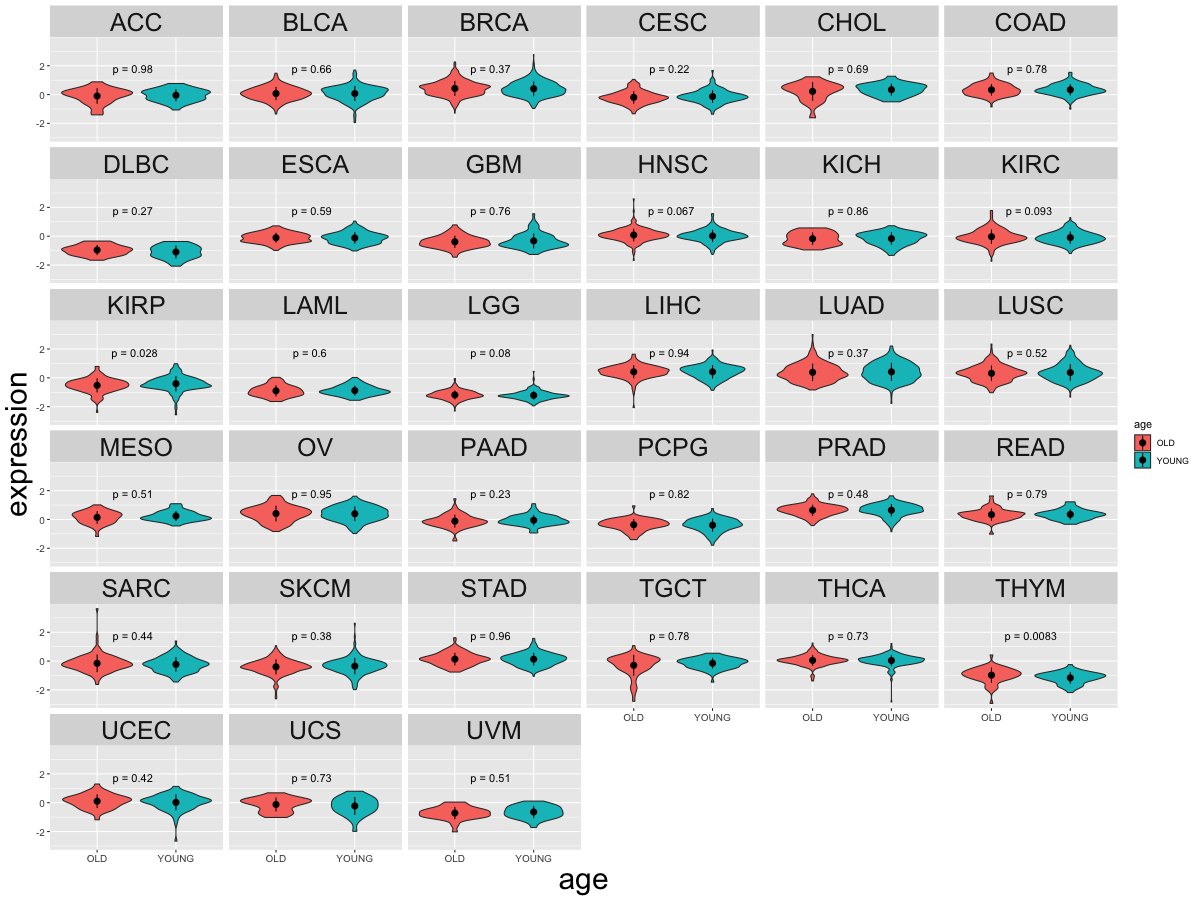 |
| Cancer type | Translation factor | pval | adj.p |
| KIRP | TMED2 | 0.0277689923128327 | 0.89 |
| THYM | TMED2 | 0.00825935614471309 | 0.27 |
Top |
|
| Drugs targeting genes involved in this translation factor. (DrugBank Version 5.1.8 2021-05-08) |
| UniProtAcc | DrugBank ID | Drug name | Drug activity | Drug type | Drug status |
Top |
|
| Diseases associated with this translation factor. (DisGeNet 4.0) |
| Disease ID | Disease Name | # PubMeds | Disease source |
| C0151744 | Myocardial Ischemia | 1 | CTD_human |
(UTHealth)
Web File Viewing | Emergency Information |Campus Carry|Site Policies