
|
||||||
|

Translation Factor: GCN1 (NCBI Gene ID:10985) |
|
 Gene Summary Gene Summary |
| Gene Information | Gene Name: GCN1 | Gene ID: 10985 | Gene Symbol | GCN1 | Gene ID | 10985 |
| Gene Name | GCN1 activator of EIF2AK4 | |
| Synonyms | GCN1L|GCN1L1|PRIC295 | |
| Cytomap | 12q24.23 | |
| Type of Gene | protein-coding | |
| Description | eIF-2-alpha kinase activator GCN1GCN1 (general control of amino-acid synthesis 1, yeast)-like 1GCN1 eIF-2-alpha kinase activator homologGCN1 general control of amino-acid synthesis 1-like 1GCN1, eIF2 alpha kinase activator homologGCN1-like protein 1 | |
| Modification date | 20200313 | |
| UniProtAcc | Q92616 | |
| Child GO biological process term(s) under GO:0006412 |
| GO ID | GO term |
| GO:0006417 | Regulation of translation |
| GO:0008135 | Translation factor activity, RNA binding |
| GO:0005840 | Ribosome |
| GO:0006412 | Translation |
| Gene ontology of translaction factor with evidence of Inferred from Direct Assay (IDA) from Entrez |
| Partner | Gene | GO ID | GO term | PubMed ID |
| Inferred gene age of translation factor. |
| Gene | Inferred gene age group among (0 - 67.6], (67.6 - 355.7], (355.7 - 733], (733 - 1119.25], >1119.25 |
| GCN1 | >1119.25 |
Top |
|
| We searched PubMed using 'GCN1[title] AND translation [title] AND human.' |
| Gene | Title | PMID |
| GCN1 | GCN1, a translational activator of GCN4 in Saccharomyces cerevisiae, is required for phosphorylation of eukaryotic translation initiation factor 2 by protein kinase GCN2 | 8497269 |
Top |
|
| Skipped exons in TCGA and GTEx based on Ensembl gene isoform structure. * Click on the image to open the UCSC genome browser with custom track showing this image in a new window. For more annotations, please visit our ExonSkipDB. |
 |
| Open reading frame (ORF) analsis of exon skipping events based on Ensembl gene isoform structure. * Click on the break point to see the gene structure around the break point region using the UCSC Genome Browser. |
| ENST | Exon skip start (DNA) | Exon Skip end (DNA) | ORF |
| ENST00000300648 | 120567079 | 120567298 | In-frame |
| ENST00000300648 | 120568988 | 120569137 | Frame-shift |
| ENST00000300648 | 120576126 | 120576219 | In-frame |
| ENST00000300648 | 120578662 | 120578827 | In-frame |
| ENST00000300648 | 120580310 | 120580526 | In-frame |
| ENST00000300648 | 120582442 | 120582639 | Frame-shift |
| ENST00000300648 | 120584855 | 120585076 | Frame-shift |
| ENST00000300648 | 120585970 | 120586150 | In-frame |
| ENST00000300648 | 120587409 | 120587524 | Frame-shift |
| ENST00000300648 | 120588948 | 120589195 | Frame-shift |
| ENST00000300648 | 120591016 | 120591211 | In-frame |
| ENST00000300648 | 120600650 | 120600775 | Frame-shift |
| ENST00000300648 | 120602139 | 120602299 | Frame-shift |
| ENST00000300648 | 120607972 | 120608125 | In-frame |
| ENST00000300648 | 120611456 | 120611630 | In-frame |
| ENST00000300648 | 120612964 | 120613015 | In-frame |
| ENST00000300648 | 120621371 | 120621480 | Frame-shift |
| Exon skipping position in the amino acid sequence. |
| ENST | Exon skip start (DNA) | Exon Skip end (DNA) | Len(transcript seq) | Exon skip start (mRNA) | Exon Skip end (mRNA) | Len(amino acid seq) | Exon skip start (AA) | Exon Skip end (AA) |
| Potentially (partially) lost protein functional features of UniProt. |
| UniProtAcc | Exon skip start (AA) | Exon Skip end (AA) | Function feature start (AA) | Function feature end (AA) | Functional feature type | Functional feature desc. |
Top |
|
| Gene expression level across TCGA pancancer |
 |
| Gene expression level across GTEx pantissue |
 |
| Expression level of gene isoforms across TCGA pancancer |
 |
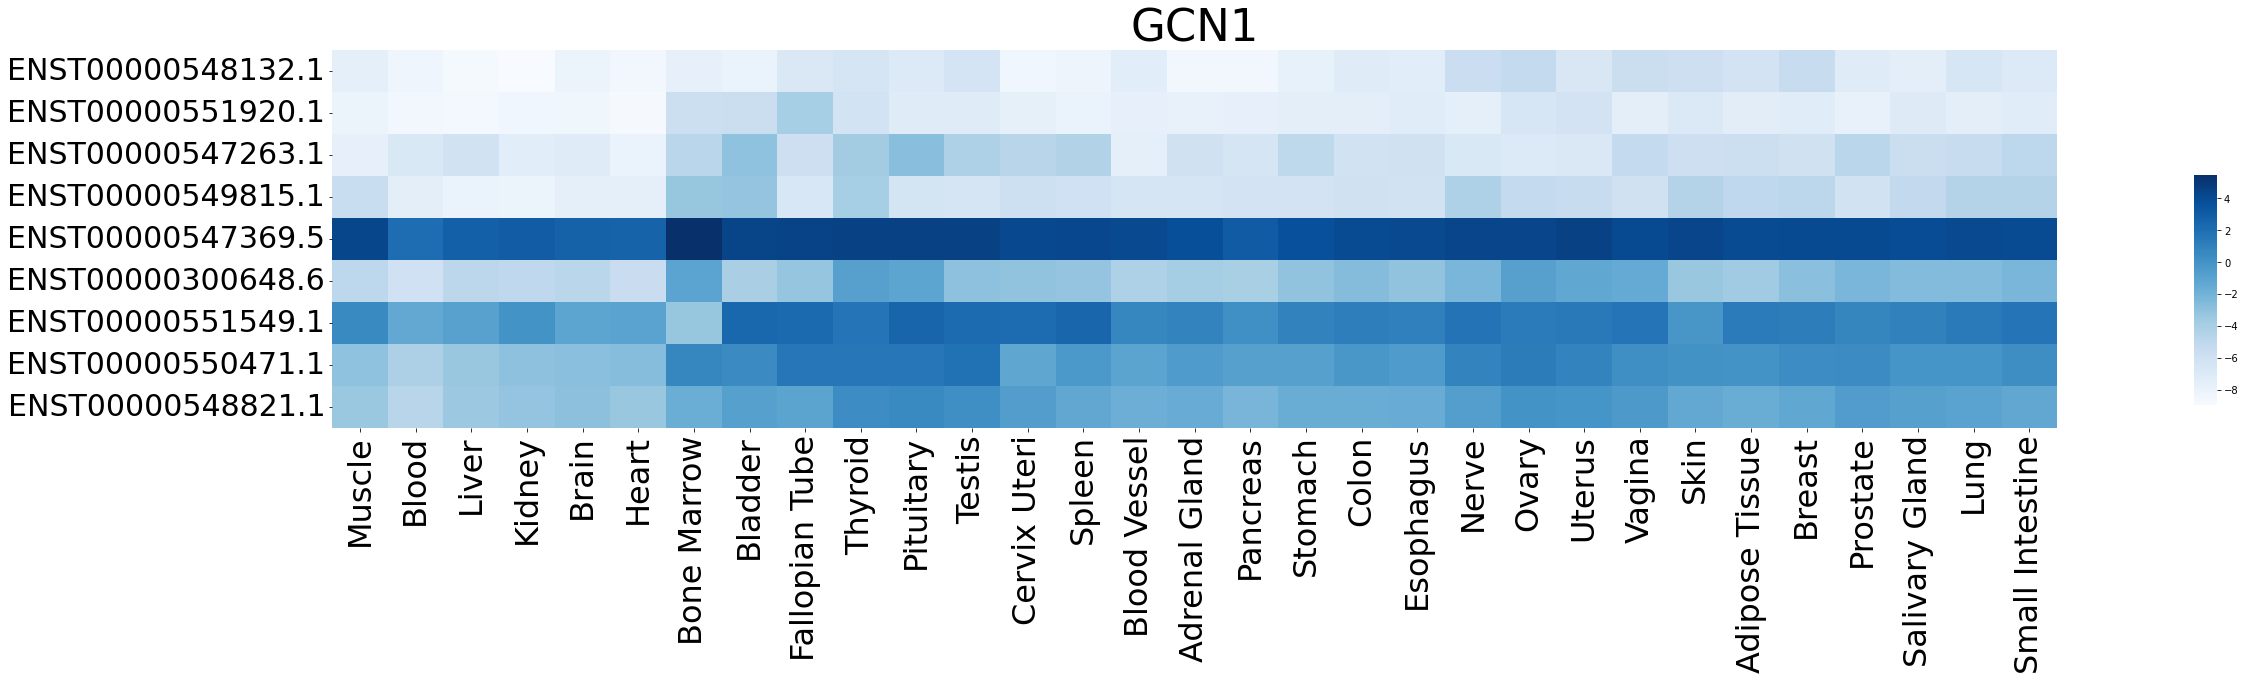
| Expression level of gene isoforms across GTEx pantissue |
 |
| Cancer(tissue) type-specific expression level of Translation factor using z-score distriution |
| Differential expression between tumor and matched normal (in the cancer types with more than 10 matched samples) |
| Cancer type | Translation factor | FC | adj.pval |
Top |
|
| Translation factor expression regulation through miRNA binding |
| Cancer type | Gene | miRNA | TargetScan binding score (Context++ score percentile) | Coefficient | Pvalue |
| Translation factor expression regulation through methylation in the promoter of Translation factor |
| Cancer type | Gene | methyl group b | methyl group a | DEG pval | avg methyl in b | avg methyl in a | avg exp in b | avg exp in a |
| Translation factor expression regulation through methylation in the gene body of Translation factor (positive regulation) |
| Cancer type | Gene | methyl group b | methyl group a | DEG pval | avg methyl in b | avg methyl in a | avg exp in b | avg exp in a |
| Translation factor expression regulation through copy number variation of Translation factor |
| Cancer type | Gene | Coefficient | Pvalue |
Top |
|
| Strongly correlated genes belong to cellular important gene groups with GCN1 (coefficient>0.8, pval<0.05, node color based on FC between tumor and matched normal). Significantly associated important genes in the individual cancer types. * Cell metabolism gene: cell metabolism genes from REACTOME (black edge), IUPHAR: drug target genes from IUPHAR (blue edge), Kinase: human kinase genes (brown edge), CGC: cancer gene census genes (orange edge), TSG: tumor suppresor genes (purple edge), Epifactor: epigenetic factors (light blue edge), TF: transcription factors (green) |
| Cancer type | Gene group | Translation factor | Correlated gene | Coefficient | Pvalue |
Top |
|
| Protein 3D structure Visit iCn3D. |
Top |
|
| Protein-protein interaction networks * Overlap between up-regulated DEGs (log2FC<-1 and adj.P<0.05) and STRING PPI network (center: Translation factor, node: DEGs, edges: weighted by -log2(adj.P)) |
 |
| Overlap between down-regulated DEGs (log2FC>1 and adj.P<0.05) and STRING PPI network (center: Translation factor, node: DEGs, edges: weighted by -log2(adj.P)) |
 |
 * Edge colors based on TCGA cancer types. |
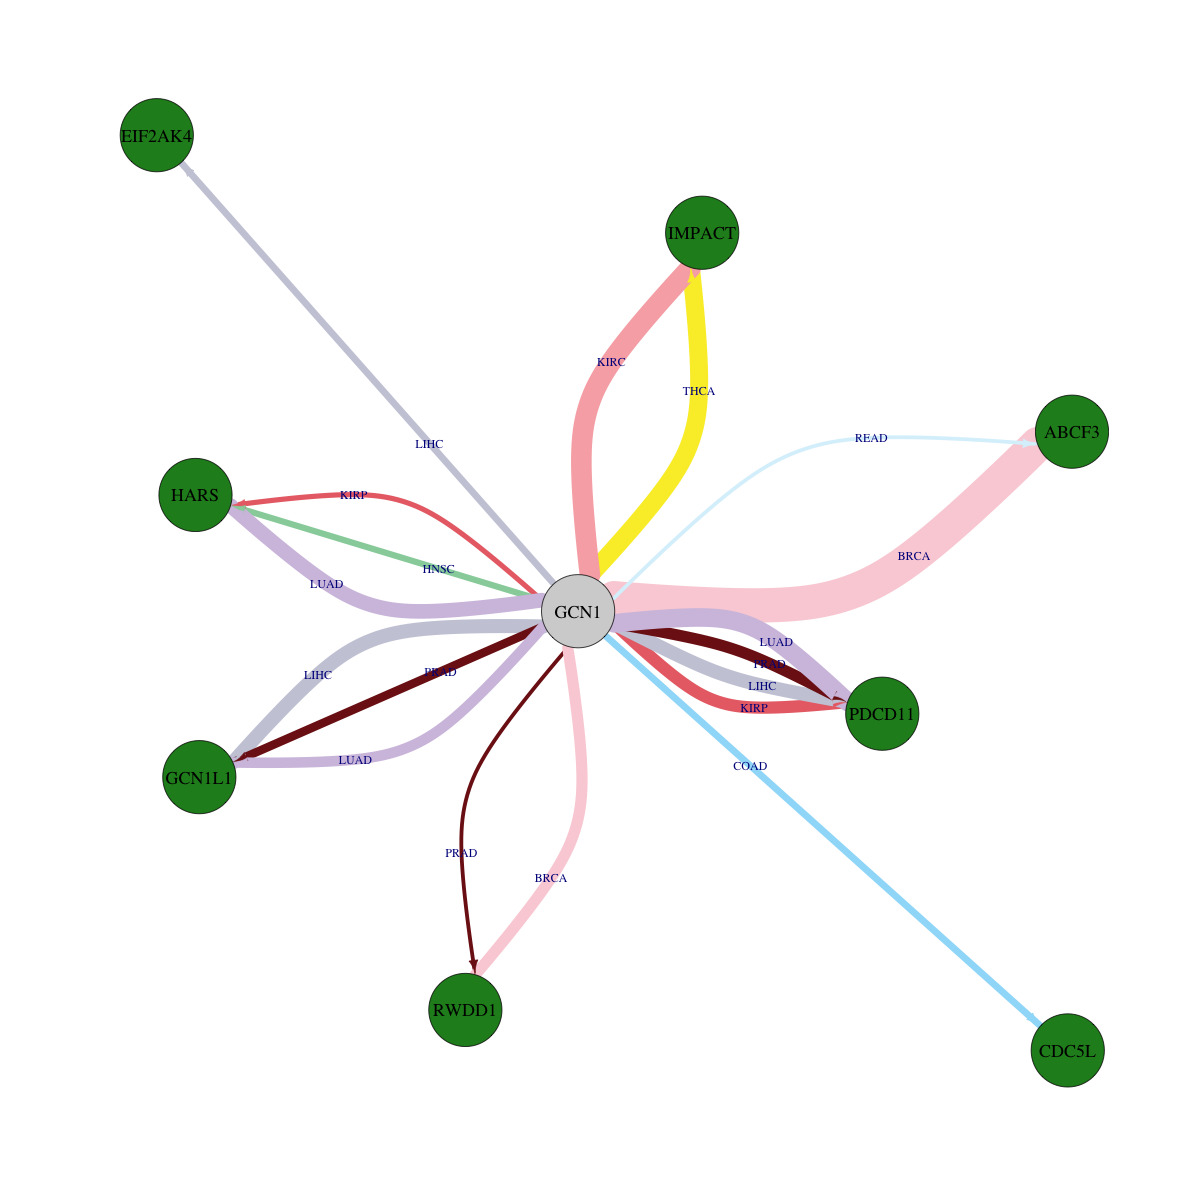
| * Overlap between DEGs (log2FC>1 and adj.P<0.05) and STRING PPI network per cancer (center: Translation factor, node: DEGs, node color: log2FC, edges: weighted by -log2(adj.P)) |
 |
| Cancer type | Translation factor | Interacting protein coding gene | FC | adj.pval |
| KIRC | GCN1 | ABCF3 | 1.57342358718948 | 0.000111704804180407 |
| PRAD | GCN1 | GCN1L1 | -7.54173196078564 | 0.000376184722398862 |
| HNSC | GCN1 | PDCD11 | 1.1576993328686 | 0.000457517129916597 |
| KIRC | GCN1 | GCN1L1 | 1.52944128066025 | 0.00150654978717842 |
| COAD | GCN1 | CDC5L | -2.92762646435926 | 0.00177955627441406 |
| LIHC | GCN1 | EIF2AK4 | -4.60322890059861 | 0.00188131470650586 |
| LUSC | GCN1 | EIF2AK4 | 1.88005113022765 | 0.00283162168555847 |
| HNSC | GCN1 | HARS | -2.05994086045496 | 0.00315447678462988 |
| KIRP | GCN1 | HARS | -3.70132649523515 | 0.00828406633809209 |
| ESCA | GCN1 | RWDD1 | 1.43074573953025 | 0.009765625 |
| PRAD | GCN1 | RWDD1 | -1.37015889011473 | 0.0291755363147523 |
| READ | GCN1 | ABCF3 | -1.46660121803869 | 0.03125 |
| KIRP | GCN1 | PDCD11 | -3.74602677033508 | 1.26352533698082e-05 |
| LUAD | GCN1 | HARS | -1.63766770445137 | 1.3051538867775e-06 |
| BRCA | GCN1 | ABCF3 | -1.6741757288867 | 1.61441769134359e-14 |
| LIHC | GCN1 | GCN1L1 | -1.50546993282376 | 2.24402029682138e-06 |
| PRAD | GCN1 | PDCD11 | -2.43526550769205 | 2.63584504192372e-05 |
| BRCA | GCN1 | RWDD1 | -1.13785288766259 | 3.18183978181012e-05 |
| LIHC | GCN1 | PDCD11 | -2.41235352776738 | 3.27330247270532e-06 |
| LUAD | GCN1 | PDCD11 | -4.69170701764213 | 3.38432712902826e-08 |
| KICH | GCN1 | CDC5L | 1.66472252294517 | 3.814697265625e-05 |
| KIRC | GCN1 | IMPACT | -1.40484482677706 | 5.43236941674465e-09 |
| BRCA | GCN1 | DRG2 | 1.55172876221269 | 5.83844264602967e-05 |
| LUAD | GCN1 | GCN1L1 | -3.11494072871482 | 5.86248556550202e-05 |
| THCA | GCN1 | IMPACT | -1.884329406612 | 6.1058683335902e-08 |
| Protein-protein interactors with this translation factor (BIOGRID-3.4.160) |
| PPI interactors with GCN1 |
| RAD23A, IMPACT, UBC, |
Top |
|
| Clinically associated variants from ClinVar. |
| Gene | Chr | Position | RefSeq | VarSeq | RefSeeq | VarType | Pathogenic | Disease | VarInfo |
| GCN1 | chr12 | 120574342 | C | T | single_nucleotide_variant | Likely_benign | not_provided | SO:0001819|synonymous_variant | SO:0001819|synonymous_variant |
| GCN1 | chr12 | 120575400 | G | A | single_nucleotide_variant | Benign | not_provided | SO:0001819|synonymous_variant | SO:0001819|synonymous_variant |
| GCN1 | chr12 | 120576227 | G | C | single_nucleotide_variant | Benign | not_provided | SO:0001627|intron_variant | SO:0001627|intron_variant |
| GCN1 | chr12 | 120576637 | G | A | single_nucleotide_variant | Benign | not_provided | SO:0001819|synonymous_variant | SO:0001819|synonymous_variant |
| GCN1 | chr12 | 120580323 | T | C | single_nucleotide_variant | Benign | not_provided | SO:0001819|synonymous_variant | SO:0001819|synonymous_variant |
| GCN1 | chr12 | 120593094 | G | T | single_nucleotide_variant | Uncertain_significance | Arthrogryposis_multiplex_congenita|Fetal_akinesia_sequence | SO:0001583|missense_variant | SO:0001583|missense_variant |
| GCN1 | chr12 | 120596337 | C | T | single_nucleotide_variant | Benign | not_provided | SO:0001819|synonymous_variant | SO:0001819|synonymous_variant |
| GCN1 | chr12 | 120599284 | G | A | single_nucleotide_variant | Benign | not_provided | SO:0001627|intron_variant | SO:0001627|intron_variant |
| GCN1 | chr12 | 120600645 | C | T | single_nucleotide_variant | Benign | not_provided | SO:0001627|intron_variant | SO:0001627|intron_variant |
| GCN1 | chr12 | 120611488 | G | A | single_nucleotide_variant | Likely_benign | not_provided | SO:0001819|synonymous_variant | SO:0001819|synonymous_variant |
| GCN1 | chr12 | 120612996 | A | G | single_nucleotide_variant | Likely_benign | not_provided | SO:0001819|synonymous_variant | SO:0001819|synonymous_variant |
| GCN1 | chr12 | 120616446 | G | A | single_nucleotide_variant | Benign | not_provided | SO:0001819|synonymous_variant | SO:0001819|synonymous_variant |
| GCN1 | chr12 | 120616697 | G | A | single_nucleotide_variant | Benign | not_provided | SO:0001819|synonymous_variant | SO:0001819|synonymous_variant |
| GCN1 | chr12 | 120622028 | C | T | single_nucleotide_variant | Benign | not_provided | SO:0001819|synonymous_variant | SO:0001819|synonymous_variant |
| GCN1 | chr12 | 120622633 | C | T | single_nucleotide_variant | Uncertain_significance | not_provided | SO:0001583|missense_variant | SO:0001583|missense_variant |
| nsSNVs with sample frequency (size of circle) from TCGA 33 cancers. |
| SNVs and Indels |
| Gene | Cancer type | Chromosome | Start | End | RefSeeq | MutSeq | Mutation type | AAchange | # samples |
| Copy number variation (CNV) of GCN1 * Click on the image to open the original image in a new window. |
 |
| Fusion gene breakpoints (product of the structural variants (SVs)) across GCN1 * Click on the image to open the UCSC genome browser with custom track showing this image in a new window. |
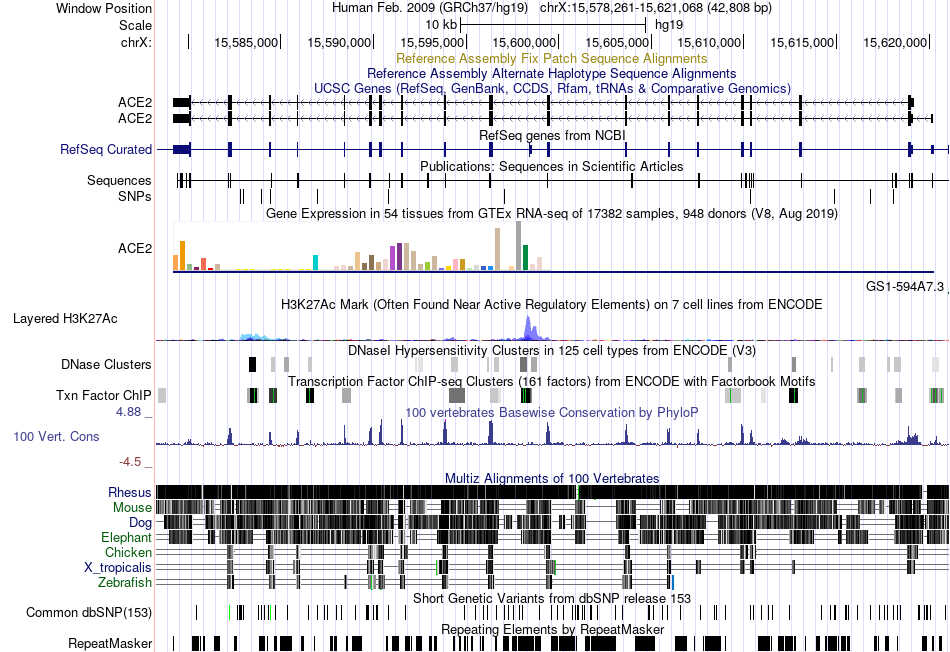 |
| Fusion genes with this translation factor from FusionGDB2.0. |
| FusionGDB2 ID | Disease | Sample | Hgene | Hchr | Hbp | Hstrand | Tgene | Tchr | Tbp | Tstrand |
Top |
|
| Kaplan-Meier plots with logrank tests of overall survival (OS) |
| Cancer type | Translation factor | Coefficent | Hazard ratio | Wald test pval | Likelihool ratio pval | Logrank test pval | # samples |
Top |
|
| Differential gene expression between female and male. (Wilcoxon test, pval<0.05) |
| Cancer type | Translation factor | pval | adj.p |
Top |
|
| Differential gene expression between young and old age groups (Wilcoxon test, pval<0.05) |
| Cancer type | Translation factor | pval | adj.p |
Top |
|
| Drugs targeting genes involved in this translation factor. (DrugBank Version 5.1.8 2021-05-08) |
| UniProtAcc | DrugBank ID | Drug name | Drug activity | Drug type | Drug status |
Top |
|
| Diseases associated with this translation factor. (DisGeNet 4.0) |
| Disease ID | Disease Name | # PubMeds | Disease source |
(UTHealth)
Web File Viewing | Emergency Information |Campus Carry|Site Policies