
|
||||||
|

Translation Factor: NIBAN1 (NCBI Gene ID:116496) |
|
 Gene Summary Gene Summary |
| Gene Information | Gene Name: NIBAN1 | Gene ID: 116496 | Gene Symbol | NIBAN1 | Gene ID | 116496 |
| Gene Name | niban apoptosis regulator 1 | |
| Synonyms | C1orf24|FAM129A|GIG39|NIBAN | |
| Cytomap | 1q25.3 | |
| Type of Gene | protein-coding | |
| Description | protein Niban 1cell growth-inhibiting gene 39 proteinfamily with sequence similarity 129 member Aprotein Niban | |
| Modification date | 20200313 | |
| UniProtAcc | Q9BZQ8 | |
| Child GO biological process term(s) under GO:0006412 |
| GO ID | GO term |
| GO:0006417 | Regulation of translation |
| GO:0045727 | Positive regulation of translation |
| GO:0006412 | Translation |
| Gene ontology of translaction factor with evidence of Inferred from Direct Assay (IDA) from Entrez |
| Partner | Gene | GO ID | GO term | PubMed ID |
| Inferred gene age of translation factor. |
| Gene | Inferred gene age group among (0 - 67.6], (67.6 - 355.7], (355.7 - 733], (733 - 1119.25], >1119.25 |
Top |
|
| We searched PubMed using 'NIBAN1[title] AND translation [title] AND human.' |
| Gene | Title | PMID |
| NIBAN1 | . | . |
Top |
|
| Skipped exons in TCGA and GTEx based on Ensembl gene isoform structure. * Click on the image to open the UCSC genome browser with custom track showing this image in a new window. For more annotations, please visit our ExonSkipDB. |
 |
| Open reading frame (ORF) analsis of exon skipping events based on Ensembl gene isoform structure. * Click on the break point to see the gene structure around the break point region using the UCSC Genome Browser. |
| ENST | Exon skip start (DNA) | Exon Skip end (DNA) | ORF |
| Exon skipping position in the amino acid sequence. |
| ENST | Exon skip start (DNA) | Exon Skip end (DNA) | Len(transcript seq) | Exon skip start (mRNA) | Exon Skip end (mRNA) | Len(amino acid seq) | Exon skip start (AA) | Exon Skip end (AA) |
| Potentially (partially) lost protein functional features of UniProt. |
| UniProtAcc | Exon skip start (AA) | Exon Skip end (AA) | Function feature start (AA) | Function feature end (AA) | Functional feature type | Functional feature desc. |
Top |
|
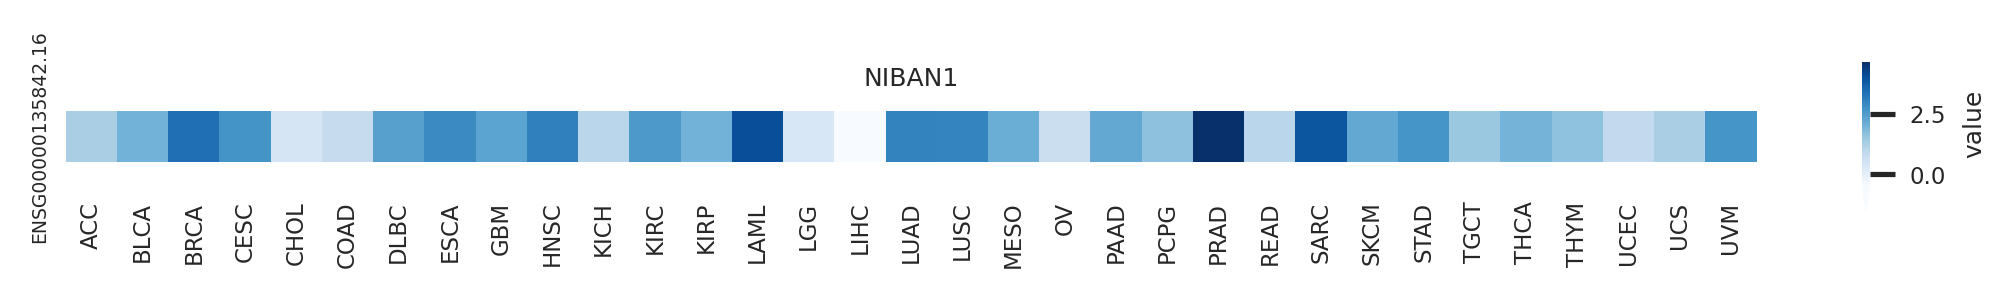
| Gene expression level across TCGA pancancer |
 |
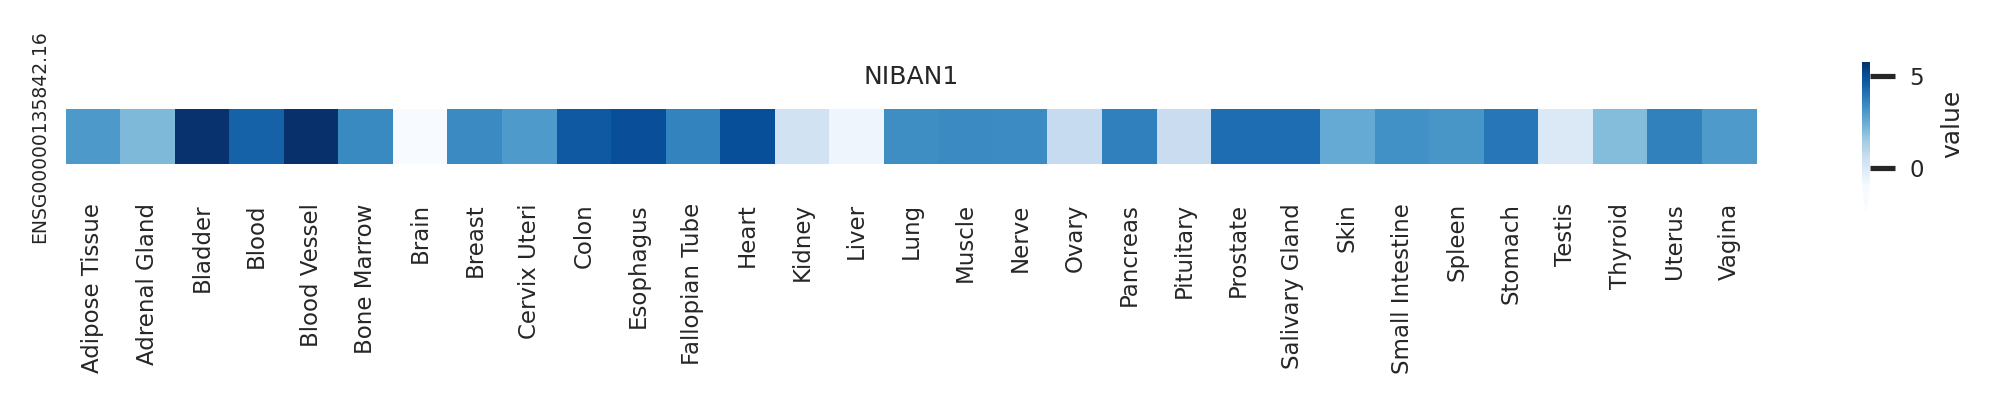
| Gene expression level across GTEx pantissue |
 |
| Expression level of gene isoforms across TCGA pancancer |
 |
| Expression level of gene isoforms across GTEx pantissue |
 |
| Cancer(tissue) type-specific expression level of Translation factor using z-score distriution |
| Differential expression between tumor and matched normal (in the cancer types with more than 10 matched samples) |
| Cancer type | Translation factor | FC | adj.pval |
Top |
|
| Translation factor expression regulation through miRNA binding |
| Cancer type | Gene | miRNA | TargetScan binding score (Context++ score percentile) | Coefficient | Pvalue |
| Translation factor expression regulation through methylation in the promoter of Translation factor |
| Cancer type | Gene | methyl group b | methyl group a | DEG pval | avg methyl in b | avg methyl in a | avg exp in b | avg exp in a |
| Translation factor expression regulation through methylation in the gene body of Translation factor (positive regulation) |
| Cancer type | Gene | methyl group b | methyl group a | DEG pval | avg methyl in b | avg methyl in a | avg exp in b | avg exp in a |
| Translation factor expression regulation through copy number variation of Translation factor |
| Cancer type | Gene | Coefficient | Pvalue |
Top |
|
| Strongly correlated genes belong to cellular important gene groups with NIBAN1 (coefficient>0.8, pval<0.05, node color based on FC between tumor and matched normal). Significantly associated important genes in the individual cancer types. * Cell metabolism gene: cell metabolism genes from REACTOME (black edge), IUPHAR: drug target genes from IUPHAR (blue edge), Kinase: human kinase genes (brown edge), CGC: cancer gene census genes (orange edge), TSG: tumor suppresor genes (purple edge), Epifactor: epigenetic factors (light blue edge), TF: transcription factors (green) |
| Cancer type | Gene group | Translation factor | Correlated gene | Coefficient | Pvalue |
Top |
|
| Protein 3D structure Visit iCn3D. |
Top |
|
| Protein-protein interaction networks * Overlap between up-regulated DEGs (log2FC<-1 and adj.P<0.05) and STRING PPI network (center: Translation factor, node: DEGs, edges: weighted by -log2(adj.P)) |
 |
| Overlap between down-regulated DEGs (log2FC>1 and adj.P<0.05) and STRING PPI network (center: Translation factor, node: DEGs, edges: weighted by -log2(adj.P)) |
 |
 * Edge colors based on TCGA cancer types. |
| * Overlap between DEGs (log2FC>1 and adj.P<0.05) and STRING PPI network per cancer (center: Translation factor, node: DEGs, node color: log2FC, edges: weighted by -log2(adj.P)) |
 |
| Cancer type | Translation factor | Interacting protein coding gene | FC | adj.pval |
| HNSC | NIBAN1 | ZBTB41 | -2.34541180752542 | 0.000102781329587742 |
| BRCA | NIBAN1 | CPXM1 | -1.11518034452414 | 0.000146624072026213 |
| KIRC | NIBAN1 | SLC29A3 | -2.05005742450566 | 0.000146865447473704 |
| ESCA | NIBAN1 | FAM129A | -2.28385813405423 | 0.0009765625 |
| ESCA | NIBAN1 | SYNPO2 | -2.57829690045592 | 0.0009765625 |
| HNSC | NIBAN1 | SYNPO2 | -3.68703264162584 | 0.00162476928903743 |
| BLCA | NIBAN1 | C1orf27 | -2.03052787829299 | 0.0033416748046875 |
| CHOL | NIBAN1 | GSDMC | -2.06845557962557 | 0.00390625 |
| STAD | NIBAN1 | C1orf27 | -1.40737562338759 | 0.0105091729201376 |
| THCA | NIBAN1 | FAM129A | -1.28793684499578 | 0.0123440204975421 |
| KICH | NIBAN1 | FAM129A | -1.33467612608367 | 0.0173123478889465 |
| BLCA | NIBAN1 | CPXM1 | -1.94310651752995 | 0.0229873657226562 |
| THCA | NIBAN1 | SLC29A3 | -2.00199842218488 | 0.0247345868615931 |
| PRAD | NIBAN1 | SLC29A3 | -1.39695412928717 | 0.0305494319135424 |
| READ | NIBAN1 | GSDMC | -1.20745317367677 | 0.03125 |
| BLCA | NIBAN1 | SLC29A3 | 2.85392985216935 | 0.0323410034179688 |
| KIRP | NIBAN1 | NPM1 | -1.08489981969787 | 0.0324882394634187 |
| ESCA | NIBAN1 | CPXM1 | -2.22858695863491 | 0.0419921875 |
| KIRP | NIBAN1 | SLC29A3 | -2.64168639944393 | 0.0475412011146545 |
| STAD | NIBAN1 | CPXM1 | -4.95096478676314 | 1.16415321826935e-08 |
| KIRP | NIBAN1 | CPXM1 | 2.38307137873153 | 1.26352533698082e-05 |
| COAD | NIBAN1 | ZBTB41 | -1.29740971729502 | 1.2814998626709e-06 |
| THCA | NIBAN1 | STT3A | -3.07902077831225 | 1.58785695520082e-07 |
| STAD | NIBAN1 | CCDC69 | -1.68856862403949 | 1.72760337591171e-07 |
| BRCA | NIBAN1 | ZBTB41 | 1.50730261585515 | 1.99119326629535e-16 |
| KIRC | NIBAN1 | CPXM1 | 1.10267616967919 | 2.12953331388655e-05 |
| STAD | NIBAN1 | FAM129A | -1.75918169016463 | 2.54092738032341e-05 |
| LUAD | NIBAN1 | GSDMC | 3.44949276767914 | 2.60664880579755e-06 |
| STAD | NIBAN1 | SYNPO2 | -1.41530986147084 | 2.66358256340027e-06 |
| LIHC | NIBAN1 | ZBTB41 | -2.02472292534606 | 2.79541516836777e-05 |
| BRCA | NIBAN1 | SYNPO2 | -2.17758568582709 | 3.08920518884636e-34 |
| COAD | NIBAN1 | SYNPO2 | -3.31731305968915 | 3.27825546264649e-06 |
| THCA | NIBAN1 | C1orf27 | -1.09774152992635 | 3.47207694313758e-05 |
| LIHC | NIBAN1 | CCDC69 | -1.75760407860274 | 3.76554262356548e-06 |
| BLCA | NIBAN1 | CCDC69 | -4.42724524837639 | 3.814697265625e-06 |
| PRAD | NIBAN1 | CCDC69 | -2.03096959022 | 4.30621174639414e-08 |
| LIHC | NIBAN1 | GSDMC | -1.13165748380018 | 4.761353215221e-07 |
| KICH | NIBAN1 | CPXM1 | 1.79150935591142 | 5.24520874023437e-06 |
| LUSC | NIBAN1 | CCDC69 | -4.93379982442443 | 5.30109746670603e-10 |
| BRCA | NIBAN1 | NPM1 | 1.67871200826056 | 6.08616071537136e-06 |
| BRCA | NIBAN1 | FAM129A | -1.24527720291633 | 6.43299716509779e-16 |
| KICH | NIBAN1 | SLC29A3 | 1.19960257780337 | 6.55651092529297e-06 |
| LUAD | NIBAN1 | CCDC69 | -1.19596502649272 | 7.0750762948169e-11 |
| LUSC | NIBAN1 | GSDMC | 5.13908508813224 | 7.11803396854217e-09 |
| BRCA | NIBAN1 | C1orf27 | 1.97111854255989 | 7.4433251076041e-13 |
| LIHC | NIBAN1 | NPM1 | -2.07303950904433 | 8.97466888721789e-06 |
| Protein-protein interactors with this translation factor (BIOGRID-3.4.160) |
| PPI interactors with NIBAN1 |
Top |
|
| Clinically associated variants from ClinVar. |
| Gene | Chr | Position | RefSeq | VarSeq | RefSeeq | VarType | Pathogenic | Disease | VarInfo |
| NIBAN1 | chr1 | 184764410 | C | T | single_nucleotide_variant | Benign | not_provided | SO:0001583|missense_variant | SO:0001583|missense_variant |
| NIBAN1 | chr1 | 184764697 | G | A | single_nucleotide_variant | Uncertain_significance | not_provided | SO:0001583|missense_variant | SO:0001583|missense_variant |
| NIBAN1 | chr1 | 184853810 | C | T | single_nucleotide_variant | Benign | not_provided | SO:0001819|synonymous_variant | SO:0001819|synonymous_variant |
| NIBAN1 | chr1 | 184853857 | A | G | single_nucleotide_variant | Benign | not_provided | SO:0001583|missense_variant | SO:0001583|missense_variant |
| nsSNVs with sample frequency (size of circle) from TCGA 33 cancers. |
| SNVs and Indels |
| Gene | Cancer type | Chromosome | Start | End | RefSeeq | MutSeq | Mutation type | AAchange | # samples |
| Copy number variation (CNV) of NIBAN1 * Click on the image to open the original image in a new window. |
 |
| Fusion gene breakpoints (product of the structural variants (SVs)) across NIBAN1 * Click on the image to open the UCSC genome browser with custom track showing this image in a new window. |
 |
| Fusion genes with this translation factor from FusionGDB2.0. |
| FusionGDB2 ID | Disease | Sample | Hgene | Hchr | Hbp | Hstrand | Tgene | Tchr | Tbp | Tstrand |
Top |
|
| Kaplan-Meier plots with logrank tests of overall survival (OS) |
| Cancer type | Translation factor | Coefficent | Hazard ratio | Wald test pval | Likelihool ratio pval | Logrank test pval | # samples |
Top |
|
| Differential gene expression between female and male. (Wilcoxon test, pval<0.05) |
| Cancer type | Translation factor | pval | adj.p |
Top |
|
| Differential gene expression between young and old age groups (Wilcoxon test, pval<0.05) |
| Cancer type | Translation factor | pval | adj.p |
Top |
|
| Drugs targeting genes involved in this translation factor. (DrugBank Version 5.1.8 2021-05-08) |
| UniProtAcc | DrugBank ID | Drug name | Drug activity | Drug type | Drug status |
Top |
|
| Diseases associated with this translation factor. (DisGeNet 4.0) |
| Disease ID | Disease Name | # PubMeds | Disease source |
| C0008370 | Cholestasis | 1 | CTD_human |
(UTHealth)
Web File Viewing | Emergency Information |Campus Carry|Site Policies