
|
||||||
|

Translation Factor: RPS4Y2 (NCBI Gene ID:140032) |
|
 Gene Summary Gene Summary |
| Gene Information | Gene Name: RPS4Y2 | Gene ID: 140032 | Gene Symbol | RPS4Y2 | Gene ID | 140032 |
| Gene Name | ribosomal protein S4 Y-linked 2 | |
| Synonyms | RPS4Y2P | |
| Cytomap | Yq11.223 | |
| Type of Gene | protein-coding | |
| Description | 40S ribosomal protein S4, Y isoform 240S ribosomal protein S4, Yribosomal protein S4, Y-linked 2 pseudogenesmall ribosomal subunit protein eS4 | |
| Modification date | 20200313 | |
| UniProtAcc | Q8TD47 | |
| Child GO biological process term(s) under GO:0006412 |
| GO ID | GO term |
| GO:0005840 | Ribosome |
| GO:0006412 | Translation |
| Gene ontology of translaction factor with evidence of Inferred from Direct Assay (IDA) from Entrez |
| Partner | Gene | GO ID | GO term | PubMed ID |
| Inferred gene age of translation factor. |
| Gene | Inferred gene age group among (0 - 67.6], (67.6 - 355.7], (355.7 - 733], (733 - 1119.25], >1119.25 |
Top |
|
| We searched PubMed using 'RPS4Y2[title] AND translation [title] AND human.' |
| Gene | Title | PMID |
| RPS4Y2 | . | . |
Top |
|
| Skipped exons in TCGA and GTEx based on Ensembl gene isoform structure. * Click on the image to open the UCSC genome browser with custom track showing this image in a new window. For more annotations, please visit our ExonSkipDB. |
 |
| Open reading frame (ORF) analsis of exon skipping events based on Ensembl gene isoform structure. * Click on the break point to see the gene structure around the break point region using the UCSC Genome Browser. |
| ENST | Exon skip start (DNA) | Exon Skip end (DNA) | ORF |
| Exon skipping position in the amino acid sequence. |
| ENST | Exon skip start (DNA) | Exon Skip end (DNA) | Len(transcript seq) | Exon skip start (mRNA) | Exon Skip end (mRNA) | Len(amino acid seq) | Exon skip start (AA) | Exon Skip end (AA) |
| Potentially (partially) lost protein functional features of UniProt. |
| UniProtAcc | Exon skip start (AA) | Exon Skip end (AA) | Function feature start (AA) | Function feature end (AA) | Functional feature type | Functional feature desc. |
Top |
|
| Gene expression level across TCGA pancancer |
 |
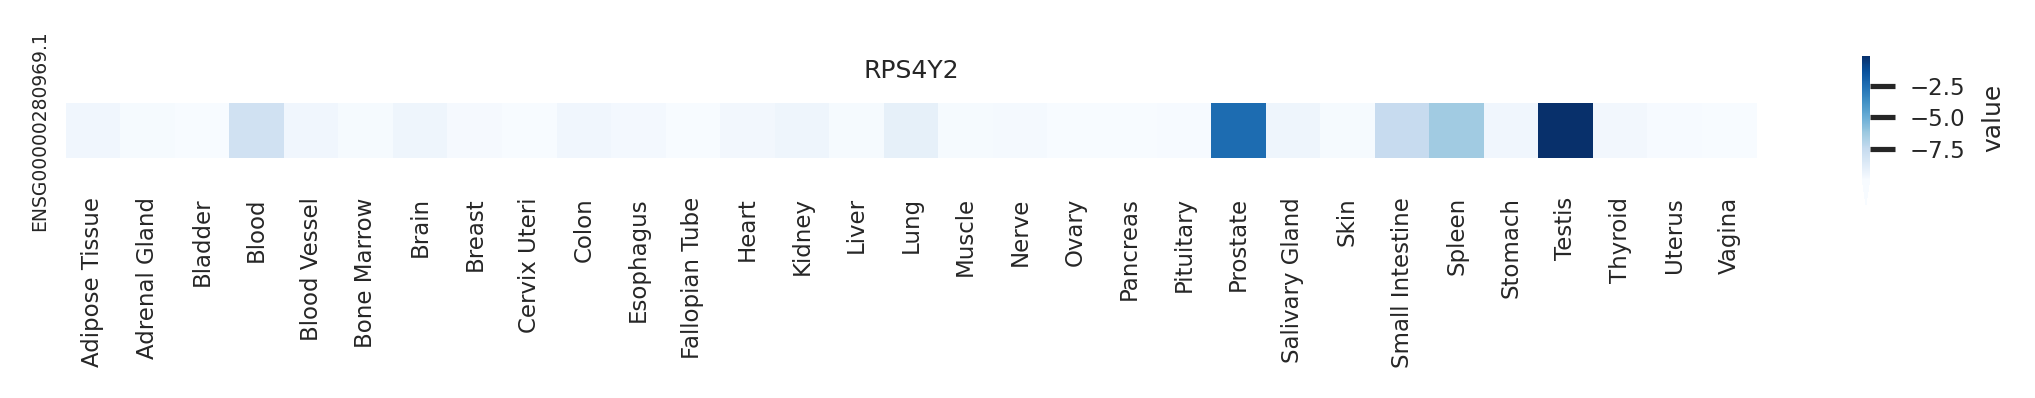
| Gene expression level across GTEx pantissue |
 |
| Expression level of gene isoforms across TCGA pancancer |
 |
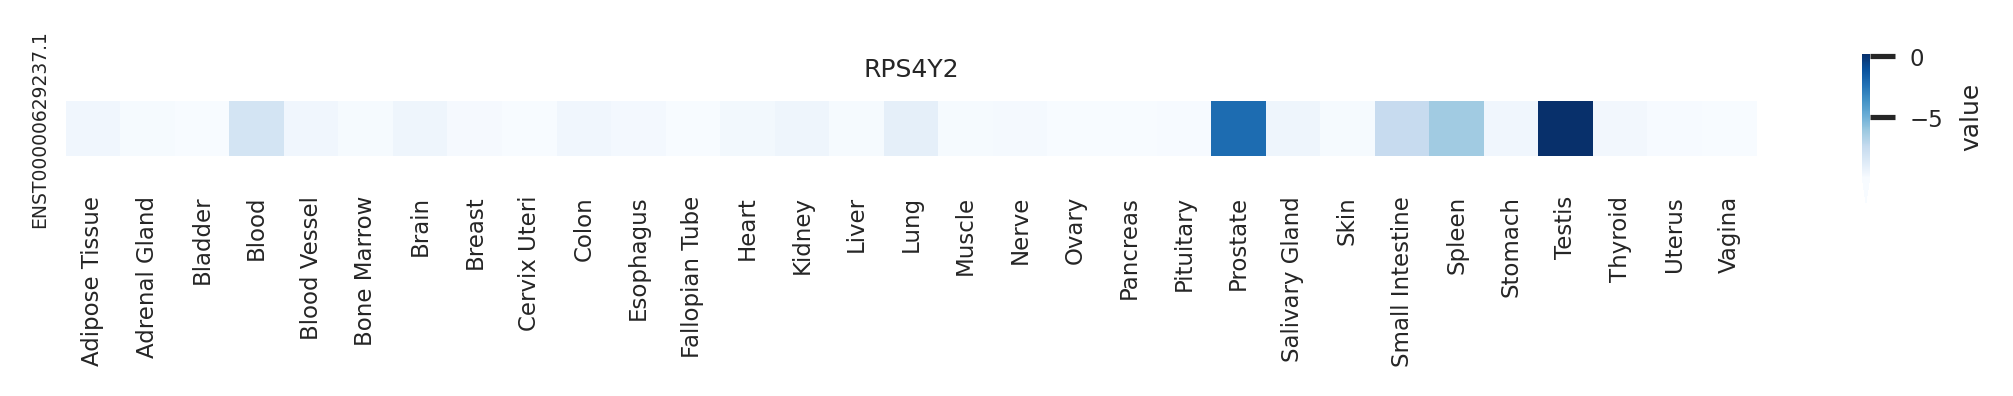
| Expression level of gene isoforms across GTEx pantissue |
 |
| Cancer(tissue) type-specific expression level of Translation factor using z-score distriution |
 |
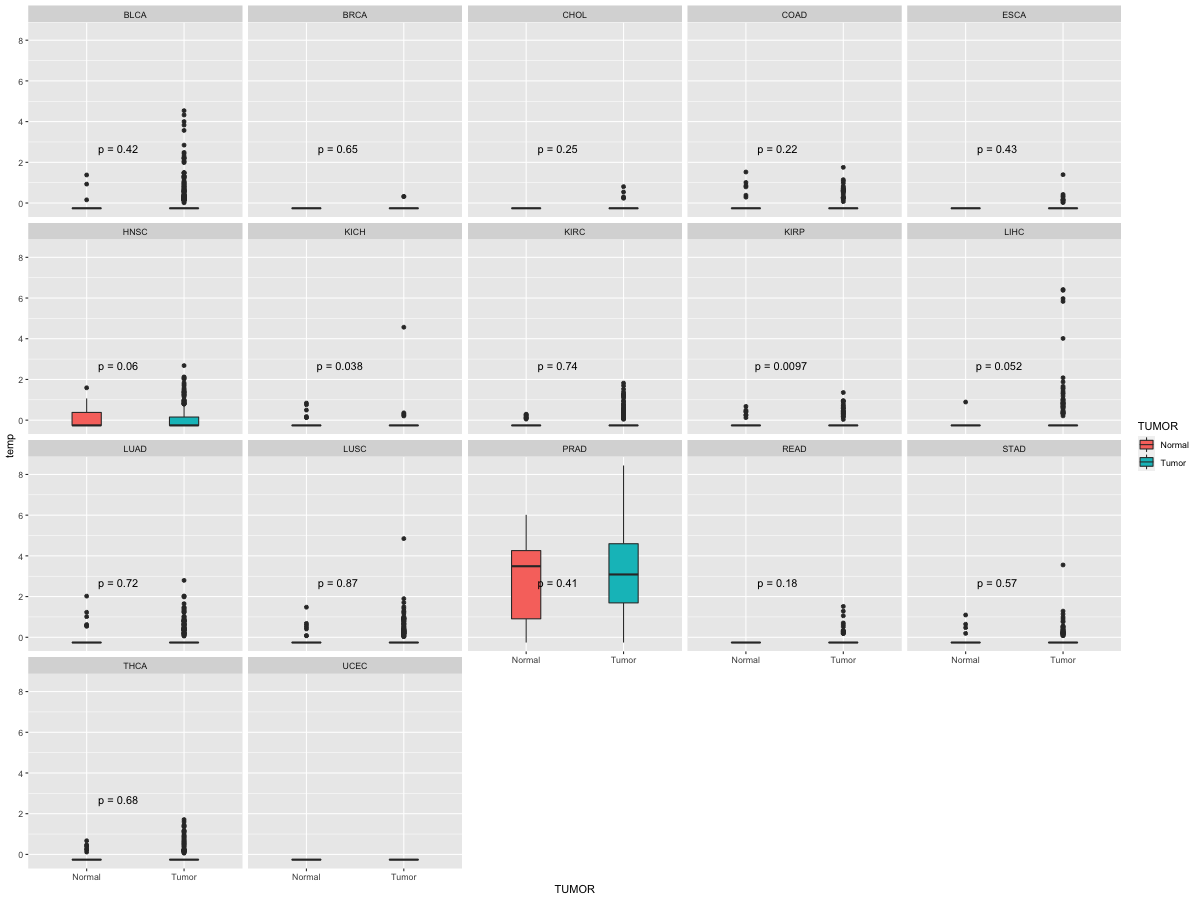
| Differential expression between tumor and matched normal (in the cancer types with more than 10 matched samples) |
 |
| Cancer type | Translation factor | FC | adj.pval |
Top |
|
| Translation factor expression regulation through miRNA binding |
| Cancer type | Gene | miRNA | TargetScan binding score (Context++ score percentile) | Coefficient | Pvalue |
| Translation factor expression regulation through methylation in the promoter of Translation factor |
| Cancer type | Gene | methyl group b | methyl group a | DEG pval | avg methyl in b | avg methyl in a | avg exp in b | avg exp in a |
| Translation factor expression regulation through methylation in the gene body of Translation factor (positive regulation) |
| Cancer type | Gene | methyl group b | methyl group a | DEG pval | avg methyl in b | avg methyl in a | avg exp in b | avg exp in a |
| Translation factor expression regulation through copy number variation of Translation factor |
| Cancer type | Gene | Coefficient | Pvalue |
Top |
|
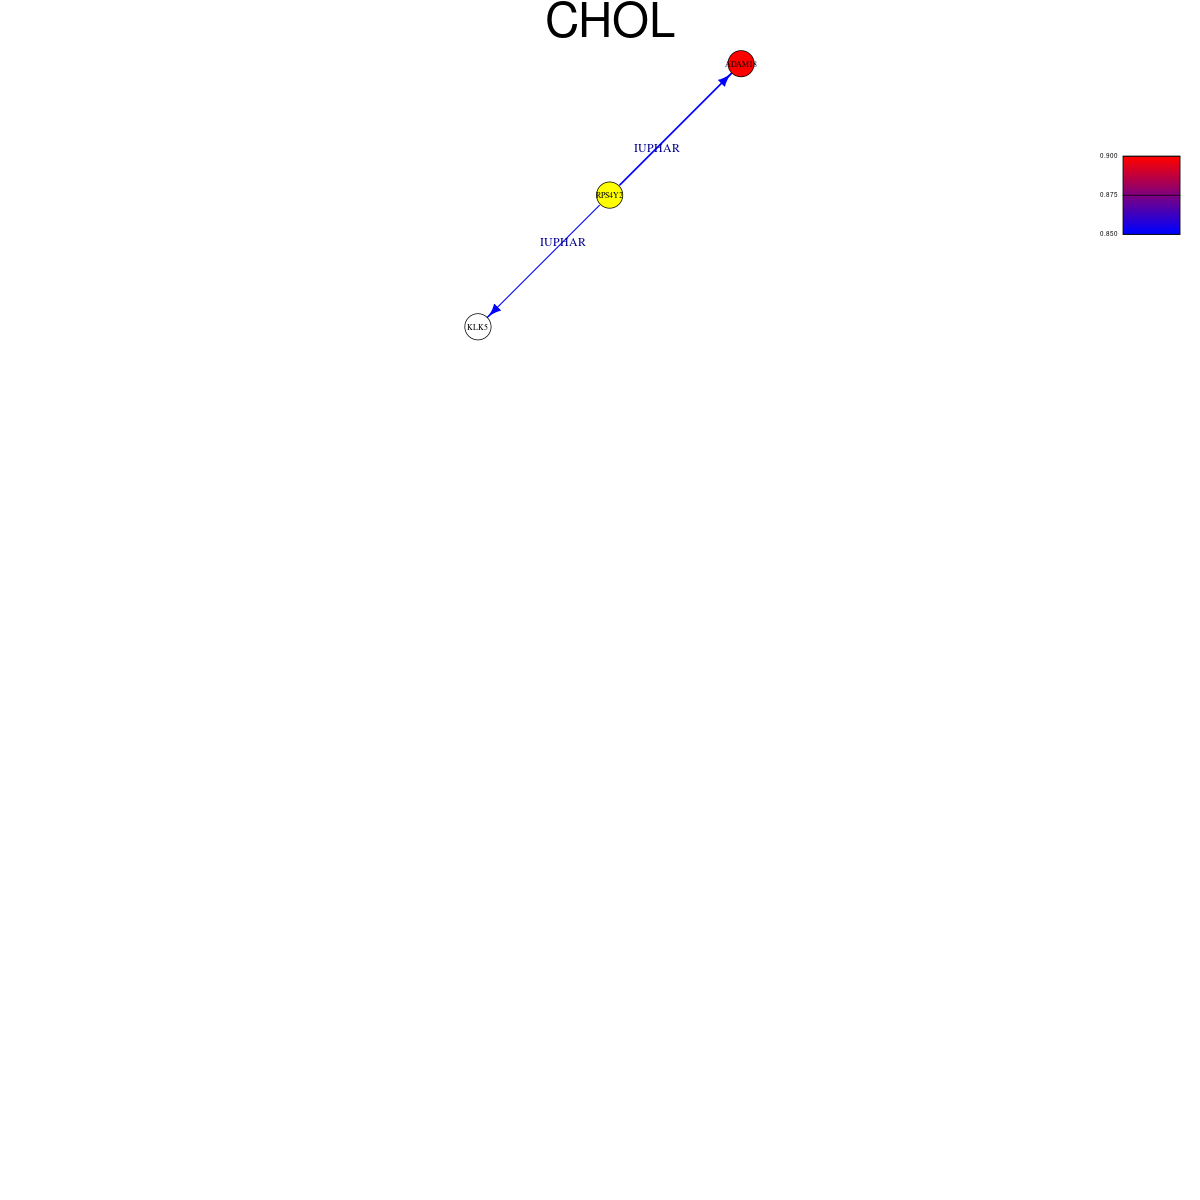
| Strongly correlated genes belong to cellular important gene groups with RPS4Y2 (coefficient>0.8, pval<0.05, node color based on FC between tumor and matched normal). Significantly associated important genes in the individual cancer types. * Cell metabolism gene: cell metabolism genes from REACTOME (black edge), IUPHAR: drug target genes from IUPHAR (blue edge), Kinase: human kinase genes (brown edge), CGC: cancer gene census genes (orange edge), TSG: tumor suppresor genes (purple edge), Epifactor: epigenetic factors (light blue edge), TF: transcription factors (green) |
 |
| Cancer type | Gene group | Translation factor | Correlated gene | Coefficient | Pvalue |
| CHOL | IUPHAR | RPS4Y2 | ADAM18 | 0.854274824 | 8.50E-14 |
| CHOL | IUPHAR | RPS4Y2 | KLK5 | 0.90408199 | 1.77E-17 |
Top |
|
| Protein 3D structure Visit iCn3D. |
Top |
|
| Protein-protein interaction networks * Overlap between up-regulated DEGs (log2FC<-1 and adj.P<0.05) and STRING PPI network (center: Translation factor, node: DEGs, edges: weighted by -log2(adj.P)) |
| Overlap between down-regulated DEGs (log2FC>1 and adj.P<0.05) and STRING PPI network (center: Translation factor, node: DEGs, edges: weighted by -log2(adj.P)) |
 * Edge colors based on TCGA cancer types. |
| * Overlap between DEGs (log2FC>1 and adj.P<0.05) and STRING PPI network per cancer (center: Translation factor, node: DEGs, node color: log2FC, edges: weighted by -log2(adj.P)) |
| Cancer type | Translation factor | Interacting protein coding gene | FC | adj.pval |
| Protein-protein interactors with this translation factor (BIOGRID-3.4.160) |
| PPI interactors with RPS4Y2 |
| RPS4Y1, ZNF746, CSNK1E, HEXIM1, MEPCE, LARP7, SNIP1, ORF7b, CIT, ANLN, AURKB, CHMP4B, CHMP4C, ECT2, KIF14, KIF20A, KIF23, PRC1, ZNF428, RPS16, RPS2, HIST1H2AM, KLRG2, RPS6, OIT3, DGCR8, LIN28A, SSSCA1, RPL7A, SRP14, CCDC97, RPL4, MFAP4, RPL13, RPLP0, RPL14, RPL36AL, RPS10, HIST1H1A, EMILIN1, RPS3A, MAGEB2, MBNL1, SURF6, HIST1H1E, ZNF346, DAXX, SET, PRKRA, MRPL2, LYAR, NEIL1, RPSAP58, RPL3, NEUROG3, DNASE1L1, FGFBP1, LRRC46, ZNF668, KRR1, RBM4B, ABT1, RPSA, RPS19, RPS8, FTL, RPL19, HECTD1, |
Top |
|
| Clinically associated variants from ClinVar. |
| Gene | Chr | Position | RefSeq | VarSeq | RefSeeq | VarType | Pathogenic | Disease | VarInfo |
| nsSNVs with sample frequency (size of circle) from TCGA 33 cancers. |
 |
| SNVs and Indels |
| Gene | Cancer type | Chromosome | Start | End | RefSeeq | MutSeq | Mutation type | AAchange | # samples |
| RPS4Y2 | LUAD | chrY | 22923177 | 22923179 | CAG | - | In_Frame_Del | p.IS90del | 6 |
| RPS4Y2 | SKCM | chrY | 22942837 | 22942837 | C | T | Silent | p.S237S | 4 |
| RPS4Y2 | SKCM | chrY | 22930724 | 22930724 | G | A | Missense_Mutation | p.G132R | 2 |
| RPS4Y2 | BLCA | chrY | 22918664 | 22918664 | G | A | Splice_Site | p.A2T | 2 |
| RPS4Y2 | SKCM | chrY | 22921930 | 22921930 | C | T | Silent | p.F86F | 2 |
| RPS4Y2 | HNSC | chrY | 22930714 | 22930714 | G | A | Silent | p.K128K | 2 |
| RPS4Y2 | STAD | chrY | 22918666 | 22918666 | C | A | Silent | p.A2A | 2 |
| RPS4Y2 | LGG | chrY | 22930744 | 22930744 | C | A | Missense_Mutation | p.H138Q | 2 |
| RPS4Y2 | STAD | chrY | 22930849 | 22930849 | C | G | Missense_Mutation | p.I173M | 2 |
| RPS4Y2 | LIHC | chrY | 22941543 | 22941543 | C | T | Silent | p.V227V | 2 |
| RPS4Y2 | SKCM | chrY | 22923253 | 22923253 | G | A | Missense_Mutation | p.V116M | 2 |
| RPS4Y2 | SKCM | chrY | 22923205 | 22923205 | C | T | Missense_Mutation | p.R100C | 2 |
| RPS4Y2 | BLCA | chrY | 22918664 | 22918664 | G | A | Missense_Mutation | 1 | |
| RPS4Y2 | LIHC | chrY | 22921883 | 22921883 | A | - | Frame_Shift_Del | p.K71fs | 1 |
| RPS4Y2 | LIHC | chrY | 22921788 | 22921788 | G | - | Frame_Shift_Del | p.R39fs | 1 |
| RPS4Y2 | HNSC | chrY | 22930714 | 22930714 | G | A | Silent | 1 | |
| RPS4Y2 | LUAD | chrY | 22921814 | 22921814 | C | A | Missense_Mutation | p.L48I | 1 |
| RPS4Y2 | STAD | chrY | 22918666 | 22918666 | C | A | Silent | 1 | |
| RPS4Y2 | LUAD | chrY | 22921762 | 22921762 | T | C | Silent | p.R30R | 1 |
| RPS4Y2 | LGG | chrY | 22930744 | 22930744 | C | A | Missense_Mutation | 1 | |
| RPS4Y2 | LUSC | chrY | 22918696 | 22918696 | T | G | Silent | p.V12V | 1 |
| RPS4Y2 | LIHC | chrY | 22941543 | 22941543 | C | T | Silent | 1 | |
| RPS4Y2 | LUSC | chrY | 22930792 | 22930792 | C | G | Missense_Mutation | p.I154M | 1 |
| RPS4Y2 | LIHC | chrY | 22942882 | 22942882 | A | G | Silent | 1 | |
| RPS4Y2 | PRAD | chrY | 22930773 | 22930773 | G | A | Missense_Mutation | p.R148H | 1 |
| RPS4Y2 | LIHC | chrY | 22921883 | 22921883 | A | - | Frame_Shift_Del | p.L70fs | 1 |
| RPS4Y2 | LIHC | chrY | 22921772 | 22921772 | G | - | Frame_Shift_Del | p.G34fs | 1 |
| Copy number variation (CNV) of RPS4Y2 * Click on the image to open the original image in a new window. |
 |
| Fusion gene breakpoints (product of the structural variants (SVs)) across RPS4Y2 * Click on the image to open the UCSC genome browser with custom track showing this image in a new window. |
 |
| Fusion genes with this translation factor from FusionGDB2.0. |
| FusionGDB2 ID | Disease | Sample | Hgene | Hchr | Hbp | Hstrand | Tgene | Tchr | Tbp | Tstrand |
| 19086 | N/A | EI780615 | CPQ | chr8 | 97695480 | - | RPS4Y2 | chrY | 22935265 | - |
Top |
|
| Kaplan-Meier plots with logrank tests of overall survival (OS) |
 |
| Cancer type | Translation factor | Coefficent | Hazard ratio | Wald test pval | Likelihool ratio pval | Logrank test pval | # samples |
Top |
|
| Differential gene expression between female and male. (Wilcoxon test, pval<0.05) |
 |
| Cancer type | Translation factor | pval | adj.p |
| READ | RPS4Y2 | 0.000543344695208708 | 0.006 |
| ACC | RPS4Y2 | 0.000645692159273924 | 0.0065 |
| KICH | RPS4Y2 | 0.00243666803962182 | 0.022 |
| KIRP | RPS4Y2 | 0.002655014547149 | 0.022 |
| UVM | RPS4Y2 | 0.00322328652362099 | 0.023 |
| DLBC | RPS4Y2 | 0.00371090173729357 | 0.023 |
| CHOL | RPS4Y2 | 0.0177016937438334 | 0.089 |
| MESO | RPS4Y2 | 0.0466818861301137 | 0.19 |
| LGG | RPS4Y2 | 1.05264279645504e-11 | 2.1e-10 |
| LIHC | RPS4Y2 | 1.58325313608566e-06 | 2.1e-05 |
| BRCA | RPS4Y2 | 1.74608558841571e-11 | 3.3e-10 |
| LAML | RPS4Y2 | 1.95566707411087e-07 | 2.9e-06 |
| LUAD | RPS4Y2 | 2.65371478706251e-25 | 7.2e-24 |
| PAAD | RPS4Y2 | 2.70461451453547e-08 | 4.6e-07 |
| COAD | RPS4Y2 | 3.16698816371334e-08 | 5.1e-07 |
| SKCM | RPS4Y2 | 3.2377606920099e-18 | 7.8e-17 |
| PCPG | RPS4Y2 | 3.76734280023183e-05 | 0.00045 |
| THYM | RPS4Y2 | 3.91841478757506e-15 | 9e-14 |
| THCA | RPS4Y2 | 4.19151801765773e-37 | 1.2e-35 |
| SARC | RPS4Y2 | 4.61302344246272e-19 | 1.2e-17 |
| BLCA | RPS4Y2 | 5.06951187219774e-12 | 1.1e-10 |
| HNSC | RPS4Y2 | 7.0529590089158e-19 | 1.8e-17 |
| STAD | RPS4Y2 | 7.38925553885133e-07 | 1e-05 |
| KIRC | RPS4Y2 | 9.59887359733439e-12 | 2e-10 |
| LUSC | RPS4Y2 | 9.67294233243721e-09 | 1.7e-07 |
Top |
|
| Differential gene expression between young and old age groups (Wilcoxon test, pval<0.05) |
 |
| Cancer type | Translation factor | pval | adj.p |
| GBM | RPS4Y2 | 0.0495179438816763 | 1 |
| PRAD | RPS4Y2 | 0.00314784800571313 | 0.094 |
| SKCM | RPS4Y2 | 0.0357090831811468 | 0.96 |
| HNSC | RPS4Y2 | 0.0211033631621982 | 0.61 |
| READ | RPS4Y2 | 0.0299905672215363 | 0.84 |
Top |
|
| Drugs targeting genes involved in this translation factor. (DrugBank Version 5.1.8 2021-05-08) |
| UniProtAcc | DrugBank ID | Drug name | Drug activity | Drug type | Drug status |
Top |
|
| Diseases associated with this translation factor. (DisGeNet 4.0) |
| Disease ID | Disease Name | # PubMeds | Disease source |
(UTHealth)
Web File Viewing | Emergency Information |Campus Carry|Site Policies