
|
||||||
|

Translation Factor: LSM14B (NCBI Gene ID:149986) |
|
 Gene Summary Gene Summary |
| Gene Information | Gene Name: LSM14B | Gene ID: 149986 | Gene Symbol | LSM14B | Gene ID | 149986 |
| Gene Name | LSM family member 14B | |
| Synonyms | C20orf40|FAM61B|FT005|LSM13|RAP55B|bA11M20.3 | |
| Cytomap | 20q13.33 | |
| Type of Gene | protein-coding | |
| Description | protein LSM14 homolog BLSM14 homolog BLSM14B, SCD6 homolog BRNA-associated protein 55Bfamily with sequence similarity 61, member BhRAP55B | |
| Modification date | 20200327 | |
| UniProtAcc | Q9BX40 | |
| Child GO biological process term(s) under GO:0006412 |
| GO ID | GO term |
| GO:0006417 | Regulation of translation |
| GO:0006412 | Translation |
| Gene ontology of translaction factor with evidence of Inferred from Direct Assay (IDA) from Entrez |
| Partner | Gene | GO ID | GO term | PubMed ID |
| Inferred gene age of translation factor. |
| Gene | Inferred gene age group among (0 - 67.6], (67.6 - 355.7], (355.7 - 733], (733 - 1119.25], >1119.25 |
| LSM14B | >1119.25 |
Top |
|
| We searched PubMed using 'LSM14B[title] AND translation [title] AND human.' |
| Gene | Title | PMID |
| LSM14B | . | . |
Top |
|
| Skipped exons in TCGA and GTEx based on Ensembl gene isoform structure. * Click on the image to open the UCSC genome browser with custom track showing this image in a new window. For more annotations, please visit our ExonSkipDB. |
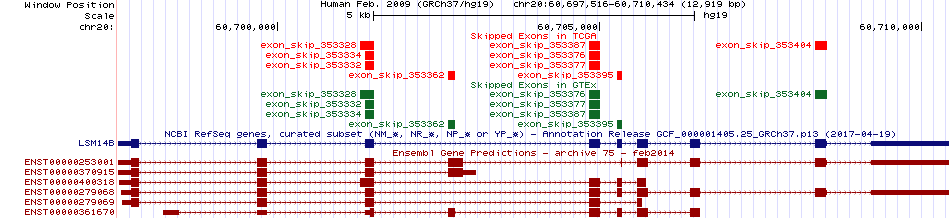 |
| Open reading frame (ORF) analsis of exon skipping events based on Ensembl gene isoform structure. * Click on the break point to see the gene structure around the break point region using the UCSC Genome Browser. |
| ENST | Exon skip start (DNA) | Exon Skip end (DNA) | ORF |
| ENST00000279068 | 60701359 | 60701495 | Frame-shift |
| ENST00000279068 | 60704840 | 60705008 | In-frame |
| ENST00000279068 | 60705274 | 60705352 | In-frame |
| ENST00000279068 | 60708345 | 60708531 | 3UTR-3CDS |
| Exon skipping position in the amino acid sequence. |
| ENST | Exon skip start (DNA) | Exon Skip end (DNA) | Len(transcript seq) | Exon skip start (mRNA) | Exon Skip end (mRNA) | Len(amino acid seq) | Exon skip start (AA) | Exon Skip end (AA) |
| ENST00000279068 | 60704840 | 60705008 | 2565 | 588 | 755 | 385 | 142 | 198 |
| ENST00000279068 | 60705274 | 60705352 | 2565 | 756 | 833 | 385 | 198 | 224 |
| Potentially (partially) lost protein functional features of UniProt. |
| UniProtAcc | Exon skip start (AA) | Exon Skip end (AA) | Function feature start (AA) | Function feature end (AA) | Functional feature type | Functional feature desc. |
| Q9BX40 | 142 | 198 | 2 | 385 | Chain | ID=PRO_0000187093;Note=Protein LSM14 homolog B |
| Q9BX40 | 198 | 224 | 2 | 385 | Chain | ID=PRO_0000187093;Note=Protein LSM14 homolog B |
| Q9BX40 | 142 | 198 | 154 | 154 | Modified residue | Note=Phosphoserine;Ontology_term=ECO:0000244,ECO:0000244;evidence=ECO:0000244|PubMed:18669648,ECO:0000244|PubMed:20068231;Dbxref=PMID:18669648,PMID:20068231 |
| Q9BX40 | 142 | 198 | 165 | 165 | Modified residue | Note=Phosphoserine;Ontology_term=ECO:0000244;evidence=ECO:0000244|PubMed:23186163;Dbxref=PMID:23186163 |
| Q9BX40 | 142 | 198 | 45 | 142 | Alternative sequence | ID=VSP_014659;Note=In isoform 3. SFGTEDRPTDRPAPPREEIYEYIIFRGSDIKDITVCEPPKAQHTLPQDPAIVQSSLGSASASPFQPHVPYSPFRGMAPYGPLAASSLLSQQYAASLGL->MAPYGPLAASSLLSQQYAASLGLEKLVSPPASAAASSPSSSPSPQPVSELDLSSEPQQLTAKGCLFCFRSLFTYTQSHIVLFRVPTGPGTLEREEMER;Ontology_term=ECO:0000303;evidence=ECO:0000303|PubMed:14702039;Dbxref=PMID:14702039 |
| Q9BX40 | 142 | 198 | 143 | 220 | Alternative sequence | ID=VSP_014660;Note=In isoform 2. GAGFPSIPVGKSPMVEQAVQTGSADNLNAKKLLPGKGTTGTQLNGRQAQPSSKTASDVVQPAAVQAQGQVNDENRRPQ->EKLVSPPASAAASSPSSSPSPQPVSELDLSSEPQQLTAKGNSSLGELHAVLQTILRARGKAADRMTVAVADHLPSPCS;Ontology_term=ECO:0000303;evidence=ECO:0000303|PubMed:15489334;Dbxref=PMID:15489334 |
| Q9BX40 | 198 | 224 | 143 | 220 | Alternative sequence | ID=VSP_014660;Note=In isoform 2. GAGFPSIPVGKSPMVEQAVQTGSADNLNAKKLLPGKGTTGTQLNGRQAQPSSKTASDVVQPAAVQAQGQVNDENRRPQ->EKLVSPPASAAASSPSSSPSPQPVSELDLSSEPQQLTAKGNSSLGELHAVLQTILRARGKAADRMTVAVADHLPSPCS;Ontology_term=ECO:0000303;evidence=ECO:0000303|PubMed:15489334;Dbxref=PMID:15489334 |
Top |
|
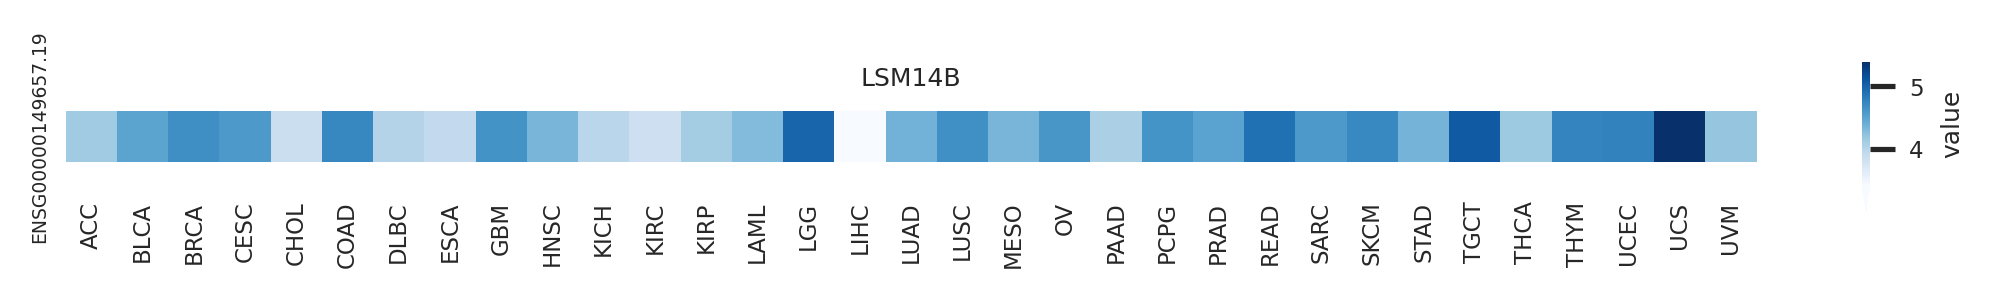
| Gene expression level across TCGA pancancer |
 |
| Gene expression level across GTEx pantissue |
 |
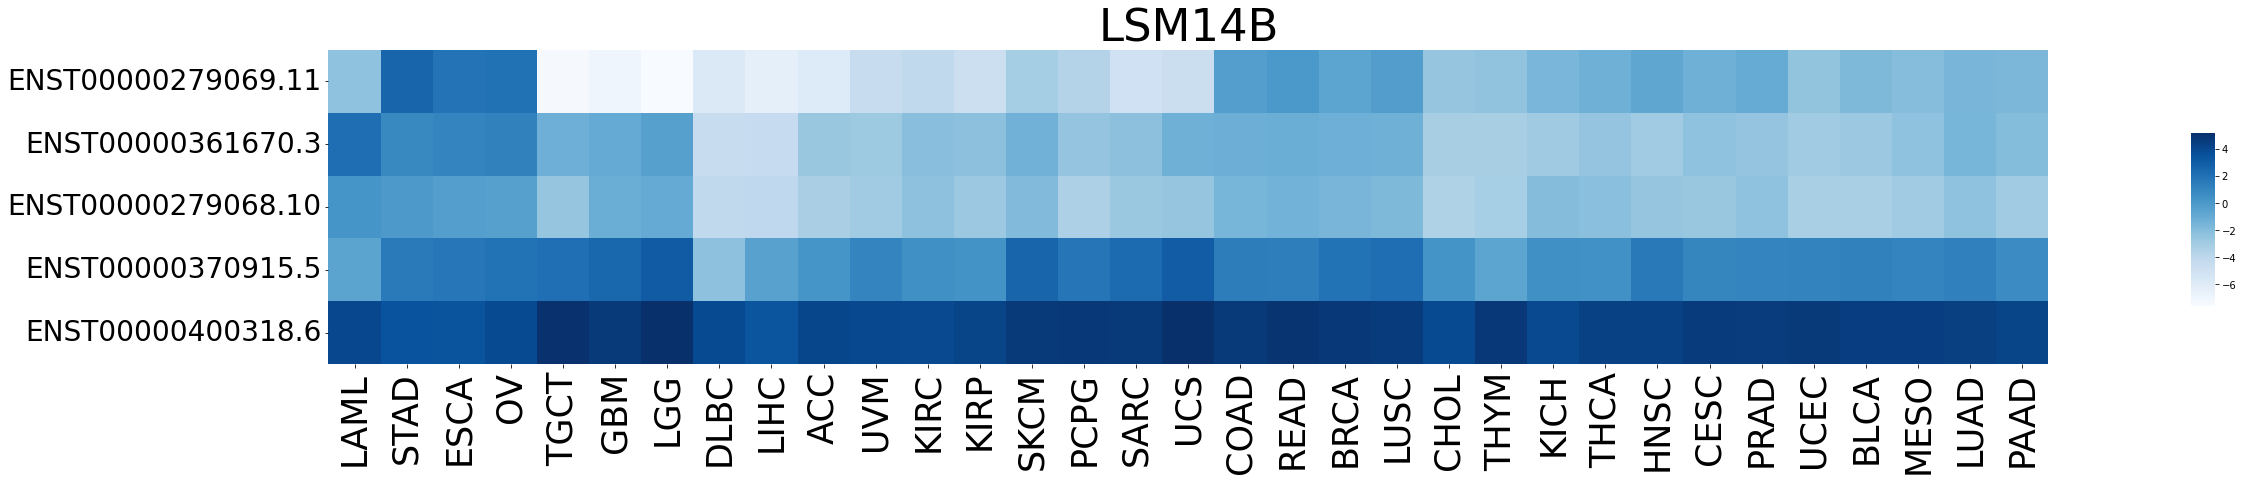
| Expression level of gene isoforms across TCGA pancancer |
 |
| Expression level of gene isoforms across GTEx pantissue |
 |
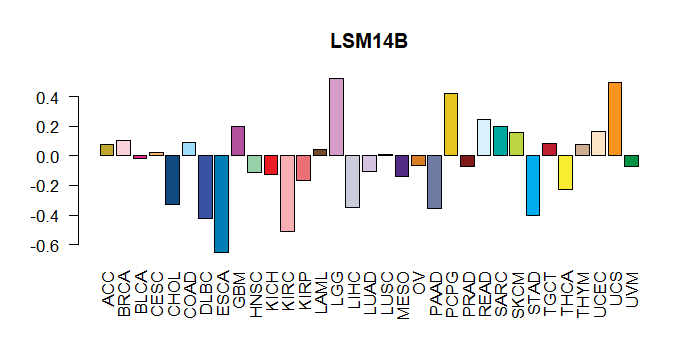
| Cancer(tissue) type-specific expression level of Translation factor using z-score distriution |
 |
| Differential expression between tumor and matched normal (in the cancer types with more than 10 matched samples) |
 |
| Cancer type | Translation factor | FC | adj.pval |
| CHOL | LSM14B | -2.25703219479764 | 0.00390625 |
| STAD | LSM14B | -1.04497961394163 | 0.0139979305677116 |
| KICH | LSM14B | -1.99774835906046 | 1.50799751281738e-05 |
| PRAD | LSM14B | -3.81113021286116 | 1.68487044723013e-05 |
| LUAD | LSM14B | -1.99667623004912 | 1.92117385607053e-06 |
| KIRP | LSM14B | -1.03944906543717 | 8.74791294336319e-06 |
Top |
|
| Translation factor expression regulation through miRNA binding |
| Cancer type | Gene | miRNA | TargetScan binding score (Context++ score percentile) | Coefficient | Pvalue |
| Translation factor expression regulation through methylation in the promoter of Translation factor |
 |
| Cancer type | Gene | methyl group b | methyl group a | DEG pval | avg methyl in b | avg methyl in a | avg exp in b | avg exp in a |
| Translation factor expression regulation through methylation in the gene body of Translation factor (positive regulation) |
 |
| Cancer type | Gene | methyl group b | methyl group a | DEG pval | avg methyl in b | avg methyl in a | avg exp in b | avg exp in a |
| Translation factor expression regulation through copy number variation of Translation factor |
 |
| Cancer type | Gene | Coefficient | Pvalue |
| READ | LSM14B | -0.089335527 | 0.004724402 |
| LGG | LSM14B | 0.136648511 | 0.019291856 |
Top |
|
| Strongly correlated genes belong to cellular important gene groups with LSM14B (coefficient>0.8, pval<0.05, node color based on FC between tumor and matched normal). Significantly associated important genes in the individual cancer types. * Cell metabolism gene: cell metabolism genes from REACTOME (black edge), IUPHAR: drug target genes from IUPHAR (blue edge), Kinase: human kinase genes (brown edge), CGC: cancer gene census genes (orange edge), TSG: tumor suppresor genes (purple edge), Epifactor: epigenetic factors (light blue edge), TF: transcription factors (green) |
 |
| Cancer type | Gene group | Translation factor | Correlated gene | Coefficient | Pvalue |
| COAD | Epifactor | LSM14B | TAF4 | 0.889706914 | 2.20E-113 |
| DLBC | Epifactor | LSM14B | TAF4 | 0.873835035 | 5.23E-16 |
| GBM | TF | LSM14B | ZNF512B | 0.844072222 | 7.05E-48 |
| LUAD | Epifactor | LSM14B | TAF4 | 0.802478469 | 7.83E-131 |
| LUSC | Epifactor | LSM14B | TAF4 | 0.800934255 | 7.77E-125 |
| READ | CGC | LSM14B | SS18L1 | 0.810810891 | 1.06E-25 |
| READ | Epifactor | LSM14B | SS18L1 | 0.810810891 | 1.06E-25 |
| READ | Epifactor | LSM14B | TAF4 | 0.911290078 | 1.75E-41 |
| READ | TSG | LSM14B | DIDO1 | 0.806928811 | 2.71E-25 |
| THYM | CGC | LSM14B | TOP1 | 0.812100638 | 7.52E-30 |
| THYM | Epifactor | LSM14B | YY1 | 0.813751268 | 4.67E-30 |
| THYM | Epifactor | LSM14B | TADA1 | 0.815147731 | 3.11E-30 |
| THYM | IUPHAR | LSM14B | TOP1 | 0.812100638 | 7.52E-30 |
| THYM | TF | LSM14B | TOPORS | 0.803931598 | 7.45E-29 |
| THYM | TF | LSM14B | ZNF567 | 0.807637013 | 2.67E-29 |
| THYM | TF | LSM14B | YY1 | 0.813751268 | 4.67E-30 |
| THYM | TSG | LSM14B | TOPORS | 0.803931598 | 7.45E-29 |
| UCS | CGC | LSM14B | TOP1 | 0.812100638 | 7.52E-30 |
| UCS | Epifactor | LSM14B | YY1 | 0.813751268 | 4.67E-30 |
| UCS | Epifactor | LSM14B | TADA1 | 0.815147731 | 3.11E-30 |
| UCS | IUPHAR | LSM14B | TOP1 | 0.812100638 | 7.52E-30 |
| UCS | TF | LSM14B | TOPORS | 0.803931598 | 7.45E-29 |
| UCS | TF | LSM14B | ZNF567 | 0.807637013 | 2.67E-29 |
| UCS | TF | LSM14B | YY1 | 0.813751268 | 4.67E-30 |
| UCS | TSG | LSM14B | TOPORS | 0.803931598 | 7.45E-29 |
Top |
|
| Protein 3D structure Visit iCn3D. |
Top |
|
| Protein-protein interaction networks * Overlap between up-regulated DEGs (log2FC<-1 and adj.P<0.05) and STRING PPI network (center: Translation factor, node: DEGs, edges: weighted by -log2(adj.P)) |
 |
| Overlap between down-regulated DEGs (log2FC>1 and adj.P<0.05) and STRING PPI network (center: Translation factor, node: DEGs, edges: weighted by -log2(adj.P)) |
 |
 * Edge colors based on TCGA cancer types. |
| * Overlap between DEGs (log2FC>1 and adj.P<0.05) and STRING PPI network per cancer (center: Translation factor, node: DEGs, node color: log2FC, edges: weighted by -log2(adj.P)) |
 |
| Cancer type | Translation factor | Interacting protein coding gene | FC | adj.pval |
| HNSC | LSM14B | DCP1B | 1.14521055486121 | 0.000653586169164556 |
| COAD | LSM14B | DCP1A | 1.37134624374913 | 0.00241076946258545 |
| BLCA | LSM14B | DCP1A | -4.97262066067438 | 0.0033416748046875 |
| THCA | LSM14B | EDC3 | -1.60072094283068 | 0.00403018908583426 |
| STAD | LSM14B | DCP1B | -1.13498768546097 | 0.00828406633809209 |
| KIRC | LSM14B | DCP2 | 1.26475649682567 | 0.0124189994647713 |
| CHOL | LSM14B | PABPC1L | 2.78331172494241 | 0.01953125 |
| CHOL | LSM14B | BICC1 | 2.98219972165231 | 0.02734375 |
| PRAD | LSM14B | BICC1 | 1.12504584917467 | 0.0350092650357157 |
| STAD | LSM14B | PATL1 | 1.64176209311139 | 1.11940316855908e-05 |
| LUAD | LSM14B | PABPC1L | -2.51583026501524 | 1.30692790027182e-05 |
| PRAD | LSM14B | EDC3 | 1.41585676363778 | 1.51985731338595e-07 |
| LUAD | LSM14B | DCP1A | -1.72675426206094 | 1.6717782354243e-05 |
| BRCA | LSM14B | DCP1A | -1.83830661187261 | 1.93681541154994e-23 |
| LUSC | LSM14B | PABPC1L | -2.50538171229714 | 3.79466966402315e-05 |
| STAD | LSM14B | PABPC1L | -2.43245436541992 | 4.02145087718964e-06 |
| LIHC | LSM14B | PABPC1L | -2.77562492714404 | 6.17267413816717e-05 |
| LUAD | LSM14B | EDC3 | -1.96767005947362 | 6.36796101058976e-06 |
| BRCA | LSM14B | EIF4ENIF1 | -1.8000022968001 | 7.32601452453987e-06 |
| KICH | LSM14B | PABPC1L | 2.22531868187715 | 7.49826431274414e-05 |
| THCA | LSM14B | DDX6 | -4.18593714762416 | 8.3083675979354e-06 |
| LIHC | LSM14B | EDC3 | -1.35008737111713 | 9.26293949573469e-09 |
| Protein-protein interactors with this translation factor (BIOGRID-3.4.160) |
| PPI interactors with LSM14B |
| HECW2, LGR4, DDX6, SEMG2, SEMG1, SIRT3, ICK, LUC7L, NTRK1, DCTN1, XPO1, SMC1A, HUWE1, PHF8, C1qbp, Iffo1, POU5F1, CLEC3A, BHLHA15, GTF3C2, CHCHD10, CASP3, G3BP1, PTCH1, ESR2, HEXIM1, MEPCE, EZH2, RECQL4, SNRNP70, ITFG1, WWP2, HOMER3, WDYHV1, TCEANC, ZC3H18, N, nsp9, ESR1, DAZL, DCP1A, EIF4ENIF1, LSM14A, MEX3B, MOV10, UBAP2L, YTHDF2, YTHDF3, ZC3HAV1, AGO2, CAPRIN1, DDX3X, FAM120C, FXR2, TDRD3, ZFP36, FUBP3, IGF2BP1, IGF2BP2, KIAA0430, HNRNPH1, ZMYND11, OGT, FBL, RPS20, FZR1, PRM2, CHCHD2, PSMD9, RPL37, DDX54, C17orf85, SEPT9, FBXW7, TOP3B, CPEB1, |
Top |
|
| Clinically associated variants from ClinVar. |
| Gene | Chr | Position | RefSeq | VarSeq | RefSeeq | VarType | Pathogenic | Disease | VarInfo |
| nsSNVs with sample frequency (size of circle) from TCGA 33 cancers. |
 |
| SNVs and Indels |
| Gene | Cancer type | Chromosome | Start | End | RefSeeq | MutSeq | Mutation type | AAchange | # samples |
| LSM14B | KIRP | chr20 | 60705292 | 60705292 | G | A | Missense_Mutation | p.A205T | 5 |
| LSM14B | BLCA | chr20 | 60697842 | 60697842 | C | A | Silent | 5 | |
| LSM14B | UCEC | chr20 | 60705677 | 60705677 | C | T | Silent | p.F255 | 4 |
| LSM14B | ESCA | chr20 | 60701373 | 60701373 | C | T | Missense_Mutation | 4 | |
| LSM14B | ESCA | chr20 | 60701373 | 60701373 | C | T | Missense_Mutation | p.S102F | 3 |
| LSM14B | BRCA | chr20 | 60705737 | 60705737 | G | T | Silent | p.L275 | 3 |
| LSM14B | ESCA | chr20 | 60708434 | 60708434 | C | T | Missense_Mutation | p.R359W | 3 |
| LSM14B | BRCA | chr20 | 60708435 | 60708435 | G | C | Missense_Mutation | p.R359P | 3 |
| LSM14B | UCEC | chr20 | 60705594 | 60705594 | C | T | Nonsense_Mutation | p.R228* | 3 |
| LSM14B | HNSC | chr20 | 60706468 | 60706468 | G | A | Missense_Mutation | p.E298K | 3 |
| LSM14B | UCEC | chr20 | 60705329 | 60705329 | G | A | Missense_Mutation | p.R217K | 3 |
| LSM14B | ESCA | chr20 | 60705584 | 60705584 | A | G | Splice_Site | 3 | |
| LSM14B | PAAD | chr20 | 60701454 | 60701454 | G | A | Missense_Mutation | p.S129N | 3 |
| LSM14B | SKCM | chr20 | 60701385 | 60701385 | C | T | Missense_Mutation | p.S106L | 3 |
| LSM14B | UCEC | chr20 | 60701479 | 60701479 | C | T | Silent | p.A137 | 2 |
| LSM14B | BRCA | chr20 | 60701300 | 60701300 | G | A | Missense_Mutation | p.E104K | 2 |
| LSM14B | KIRC | chr20 | 60701436 | 60701436 | A | G | Missense_Mutation | p.Y123C | 2 |
| LSM14B | PRAD | chr20 | 60708507 | 60708507 | G | T | Missense_Mutation | p.G383V | 2 |
| LSM14B | STAD | chr20 | 60704997 | 60704997 | A | G | Missense_Mutation | p.K195R | 2 |
| LSM14B | UCEC | chr20 | 60704910 | 60704910 | C | A | Missense_Mutation | p.A166D | 2 |
| LSM14B | BRCA | chr20 | 60706418 | 60706418 | A | T | Missense_Mutation | p.K281M | 2 |
| LSM14B | STAD | chr20 | 60706523 | 60706523 | A | C | Missense_Mutation | p.K316T | 2 |
| LSM14B | UCEC | chr20 | 60705000 | 60705000 | C | T | Missense_Mutation | p.T196M | 2 |
| LSM14B | BLCA | chr20 | 60704841 | 60704841 | G | A | Splice_Site | p.G143E | 2 |
| LSM14B | STAD | chr20 | 60704949 | 60704949 | G | A | Missense_Mutation | p.G179D | 2 |
| LSM14B | UCEC | chr20 | 60705625 | 60705625 | G | A | Missense_Mutation | p.R238H | 2 |
| LSM14B | BLCA | chr20 | 60697745 | 60697745 | C | T | Missense_Mutation | p.P8L | 2 |
| LSM14B | STAD | chr20 | 60704864 | 60704864 | G | A | Missense_Mutation | p.V151I | 2 |
| LSM14B | BLCA | chr20 | 60708371 | 60708371 | G | C | Missense_Mutation | p.E338Q | 2 |
| LSM14B | CESC | chr20 | 60708354 | 60708354 | G | A | Missense_Mutation | 2 | |
| LSM14B | SKCM | chr20 | 60701392 | 60701392 | C | T | Silent | p.F108F | 2 |
| LSM14B | UCEC | chr20 | 60706415 | 60706415 | A | G | Missense_Mutation | p.D280G | 2 |
| LSM14B | BLCA | chr20 | 60706476 | 60706476 | C | T | Silent | p.P300P | 2 |
| LSM14B | CESC | chr20 | 60702804 | 60702804 | G | C | Silent | 2 | |
| LSM14B | LGG | chr20 | 60701373 | 60701373 | C | G | Missense_Mutation | p.S102C | 2 |
| LSM14B | SKCM | chr20 | 60705335 | 60705335 | C | T | Missense_Mutation | p.P219L | 2 |
| LSM14B | PAAD | chr20 | 60701454 | 60701454 | G | A | Missense_Mutation | 2 | |
| LSM14B | PAAD | chr20 | 60701305 | 60701305 | C | T | Silent | 2 | |
| LSM14B | UCEC | chr20 | 60706442 | 60706442 | A | G | Missense_Mutation | p.D289G | 2 |
| LSM14B | ESCA | chr20 | 60708434 | 60708434 | C | T | Missense_Mutation | 2 | |
| LSM14B | BLCA | chr20 | 60706547 | 60706547 | C | T | Missense_Mutation | p.S324F | 2 |
| LSM14B | UCEC | chr20 | 60708446 | 60708446 | C | T | Nonsense_Mutation | p.R363* | 2 |
| LSM14B | SKCM | chr20 | 60701364 | 60701364 | C | T | Missense_Mutation | p.S99F | 2 |
| LSM14B | UCEC | chr20 | 60701310 | 60701310 | G | A | Missense_Mutation | p.R107Q | 2 |
| LSM14B | PCPG | chr20 | 60701439 | 60701439 | G | T | Missense_Mutation | 2 | |
| LSM14B | UCEC | chr20 | 60701386 | 60701386 | G | A | Silent | p.S106 | 2 |
| LSM14B | BRCA | chr20 | 60699699 | 60699699 | C | T | Missense_Mutation | p.P52S | 2 |
| LSM14B | PCPG | chr20 | 60701439 | 60701439 | G | T | Missense_Mutation | p.G124V | 2 |
| LSM14B | STAD | chr20 | 60699742 | 60699742 | A | G | Missense_Mutation | p.Y66C | 2 |
| LSM14B | LIHC | chr20 | 60699717 | 60699717 | C | - | Frame_Shift_Del | p.P59fs | 2 |
| LSM14B | BLCA | chr20 | 60706476 | 60706476 | C | T | Silent | 1 | |
| LSM14B | GBM | chr20 | 60697790 | 60697790 | G | A | Missense_Mutation | p.R23H | 1 |
| LSM14B | COAD | chr20 | 60701443 | 60701443 | G | A | Silent | p.P125P | 1 |
| LSM14B | LIHC | chr20 | 60706428 | 60706428 | G | - | Frame_Shift_Del | p.K284fs | 1 |
| LSM14B | BLCA | chr20 | 60704907 | 60704907 | C | T | Missense_Mutation | 1 | |
| LSM14B | GBM | chr20 | 60701495 | 60701495 | G | T | Nonsense_Mutation | 1 | |
| LSM14B | KIRP | chr20 | 60705652 | 60705652 | T | C | Missense_Mutation | p.I247T | 1 |
| LSM14B | PRAD | chr20 | 60701437 | 60701437 | C | T | Silent | p.Y123Y | 1 |
| LSM14B | LIHC | chr20 | 60708481 | 60708481 | C | - | Frame_Shift_Del | p.N374fs | 1 |
| LSM14B | GBM | chr20 | 60704961 | 60704961 | C | T | Missense_Mutation | 1 | |
| LSM14B | KIRP | chr20 | 60704972 | 60704972 | G | C | Missense_Mutation | p.G187R | 1 |
| LSM14B | SARC | chr20 | 60701309 | 60701309 | C | T | Missense_Mutation | 1 | |
| LSM14B | LUAD | chr20 | 60706504 | 60706504 | T | A | Missense_Mutation | p.C310S | 1 |
| LSM14B | HNSC | chr20 | 60706468 | 60706468 | G | A | Missense_Mutation | 1 | |
| LSM14B | SARC | chr20 | 60704083 | 60704083 | A | G | Missense_Mutation | 1 | |
| LSM14B | ESCA | chr20 | 60704986 | 60704986 | G | A | Silent | p.Q191 | 1 |
| LSM14B | LUSC | chr20 | 60701381 | 60701381 | G | T | Missense_Mutation | p.A105S | 1 |
| LSM14B | HNSC | chr20 | 60705703 | 60705703 | G | A | Missense_Mutation | 1 | |
| LSM14B | KIRP | chr20 | 60697753 | 60697753 | G | C | Missense_Mutation | p.G11R | 1 |
| LSM14B | THYM | chr20 | 60708385 | 60708385 | C | A | Missense_Mutation | p.N342K | 1 |
| LSM14B | ESCA | chr20 | 60705584 | 60705584 | A | G | Splice_Site | e6-2 | 1 |
| LSM14B | LUSC | chr20 | 60699680 | 60699680 | C | T | Silent | p.S45S | 1 |
| LSM14B | HNSC | chr20 | 60705703 | 60705703 | G | A | Missense_Mutation | p.R264Q | 1 |
| LSM14B | BLCA | chr20 | 60704907 | 60704907 | C | T | Missense_Mutation | p.S165F | 1 |
| LSM14B | CESC | chr20 | 60704872 | 60704872 | G | A | Silent | p.K153K | 1 |
| LSM14B | LGG | chr20 | 60701380 | 60701380 | C | A | Silent | 1 | |
| LSM14B | SKCM | chr20 | 60705702 | 60705702 | C | T | Nonsense_Mutation | p.R264X | 1 |
| LSM14B | UCEC | chr20 | 60701479 | 60701479 | C | T | Silent | p.A137A | 1 |
| LSM14B | HNSC | chr20 | 60697741 | 60697742 | - | C | Frame_Shift_Ins | p.P7fs | 1 |
| LSM14B | PAAD | chr20 | 60705702 | 60705702 | C | A | Silent | 1 | |
| LSM14B | CESC | chr20 | 60697842 | 60697842 | C | T | Silent | p.L40 | 1 |
| LSM14B | LIHC | chr20 | 60705603 | 60705603 | A | G | Missense_Mutation | 1 | |
| LSM14B | BLCA | chr20 | 60705660 | 60705660 | G | C | Missense_Mutation | p.E250Q | 1 |
| LSM14B | KIRC | chr20 | 60708449 | 60708449 | G | A | Missense_Mutation | p.G364R | 1 |
| LSM14B | UCS | chr20 | 60701448 | 60701448 | C | T | Missense_Mutation | p.A127V | 1 |
| LSM14B | CESC | chr20 | 60702804 | 60702804 | G | C | Silent | p.L197 | 1 |
| LSM14B | LIHC | chr20 | 60706512 | 60706512 | T | C | Silent | 1 | |
| LSM14B | SKCM | chr20 | 60705702 | 60705702 | C | T | Nonsense_Mutation | p.R264* | 1 |
| LSM14B | ESCA | chr20 | 60705584 | 60705584 | A | G | Splice_Site | . | 1 |
| LSM14B | BLCA | chr20 | 60697761 | 60697761 | G | C | Missense_Mutation | p.K13N | 1 |
| LSM14B | KIRC | chr20 | 60708460 | 60708460 | C | A | Silent | p.G367G | 1 |
| LSM14B | COAD | chr20 | 60699716 | 60699716 | G | A | Silent | p.A57A | 1 |
| LSM14B | LIHC | chr20 | 60706422 | 60706422 | T | C | Silent | p.A282A | 1 |
| LSM14B | BLCA | chr20 | 60708371 | 60708371 | G | C | Missense_Mutation | 1 | |
| LSM14B | ESCA | chr20 | 60704986 | 60704986 | G | A | Silent | p.Q191Q | 1 |
| LSM14B | KIRC | chr20 | 60705692 | 60705692 | C | G | Silent | p.A260A | 1 |
| LSM14B | COAD | chr20 | 60701401 | 60701401 | C | T | Silent | p.H111H | 1 |
| Copy number variation (CNV) of LSM14B * Click on the image to open the original image in a new window. |
 |
| Fusion gene breakpoints (product of the structural variants (SVs)) across LSM14B * Click on the image to open the UCSC genome browser with custom track showing this image in a new window. |
 |
| Fusion genes with this translation factor from FusionGDB2.0. |
| FusionGDB2 ID | Disease | Sample | Hgene | Hchr | Hbp | Hstrand | Tgene | Tchr | Tbp | Tstrand |
| 26954 | N/A | BF919146 | BTNL9 | chr5 | 180469231 | + | LSM14B | chr20 | 60709217 | + |
| 26954 | N/A | AW847911 | CKB | chr14 | 103988480 | + | LSM14B | chr20 | 60701377 | + |
| 26956 | UCS | TCGA-N9-A4PZ | EPHA2 | chr1 | 16474872 | - | LSM14B | chr20 | 60699672 | + |
| 26956 | UCS | TCGA-N9-A4PZ-01A | EPHA2 | chr1 | 16474873 | - | LSM14B | chr20 | 60699673 | + |
| 96696 | N/A | AA886089 | LSM14B | chr20 | 60710430 | + | AGAP1 | chr2 | 236782167 | - |
Top |
|
| Kaplan-Meier plots with logrank tests of overall survival (OS) |
 |
| Cancer type | Translation factor | Coefficent | Hazard ratio | Wald test pval | Likelihool ratio pval | Logrank test pval | # samples |
Top |
|
| Differential gene expression between female and male. (Wilcoxon test, pval<0.05) |
 |
| Cancer type | Translation factor | pval | adj.p |
| THCA | LSM14B | 0.000562077820168222 | 0.016 |
| ESCA | LSM14B | 0.0160076093696215 | 0.43 |
| ACC | LSM14B | 0.0229504681554702 | 0.6 |
Top |
|
| Differential gene expression between young and old age groups (Wilcoxon test, pval<0.05) |
 |
| Cancer type | Translation factor | pval | adj.p |
| LUAD | LSM14B | 0.0134210180939307 | 0.38 |
| THCA | LSM14B | 0.0273328418956131 | 0.74 |
| SKCM | LSM14B | 0.000893200069847471 | 0.029 |
| OV | LSM14B | 0.000774046610665992 | 0.026 |
| CESC | LSM14B | 0.00100809679206964 | 0.031 |
| ESCA | LSM14B | 0.0127292364945664 | 0.37 |
| MESO | LSM14B | 0.035899251564287 | 0.93 |
| HNSC | LSM14B | 0.00309992528351534 | 0.093 |
Top |
|
| Drugs targeting genes involved in this translation factor. (DrugBank Version 5.1.8 2021-05-08) |
| UniProtAcc | DrugBank ID | Drug name | Drug activity | Drug type | Drug status |
Top |
|
| Diseases associated with this translation factor. (DisGeNet 4.0) |
| Disease ID | Disease Name | # PubMeds | Disease source |
(UTHealth)
Web File Viewing | Emergency Information |Campus Carry|Site Policies