
|
||||||
|

Translation Factor: DRG2 (NCBI Gene ID:1819) |
|
 Gene Summary Gene Summary |
| Gene Information | Gene Name: DRG2 | Gene ID: 1819 | Gene Symbol | DRG2 | Gene ID | 1819 |
| Gene Name | developmentally regulated GTP binding protein 2 | |
| Synonyms | - | |
| Cytomap | 17p11.2 | |
| Type of Gene | protein-coding | |
| Description | developmentally-regulated GTP-binding protein 2TRAFAC GTPase DRG2translation factor GTPase DRG2 | |
| Modification date | 20200313 | |
| UniProtAcc | P55039 | |
| Child GO biological process term(s) under GO:0006412 |
| GO ID | GO term |
| GO:0002181 | Cytoplasmic translation |
| GO:0006412 | Translation |
| Gene ontology of translaction factor with evidence of Inferred from Direct Assay (IDA) from Entrez |
| Partner | Gene | GO ID | GO term | PubMed ID |
| Inferred gene age of translation factor. |
| Gene | Inferred gene age group among (0 - 67.6], (67.6 - 355.7], (355.7 - 733], (733 - 1119.25], >1119.25 |
| DRG2 | >1119.25 |
Top |
|
| We searched PubMed using 'DRG2[title] AND translation [title] AND human.' |
| Gene | Title | PMID |
| DRG2 | . | . |
Top |
|
| Skipped exons in TCGA and GTEx based on Ensembl gene isoform structure. * Click on the image to open the UCSC genome browser with custom track showing this image in a new window. For more annotations, please visit our ExonSkipDB. |
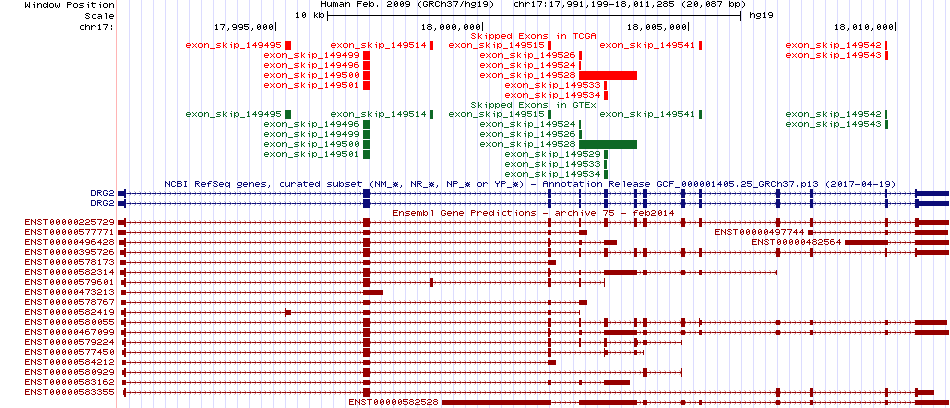 |
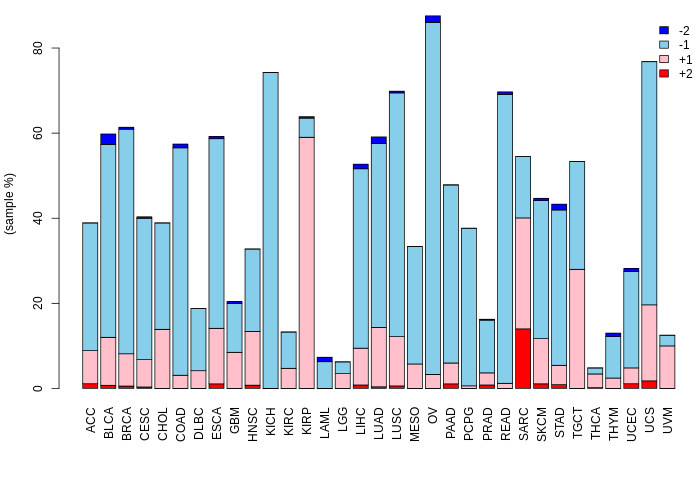
| Open reading frame (ORF) analsis of exon skipping events based on Ensembl gene isoform structure. * Click on the break point to see the gene structure around the break point region using the UCSC Genome Browser. |
| ENST | Exon skip start (DNA) | Exon Skip end (DNA) | ORF |
| ENST00000225729 | 18001583 | 18001673 | In-frame |
| ENST00000225729 | 18002330 | 18002391 | Frame-shift |
| ENST00000225729 | 18002946 | 18003037 | Frame-shift |
| ENST00000225729 | 18005234 | 18005311 | Frame-shift |
| ENST00000225729 | 18009746 | 18009800 | In-frame |
| Exon skipping position in the amino acid sequence. |
| ENST | Exon skip start (DNA) | Exon Skip end (DNA) | Len(transcript seq) | Exon skip start (mRNA) | Exon Skip end (mRNA) | Len(amino acid seq) | Exon skip start (AA) | Exon Skip end (AA) |
| ENST00000225729 | 18001583 | 18001673 | 1981 | 364 | 453 | 364 | 75 | 105 |
| ENST00000225729 | 18009746 | 18009800 | 1981 | 1093 | 1146 | 364 | 318 | 336 |
| Potentially (partially) lost protein functional features of UniProt. |
| UniProtAcc | Exon skip start (AA) | Exon Skip end (AA) | Function feature start (AA) | Function feature end (AA) | Functional feature type | Functional feature desc. |
| P55039 | 318 | 336 | 1 | 364 | Chain | ID=PRO_0000205427;Note=Developmentally-regulated GTP-binding protein 2 |
| P55039 | 75 | 105 | 1 | 364 | Chain | ID=PRO_0000205427;Note=Developmentally-regulated GTP-binding protein 2 |
| P55039 | 75 | 105 | 63 | 288 | Domain | Note=OBG-type G;Ontology_term=ECO:0000255;evidence=ECO:0000255|PROSITE-ProRule:PRU01047 |
| P55039 | 75 | 105 | 69 | 76 | Nucleotide binding | Note=GTP;Ontology_term=ECO:0000255;evidence=ECO:0000255|PROSITE-ProRule:PRU01047 |
Top |
|
| Gene expression level across TCGA pancancer |
 |
| Gene expression level across GTEx pantissue |
 |
| Expression level of gene isoforms across TCGA pancancer |
 |
| Expression level of gene isoforms across GTEx pantissue |
 |
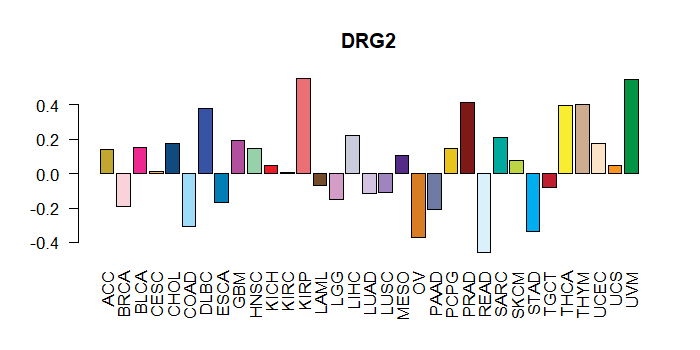
| Cancer(tissue) type-specific expression level of Translation factor using z-score distriution |
 |
| Differential expression between tumor and matched normal (in the cancer types with more than 10 matched samples) |
 |
| Cancer type | Translation factor | FC | adj.pval |
| BRCA | DRG2 | 1.55172876221269 | 5.83844264602967e-05 |
Top |
|
| Translation factor expression regulation through miRNA binding |
| Cancer type | Gene | miRNA | TargetScan binding score (Context++ score percentile) | Coefficient | Pvalue |
| Translation factor expression regulation through methylation in the promoter of Translation factor |
 |
| Cancer type | Gene | methyl group b | methyl group a | DEG pval | avg methyl in b | avg methyl in a | avg exp in b | avg exp in a |
| Translation factor expression regulation through methylation in the gene body of Translation factor (positive regulation) |
 |
| Cancer type | Gene | methyl group b | methyl group a | DEG pval | avg methyl in b | avg methyl in a | avg exp in b | avg exp in a |
| Translation factor expression regulation through copy number variation of Translation factor |
 |
| Cancer type | Gene | Coefficient | Pvalue |
| DLBC | DRG2 | 0.043335894 | 0.021309106 |
| STAD | DRG2 | -0.103741231 | 0.046055582 |
Top |
|
| Strongly correlated genes belong to cellular important gene groups with DRG2 (coefficient>0.8, pval<0.05, node color based on FC between tumor and matched normal). Significantly associated important genes in the individual cancer types. * Cell metabolism gene: cell metabolism genes from REACTOME (black edge), IUPHAR: drug target genes from IUPHAR (blue edge), Kinase: human kinase genes (brown edge), CGC: cancer gene census genes (orange edge), TSG: tumor suppresor genes (purple edge), Epifactor: epigenetic factors (light blue edge), TF: transcription factors (green) |
 |
| Cancer type | Gene group | Translation factor | Correlated gene | Coefficient | Pvalue |
| DLBC | Epifactor | DRG2 | SIRT6 | 0.815085204 | 1.77E-12 |
| DLBC | IUPHAR | DRG2 | SIRT6 | 0.815085204 | 1.77E-12 |
| DLBC | TSG | DRG2 | SIRT6 | 0.815085204 | 1.77E-12 |
| KICH | IUPHAR | DRG2 | CSNK2B | 0.80340353 | 9.52E-22 |
| THCA | Epifactor | DRG2 | CCDC101 | 0.808551943 | 2.19E-133 |
| THCA | Epifactor | DRG2 | PRPF31 | 0.814171159 | 1.08E-136 |
| THCA | Epifactor | DRG2 | RUVBL2 | 0.82230492 | 1.10E-141 |
| THCA | Epifactor | DRG2 | DMAP1 | 0.830283413 | 7.82E-147 |
| THYM | Cell metabolism gene | DRG2 | PSMD9 | 0.810733093 | 1.11E-29 |
| THYM | Cell metabolism gene | DRG2 | PSMB6 | 0.842310029 | 5.30E-34 |
| THYM | Cell metabolism gene | DRG2 | SLC25A11 | 0.859453946 | 9.08E-37 |
| THYM | Cell metabolism gene | DRG2 | TIMM22 | 0.876194263 | 7.57E-40 |
| THYM | Epifactor | DRG2 | MCRS1 | 0.806251474 | 3.93E-29 |
| THYM | Epifactor | DRG2 | PELP1 | 0.833211671 | 1.15E-32 |
| THYM | Epifactor | DRG2 | C17orf49 | 0.845224326 | 1.90E-34 |
| THYM | IUPHAR | DRG2 | PSMB6 | 0.842310029 | 5.30E-34 |
| THYM | IUPHAR | DRG2 | SLC25A11 | 0.859453946 | 9.08E-37 |
| THYM | TSG | DRG2 | PFN1 | 0.823751809 | 2.34E-31 |
| UCS | Cell metabolism gene | DRG2 | PSMD9 | 0.810733093 | 1.11E-29 |
| UCS | Cell metabolism gene | DRG2 | PSMB6 | 0.842310029 | 5.30E-34 |
| UCS | Cell metabolism gene | DRG2 | SLC25A11 | 0.859453946 | 9.08E-37 |
| UCS | Cell metabolism gene | DRG2 | TIMM22 | 0.876194263 | 7.57E-40 |
| UCS | Epifactor | DRG2 | MCRS1 | 0.806251474 | 3.93E-29 |
| UCS | Epifactor | DRG2 | PELP1 | 0.833211671 | 1.15E-32 |
| UCS | Epifactor | DRG2 | C17orf49 | 0.845224326 | 1.90E-34 |
| UCS | IUPHAR | DRG2 | PSMB6 | 0.842310029 | 5.30E-34 |
| UCS | IUPHAR | DRG2 | SLC25A11 | 0.859453946 | 9.08E-37 |
| UCS | TSG | DRG2 | PFN1 | 0.823751809 | 2.34E-31 |
| UVM | Cell metabolism gene | DRG2 | PIGT | 0.803742671 | 2.87E-19 |
| UVM | Cell metabolism gene | DRG2 | SLC25A11 | 0.814663197 | 3.84E-20 |
| UVM | IUPHAR | DRG2 | SLC25A11 | 0.814663197 | 3.84E-20 |
| UVM | IUPHAR | DRG2 | RNPEPL1 | 0.843772266 | 8.82E-23 |
Top |
|
| Protein 3D structure Visit iCn3D. |
Top |
|
| Protein-protein interaction networks * Overlap between up-regulated DEGs (log2FC<-1 and adj.P<0.05) and STRING PPI network (center: Translation factor, node: DEGs, edges: weighted by -log2(adj.P)) |
 |
| Overlap between down-regulated DEGs (log2FC>1 and adj.P<0.05) and STRING PPI network (center: Translation factor, node: DEGs, edges: weighted by -log2(adj.P)) |
 |
 * Edge colors based on TCGA cancer types. |
| * Overlap between DEGs (log2FC>1 and adj.P<0.05) and STRING PPI network per cancer (center: Translation factor, node: DEGs, node color: log2FC, edges: weighted by -log2(adj.P)) |
 |
| Cancer type | Translation factor | Interacting protein coding gene | FC | adj.pval |
| STAD | DRG2 | RPL3 | 2.43523389101044 | 0.00016188295558095 |
| PRAD | DRG2 | GCN1L1 | -7.54173196078564 | 0.000376184722398862 |
| THCA | DRG2 | ZCCHC4 | -2.660987769927 | 0.000454814345944463 |
| LIHC | DRG2 | RPL8 | -4.84588284974558 | 0.00110314154326131 |
| KIRC | DRG2 | GCN1L1 | 1.52944128066025 | 0.00150654978717842 |
| PRAD | DRG2 | ZCCHC4 | -2.08636372976673 | 0.00214742919200666 |
| KICH | DRG2 | EAPP | -1.95104920096508 | 0.0027848482131958 |
| KICH | DRG2 | ZCCHC4 | 1.88632117214692 | 0.00507164001464844 |
| HNSC | DRG2 | RQCD1 | 1.97297540658491 | 0.00585215220849023 |
| STAD | DRG2 | ZC3H15 | -1.04968618173197 | 0.00733334058895707 |
| ESCA | DRG2 | RWDD1 | 1.43074573953025 | 0.009765625 |
| LUAD | DRG2 | RPS4X | -2.43594282676366 | 0.0163893452361939 |
| BLCA | DRG2 | ZC3H15 | 1.07480871713981 | 0.0258216857910156 |
| PRAD | DRG2 | RWDD1 | -1.37015889011473 | 0.0291755363147523 |
| ESCA | DRG2 | RPL3 | 1.12882976357497 | 0.0322265625 |
| HNSC | DRG2 | ZCCHC4 | 1.3543554542248 | 0.0398225729220485 |
| KIRC | DRG2 | RPS4X | -1.64140073680063 | 1.72010286166321e-07 |
| LIHC | DRG2 | GCN1L1 | -1.50546993282376 | 2.24402029682138e-06 |
| BRCA | DRG2 | ZCCHC4 | -3.0235646950969 | 2.91508621588365e-09 |
| BRCA | DRG2 | RWDD1 | -1.13785288766259 | 3.18183978181012e-05 |
| BRCA | DRG2 | RPS4X | -1.55343710903986 | 3.36588066248297e-09 |
| KIRC | DRG2 | RPL8 | -1.18252459971773 | 5.64962994208288e-07 |
| LUAD | DRG2 | GCN1L1 | -3.11494072871482 | 5.86248556550202e-05 |
| KIRP | DRG2 | RPL8 | -1.53003692350119 | 6.0301274061203e-05 |
| COAD | DRG2 | EAPP | -2.73707864334655 | 6.03199005126954e-05 |
| THCA | DRG2 | RPS4X | 1.49777877118816 | 6.68348444344278e-07 |
| Protein-protein interactors with this translation factor (BIOGRID-3.4.160) |
| PPI interactors with DRG2 |
| RWDD1, RSBN1L, ADSL, API5, EHD1, NT5C2, UBE2R2, HSPA8, DDX55, CEP170, SCLT1, XPO1, CUL1, SKP1, NR2C2, DYNLRB1, TRIM28, EIF4A3, TSSK3, NAB2, JMJD7, HSCB, TRIM54, MKI67, DNAJC2, DNAJC1, FKBP5, HSPA14, TMX3, IARS2, RCN2, DHPS, ACADSB, DDR1, TNFRSF1B, KCNE3, MAPK13, EP300, TOLLIP, |
Top |
|
| Clinically associated variants from ClinVar. |
| Gene | Chr | Position | RefSeq | VarSeq | RefSeeq | VarType | Pathogenic | Disease | VarInfo |
| DRG2 | chr17 | 18001679 | TG | T | Deletion | Uncertain_significance | not_provided | SO:0001627|intron_variant | SO:0001627|intron_variant |
| DRG2 | chr17 | 18003919 | G | A | single_nucleotide_variant | Benign | not_provided | SO:0001583|missense_variant | SO:0001583|missense_variant |
| DRG2 | chr17 | 18004862 | C | T | single_nucleotide_variant | Benign | not_provided | SO:0001819|synonymous_variant | SO:0001819|synonymous_variant |
| DRG2 | chr17 | 18010536 | C | T | single_nucleotide_variant | Benign | not_provided | SO:0001819|synonymous_variant,SO:0001624|3_prime_UTR_variant | SO:0001819|synonymous_variant,SO:0001624|3_prime_UTR_variant |
| nsSNVs with sample frequency (size of circle) from TCGA 33 cancers. |
 |
| SNVs and Indels |
| Gene | Cancer type | Chromosome | Start | End | RefSeeq | MutSeq | Mutation type | AAchange | # samples |
| DRG2 | STAD | chr17 | 17997175 | 17997175 | G | T | Missense_Mutation | p.R38L | 4 |
| DRG2 | PAAD | chr17 | 18003681 | 18003681 | C | T | Silent | p.L158L | 3 |
| DRG2 | UCEC | chr17 | 18003953 | 18003953 | A | G | Missense_Mutation | p.Q204R | 3 |
| DRG2 | PAAD | chr17 | 18007126 | 18007126 | A | C | Missense_Mutation | p.K273T | 3 |
| DRG2 | STAD | chr17 | 17997175 | 17997175 | G | T | Missense_Mutation | 3 | |
| DRG2 | PAAD | chr17 | 18002358 | 18002358 | G | A | Missense_Mutation | p.D115N | 3 |
| DRG2 | LIHC | chr17 | 18001657 | 18001657 | T | - | Frame_Shift_Del | p.I100fs | 2 |
| DRG2 | CHOL | chr17 | 18009784 | 18009784 | A | C | Missense_Mutation | 2 | |
| DRG2 | LUAD | chr17 | 18002385 | 18002385 | G | A | Missense_Mutation | p.A124T | 2 |
| DRG2 | CHOL | chr17 | 18009784 | 18009784 | A | C | Missense_Mutation | p.K331T | 2 |
| DRG2 | STAD | chr17 | 17997252 | 17997252 | C | T | Missense_Mutation | p.R64C | 2 |
| DRG2 | BLCA | chr17 | 17997132 | 17997132 | G | A | Missense_Mutation | p.E24K | 2 |
| DRG2 | STAD | chr17 | 18004893 | 18004893 | C | T | Missense_Mutation | p.P240S | 2 |
| DRG2 | BLCA | chr17 | 18005268 | 18005268 | G | A | Missense_Mutation | p.E255K | 2 |
| DRG2 | SKCM | chr17 | 18004859 | 18004859 | C | T | Silent | p.F228F | 2 |
| DRG2 | BLCA | chr17 | 18004839 | 18004839 | G | C | Missense_Mutation | p.D222H | 2 |
| DRG2 | PAAD | chr17 | 18002358 | 18002358 | G | A | Missense_Mutation | 2 | |
| DRG2 | STAD | chr17 | 18009790 | 18009790 | C | T | Missense_Mutation | p.A333V | 2 |
| DRG2 | STAD | chr17 | 18003967 | 18003967 | G | A | Missense_Mutation | p.E209K | 2 |
| DRG2 | BRCA | chr17 | 17997277 | 17997277 | C | G | Missense_Mutation | p.S72C | 2 |
| DRG2 | PAAD | chr17 | 18007126 | 18007126 | A | C | Missense_Mutation | 2 | |
| DRG2 | UCEC | chr17 | 18001619 | 18001619 | C | T | Silent | p.S87 | 2 |
| DRG2 | UCEC | chr17 | 18005252 | 18005252 | C | A | Missense_Mutation | p.D249E | 2 |
| DRG2 | LIHC | chr17 | 18003031 | 18003031 | T | C | Splice_Site | 2 | |
| DRG2 | UCEC | chr17 | 18010542 | 18010542 | C | T | Silent | p.I361 | 2 |
| DRG2 | LIHC | chr17 | 18003031 | 18003031 | T | C | Missense_Mutation | p.V154A | 2 |
| DRG2 | BLCA | chr17 | 18010519 | 18010519 | G | A | Missense_Mutation | 1 | |
| DRG2 | STAD | chr17 | 17997255 | 17997255 | G | A | Missense_Mutation | p.V65M | 1 |
| DRG2 | GBM | chr17 | 18007951 | 18007951 | A | T | Missense_Mutation | 1 | |
| DRG2 | STAD | chr17 | 18010524 | 18010524 | T | C | Silent | p.H355H | 1 |
| DRG2 | BLCA | chr17 | 18003719 | 18003719 | C | T | Silent | 1 | |
| DRG2 | STAD | chr17 | 18005257 | 18005257 | T | C | Missense_Mutation | p.I251T | 1 |
| DRG2 | PRAD | chr17 | 18001642 | 18001642 | C | T | Missense_Mutation | p.T95I | 1 |
| DRG2 | GBM | chr17 | 18004863 | 18004863 | G | A | Missense_Mutation | 1 | |
| DRG2 | LUAD | chr17 | 17997126 | 17997126 | G | A | Splice_Site | 1 | |
| DRG2 | SKCM | chr17 | 18007134 | 18007134 | C | T | Silent | p.L276L | 1 |
| DRG2 | STAD | chr17 | 18010553 | 18010553 | A | G | Silent | p.*365* | 1 |
| DRG2 | COAD | chr17 | 18003703 | 18003703 | C | T | Missense_Mutation | p.S165F | 1 |
| DRG2 | KIRC | chr17 | 17997213 | 17997213 | A | - | Frame_Shift_Del | p.S50fs | 1 |
| DRG2 | LUAD | chr17 | 17997259 | 17997259 | C | T | Missense_Mutation | p.A66V | 1 |
| DRG2 | COAD | chr17 | 18003749 | 18003749 | G | A | Silent | p.K180K | 1 |
| DRG2 | STAD | chr17 | 18010524 | 18010524 | T | C | Nonstop_Mutation | 1 | |
| DRG2 | KIRP | chr17 | 18003957 | 18003957 | C | A | Silent | 1 | |
| DRG2 | STAD | chr17 | 18010553 | 18010553 | A | G | Silent | p.X365X | 1 |
| DRG2 | OV | chr17 | 17944642 | 17944645 | CAGT | - | Frame_Shift_Del | 1 | |
| DRG2 | COAD | chr17 | 18003881 | 18003881 | A | G | Splice_Site | . | 1 |
| DRG2 | SKCM | chr17 | 18004832 | 18004832 | C | T | Silent | p.F219F | 1 |
| DRG2 | THCA | chr17 | 18003714 | 18003714 | C | A | Missense_Mutation | 1 | |
| DRG2 | LGG | chr17 | 18004806 | 18004806 | G | T | Splice_Site | 1 | |
| DRG2 | BLCA | chr17 | 18005255 | 18005255 | G | A | Silent | p.Q250Q | 1 |
| DRG2 | OV | chr17 | 17944625 | 17944625 | C | A | Silent | p.G186 | 1 |
| DRG2 | COAD | chr17 | 18005258 | 18005258 | C | T | Silent | p.I251I | 1 |
| DRG2 | SKCM | chr17 | 18002954 | 18002954 | C | T | Silent | p.G128G | 1 |
| DRG2 | UCEC | chr17 | 18003892 | 18003892 | G | T | Missense_Mutation | p.G184C | 1 |
| DRG2 | LIHC | chr17 | 18003902 | 18003902 | T | C | Missense_Mutation | 1 | |
| DRG2 | BLCA | chr17 | 18003719 | 18003719 | C | T | Silent | p.L170L | 1 |
| DRG2 | COAD | chr17 | 18009754 | 18009754 | G | A | Missense_Mutation | p.R321H | 1 |
| DRG2 | SKCM | chr17 | 18010530 | 18010530 | C | T | Silent | p.D357D | 1 |
| DRG2 | BLCA | chr17 | 17997132 | 17997132 | G | A | Missense_Mutation | 1 | |
| DRG2 | LIHC | chr17 | 18003724 | 18003724 | A | T | Missense_Mutation | 1 | |
| DRG2 | COAD | chr17 | 17991394 | 17991395 | - | AA | Frame_Shift_Ins | p.K19fs | 1 |
| DRG2 | SKCM | chr17 | 18007134 | 18007134 | C | T | Missense_Mutation | p.P82L | 1 |
| DRG2 | BLCA | chr17 | 18004839 | 18004839 | G | C | Missense_Mutation | 1 | |
| DRG2 | LIHC | chr17 | 18003675 | 18003675 | A | G | Splice_Site | 1 | |
| DRG2 | STAD | chr17 | 18010524 | 18010524 | T | C | Nonstop_Mutation | p.*162R | 1 |
| DRG2 | CESC | chr17 | 17997209 | 17997209 | G | A | Silent | 1 | |
| DRG2 | PAAD | chr17 | 18003681 | 18003681 | C | T | Silent | 1 | |
| DRG2 | DLBC | chr17 | 18003919 | 18003919 | G | A | Missense_Mutation | p.V193I | 1 |
| DRG2 | SKCM | chr17 | 18010489 | 18010489 | C | T | Missense_Mutation | p.P344S | 1 |
| DRG2 | BLCA | chr17 | 18005268 | 18005268 | G | A | Missense_Mutation | 1 | |
| DRG2 | STAD | chr17 | 18005286 | 18005286 | C | T | Nonsense_Mutation | p.R261* | 1 |
| DRG2 | CESC | chr17 | 18010473 | 18010473 | C | A | Missense_Mutation | 1 | |
| DRG2 | DLBC | chr17 | 18003008 | 18003008 | G | A | Missense_Mutation | p.M146I | 1 |
| DRG2 | BLCA | chr17 | 18005255 | 18005255 | G | A | Silent | 1 | |
| DRG2 | STAD | chr17 | 18002386 | 18002386 | C | T | Missense_Mutation | p.A124V | 1 |
| DRG2 | CESC | chr17 | 18002969 | 18002969 | G | T | Silent | 1 | |
| DRG2 | GBM | chr17 | 18007951 | 18007951 | A | T | Missense_Mutation | p.T304S | 1 |
| Copy number variation (CNV) of DRG2 * Click on the image to open the original image in a new window. |
 |
| Fusion gene breakpoints (product of the structural variants (SVs)) across DRG2 * Click on the image to open the UCSC genome browser with custom track showing this image in a new window. |
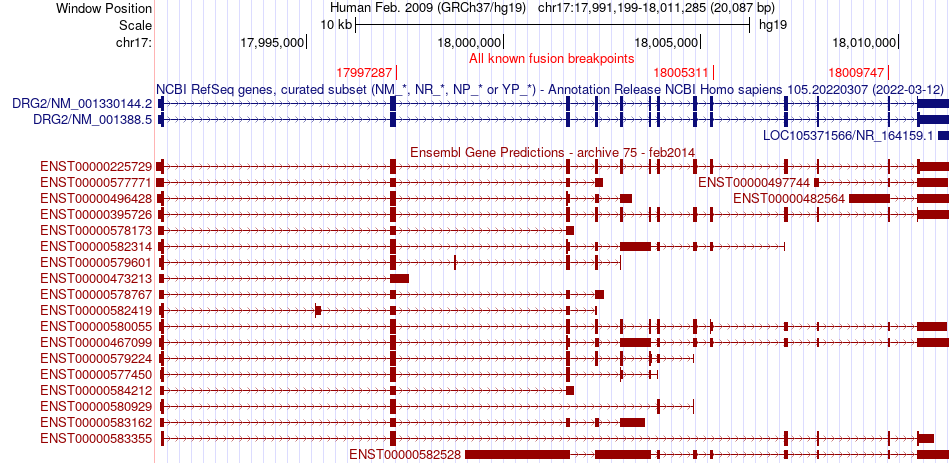 |
| Fusion genes with this translation factor from FusionGDB2.0. |
| FusionGDB2 ID | Disease | Sample | Hgene | Hchr | Hbp | Hstrand | Tgene | Tchr | Tbp | Tstrand |
| 47287 | STAD | TCGA-BR-A4QI-01A | ALKBH5 | chr17 | 18098349 | + | DRG2 | chr17 | 18009747 | + |
| 24167 | BRCA | TCGA-EW-A1OZ-01A | DRG2 | chr17 | 17997287 | + | ZNF624 | chr17 | 16527823 | - |
Top |
|
| Kaplan-Meier plots with logrank tests of overall survival (OS) |
 |
| Cancer type | Translation factor | Coefficent | Hazard ratio | Wald test pval | Likelihool ratio pval | Logrank test pval | # samples |
Top |
|
| Differential gene expression between female and male. (Wilcoxon test, pval<0.05) |
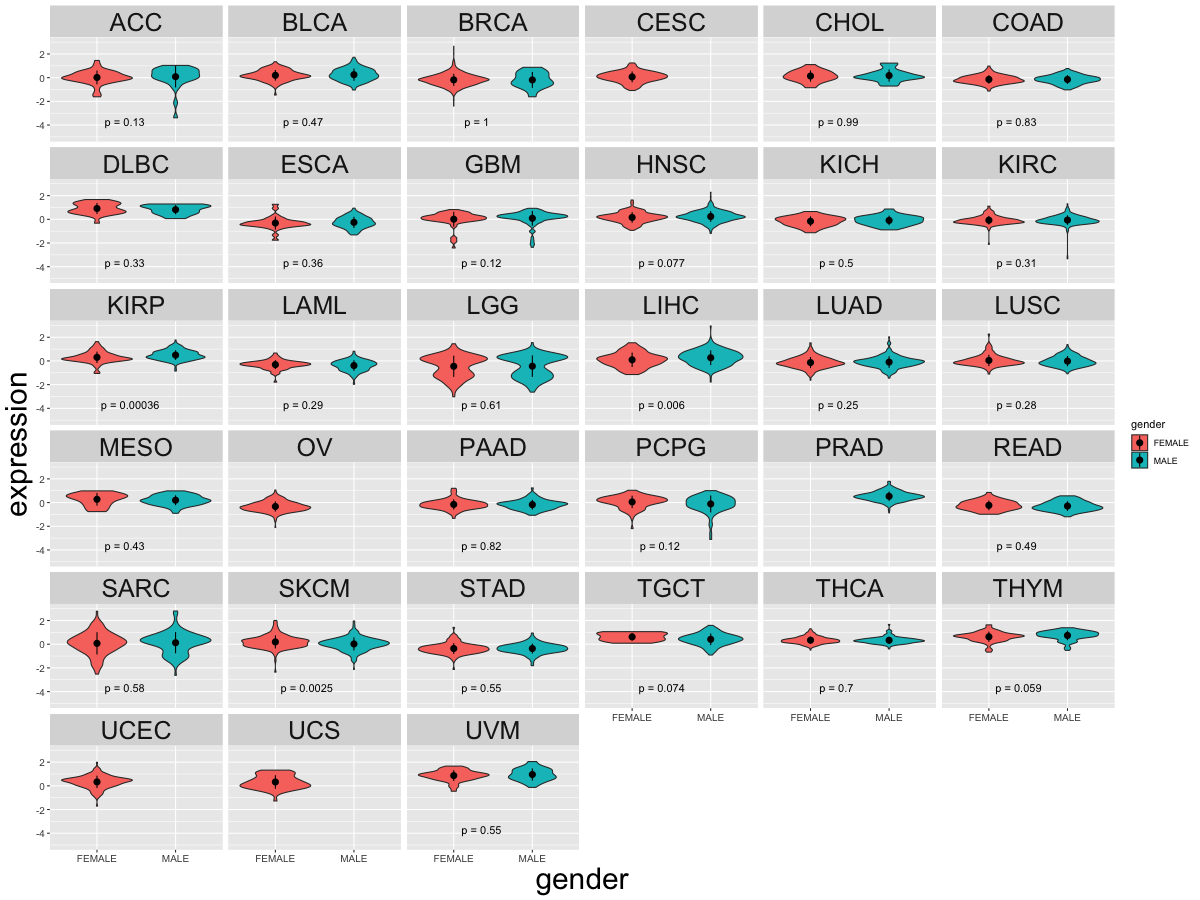 |
| Cancer type | Translation factor | pval | adj.p |
| KIRP | DRG2 | 0.000357100795738186 | 0.01 |
| SKCM | DRG2 | 0.00252248193914247 | 0.068 |
| LIHC | DRG2 | 0.00595089677171073 | 0.15 |
Top |
|
| Differential gene expression between young and old age groups (Wilcoxon test, pval<0.05) |
 |
| Cancer type | Translation factor | pval | adj.p |
| THCA | DRG2 | 0.0269284781703598 | 0.83 |
| LGG | DRG2 | 1.22502539955296e-10 | 4e-09 |
| ESCA | DRG2 | 0.0108754903878405 | 0.35 |
Top |
|
| Drugs targeting genes involved in this translation factor. (DrugBank Version 5.1.8 2021-05-08) |
| UniProtAcc | DrugBank ID | Drug name | Drug activity | Drug type | Drug status |
Top |
|
| Diseases associated with this translation factor. (DisGeNet 4.0) |
| Disease ID | Disease Name | # PubMeds | Disease source |
(UTHealth)
Web File Viewing | Emergency Information |Campus Carry|Site Policies