
|
||||||
|

Translation Factor: PATL2 (NCBI Gene ID:197135) |
|
 Gene Summary Gene Summary |
| Gene Information | Gene Name: PATL2 | Gene ID: 197135 | Gene Symbol | PATL2 | Gene ID | 197135 |
| Gene Name | PAT1 homolog 2 | |
| Synonyms | OOMD4|Pat1a|hPat1a | |
| Cytomap | 15q21.1 | |
| Type of Gene | protein-coding | |
| Description | protein PAT1 homolog 2PAT1-like protein 2protein PAT1 homolog aprotein associated with topoisomerase II homolog 2 | |
| Modification date | 20200313 | |
| UniProtAcc | C9JE40 | |
| Child GO biological process term(s) under GO:0006412 |
| GO ID | GO term |
| GO:0017148 | Negative regulation of translation |
| GO:0006417 | Regulation of translation |
| GO:0006412 | Translation |
| Gene ontology of translaction factor with evidence of Inferred from Direct Assay (IDA) from Entrez |
| Partner | Gene | GO ID | GO term | PubMed ID |
| Inferred gene age of translation factor. |
| Gene | Inferred gene age group among (0 - 67.6], (67.6 - 355.7], (355.7 - 733], (733 - 1119.25], >1119.25 |
| PATL2 | (355.7 - 733] |
Top |
|
| We searched PubMed using 'PATL2[title] AND translation [title] AND human.' |
| Gene | Title | PMID |
| PATL2 | . | . |
Top |
|
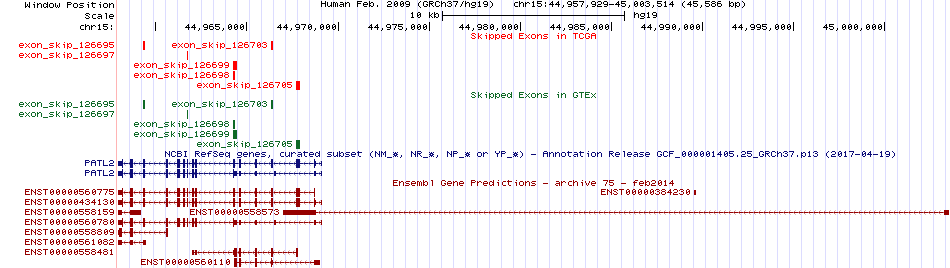
| Skipped exons in TCGA and GTEx based on Ensembl gene isoform structure. * Click on the image to open the UCSC genome browser with custom track showing this image in a new window. For more annotations, please visit our ExonSkipDB. |
 |
| Open reading frame (ORF) analsis of exon skipping events based on Ensembl gene isoform structure. * Click on the break point to see the gene structure around the break point region using the UCSC Genome Browser. |
| ENST | Exon skip start (DNA) | Exon Skip end (DNA) | ORF |
| Exon skipping position in the amino acid sequence. |
| ENST | Exon skip start (DNA) | Exon Skip end (DNA) | Len(transcript seq) | Exon skip start (mRNA) | Exon Skip end (mRNA) | Len(amino acid seq) | Exon skip start (AA) | Exon Skip end (AA) |
| Potentially (partially) lost protein functional features of UniProt. |
| UniProtAcc | Exon skip start (AA) | Exon Skip end (AA) | Function feature start (AA) | Function feature end (AA) | Functional feature type | Functional feature desc. |
Top |
|
| Gene expression level across TCGA pancancer |
 |
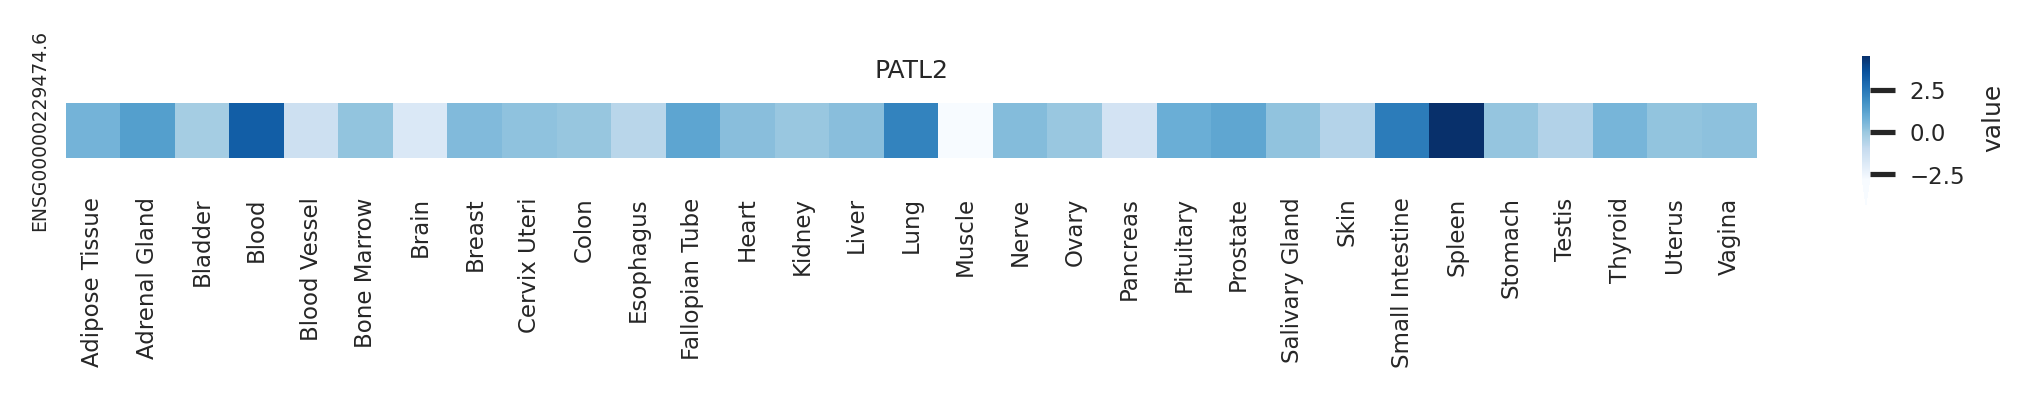
| Gene expression level across GTEx pantissue |
 |
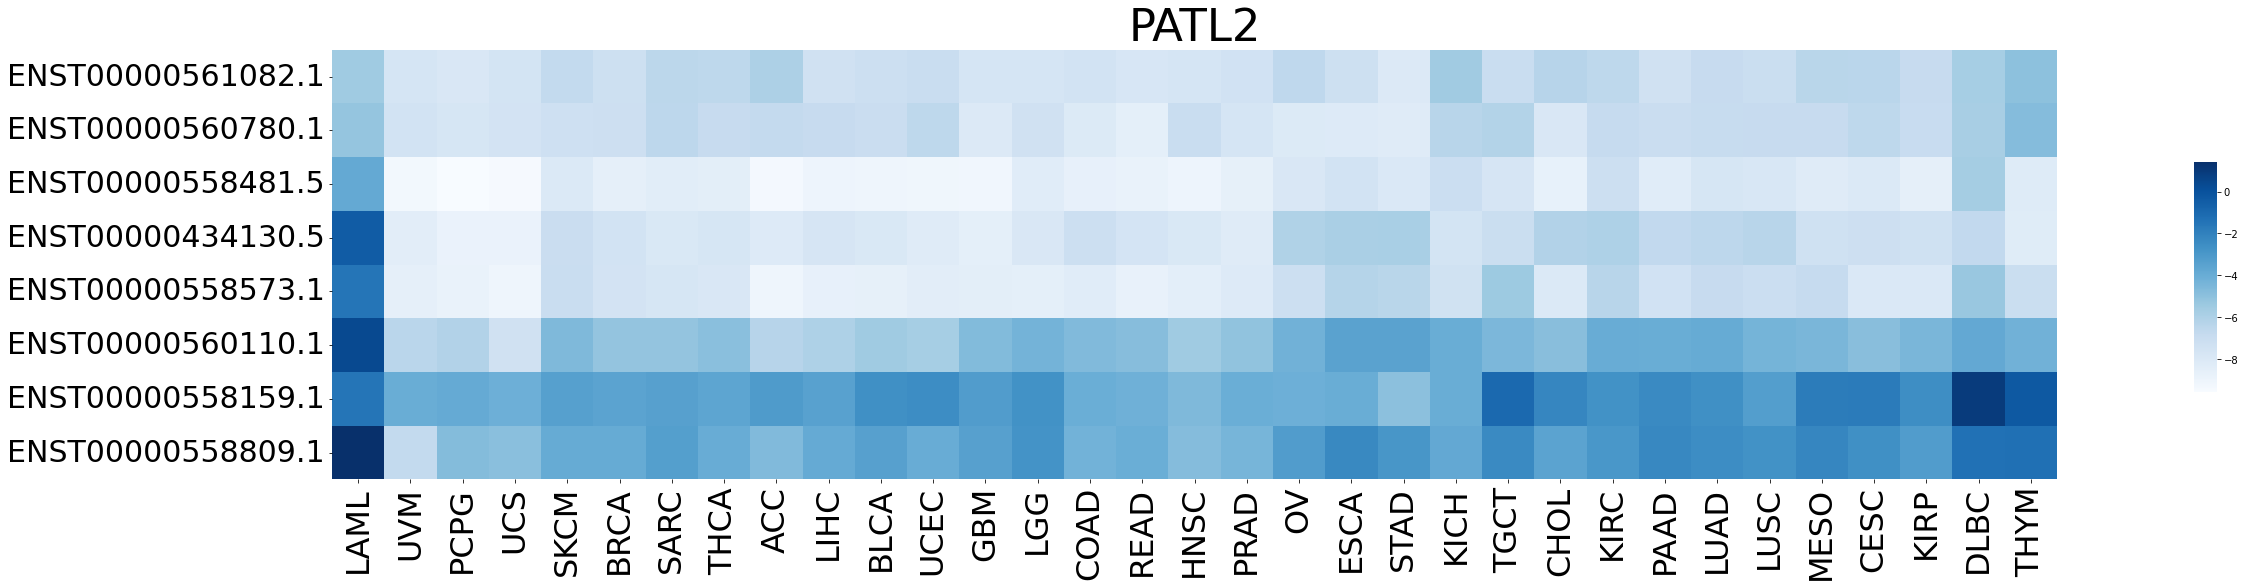
| Expression level of gene isoforms across TCGA pancancer |
 |
| Expression level of gene isoforms across GTEx pantissue |
 |
| Cancer(tissue) type-specific expression level of Translation factor using z-score distriution |
 |
| Differential expression between tumor and matched normal (in the cancer types with more than 10 matched samples) |
 |
| Cancer type | Translation factor | FC | adj.pval |
| LUAD | PATL2 | -2.53293713200388 | 0.0219209391678432 |
Top |
|
| Translation factor expression regulation through miRNA binding |
| Cancer type | Gene | miRNA | TargetScan binding score (Context++ score percentile) | Coefficient | Pvalue |
| Translation factor expression regulation through methylation in the promoter of Translation factor |
 |
| Cancer type | Gene | methyl group b | methyl group a | DEG pval | avg methyl in b | avg methyl in a | avg exp in b | avg exp in a |
| Translation factor expression regulation through methylation in the gene body of Translation factor (positive regulation) |
 |
| Cancer type | Gene | methyl group b | methyl group a | DEG pval | avg methyl in b | avg methyl in a | avg exp in b | avg exp in a |
| Translation factor expression regulation through copy number variation of Translation factor |
 |
| Cancer type | Gene | Coefficient | Pvalue |
| PAAD | PATL2 | -0.09558218 | 0.015366231 |
Top |
|
| Strongly correlated genes belong to cellular important gene groups with PATL2 (coefficient>0.8, pval<0.05, node color based on FC between tumor and matched normal). Significantly associated important genes in the individual cancer types. * Cell metabolism gene: cell metabolism genes from REACTOME (black edge), IUPHAR: drug target genes from IUPHAR (blue edge), Kinase: human kinase genes (brown edge), CGC: cancer gene census genes (orange edge), TSG: tumor suppresor genes (purple edge), Epifactor: epigenetic factors (light blue edge), TF: transcription factors (green) |
 |
| Cancer type | Gene group | Translation factor | Correlated gene | Coefficient | Pvalue |
| TGCT | Cell metabolism gene | PATL2 | PSMB9 | 0.815163641 | 2.37E-38 |
| TGCT | CGC | PATL2 | CIITA | 0.801053747 | 3.81E-36 |
| TGCT | CGC | PATL2 | RHOH | 0.813884267 | 3.82E-38 |
| TGCT | CGC | PATL2 | CD74 | 0.815010812 | 2.51E-38 |
| TGCT | CGC | PATL2 | BIRC3 | 0.815104923 | 2.42E-38 |
| TGCT | CGC | PATL2 | JAK3 | 0.833040724 | 1.95E-41 |
| TGCT | CGC | PATL2 | P2RY8 | 0.853622398 | 1.80E-45 |
| TGCT | CGC | PATL2 | WAS | 0.856144588 | 5.22E-46 |
| TGCT | CGC | PATL2 | IKZF1 | 0.861945603 | 2.77E-47 |
| TGCT | Epifactor | PATL2 | SP140 | 0.812930066 | 5.44E-38 |
| TGCT | Epifactor | PATL2 | GFI1 | 0.860660167 | 5.37E-47 |
| TGCT | Epifactor | PATL2 | IKZF1 | 0.861945603 | 2.77E-47 |
| TGCT | IUPHAR | PATL2 | RIPK3 | 0.800159863 | 5.18E-36 |
| TGCT | IUPHAR | PATL2 | CSF2RB | 0.800796566 | 4.16E-36 |
| TGCT | IUPHAR | PATL2 | CIITA | 0.801053747 | 3.81E-36 |
| TGCT | IUPHAR | PATL2 | CXCR6 | 0.801719603 | 3.02E-36 |
| TGCT | IUPHAR | PATL2 | FGR | 0.804761122 | 1.04E-36 |
| TGCT | IUPHAR | PATL2 | GPR132 | 0.805775649 | 7.28E-37 |
| TGCT | IUPHAR | PATL2 | GZMA | 0.807951779 | 3.35E-37 |
| TGCT | IUPHAR | PATL2 | TAP1 | 0.808494781 | 2.75E-37 |
| TGCT | IUPHAR | PATL2 | CTLA4 | 0.808542326 | 2.71E-37 |
| TGCT | IUPHAR | PATL2 | PDCD1 | 0.810945076 | 1.13E-37 |
| TGCT | IUPHAR | PATL2 | SP140 | 0.812930066 | 5.44E-38 |
| TGCT | IUPHAR | PATL2 | CD74 | 0.815010812 | 2.51E-38 |
| TGCT | IUPHAR | PATL2 | BIRC3 | 0.815104923 | 2.42E-38 |
| TGCT | IUPHAR | PATL2 | PSMB9 | 0.815163641 | 2.37E-38 |
| TGCT | IUPHAR | PATL2 | GPR18 | 0.817413839 | 1.01E-38 |
| TGCT | IUPHAR | PATL2 | IL2RG | 0.819875541 | 3.93E-39 |
| TGCT | IUPHAR | PATL2 | CD27 | 0.822989273 | 1.17E-39 |
| TGCT | IUPHAR | PATL2 | MCOLN2 | 0.826109506 | 3.37E-40 |
| TGCT | IUPHAR | PATL2 | GPR65 | 0.827774081 | 1.72E-40 |
| TGCT | IUPHAR | PATL2 | CD247 | 0.82934526 | 9.06E-41 |
| TGCT | IUPHAR | PATL2 | IL10RA | 0.830213552 | 6.34E-41 |
| TGCT | IUPHAR | PATL2 | GZMK | 0.832164899 | 2.82E-41 |
| TGCT | IUPHAR | PATL2 | JAK3 | 0.833040724 | 1.95E-41 |
| TGCT | IUPHAR | PATL2 | CD2 | 0.835495142 | 6.90E-42 |
| TGCT | IUPHAR | PATL2 | PTPN22 | 0.838356 | 2.01E-42 |
| TGCT | IUPHAR | PATL2 | CXCR3 | 0.839351173 | 1.30E-42 |
| TGCT | IUPHAR | PATL2 | PYHIN1 | 0.843031985 | 2.54E-43 |
| TGCT | IUPHAR | PATL2 | CD3E | 0.844617042 | 1.24E-43 |
| TGCT | IUPHAR | PATL2 | CD6 | 0.844894995 | 1.09E-43 |
| TGCT | IUPHAR | PATL2 | ITGB7 | 0.849136458 | 1.53E-44 |
| TGCT | IUPHAR | PATL2 | AIM2 | 0.849962987 | 1.04E-44 |
| TGCT | IUPHAR | PATL2 | GPR171 | 0.851997439 | 3.94E-45 |
| TGCT | IUPHAR | PATL2 | P2RY8 | 0.853622398 | 1.80E-45 |
| TGCT | IUPHAR | PATL2 | ITGAL | 0.860802427 | 4.99E-47 |
| TGCT | IUPHAR | PATL2 | NLRC3 | 0.872864495 | 7.54E-50 |
| TGCT | IUPHAR | PATL2 | CD37 | 0.87294174 | 7.21E-50 |
| TGCT | IUPHAR | PATL2 | NLRC5 | 0.896744097 | 2.15E-56 |
| TGCT | Kinase | PATL2 | RIPK3 | 0.800159863 | 5.18E-36 |
| TGCT | Kinase | PATL2 | FGR | 0.804761122 | 1.04E-36 |
| TGCT | Kinase | PATL2 | JAK3 | 0.833040724 | 1.95E-41 |
| TGCT | TF | PATL2 | STAT4 | 0.802661635 | 2.18E-36 |
| TGCT | TF | PATL2 | RUNX3 | 0.812061548 | 7.50E-38 |
| TGCT | TF | PATL2 | SP140 | 0.812930066 | 5.44E-38 |
| TGCT | TF | PATL2 | TBX21 | 0.844996978 | 1.04E-43 |
| TGCT | TF | PATL2 | ZNF831 | 0.856288092 | 4.86E-46 |
| TGCT | TF | PATL2 | GFI1 | 0.860660167 | 5.37E-47 |
| TGCT | TF | PATL2 | IKZF1 | 0.861945603 | 2.77E-47 |
| TGCT | TSG | PATL2 | DOK3 | 0.811829093 | 8.17E-38 |
| TGCT | TSG | PATL2 | RUNX3 | 0.812061548 | 7.50E-38 |
| TGCT | TSG | PATL2 | TNFAIP8L2 | 0.817443134 | 1.00E-38 |
| TGCT | TSG | PATL2 | RASSF5 | 0.833380147 | 1.69E-41 |
| TGCT | TSG | PATL2 | PYHIN1 | 0.843031985 | 2.54E-43 |
| TGCT | TSG | PATL2 | DENND2D | 0.846107989 | 6.26E-44 |
| TGCT | TSG | PATL2 | AIM2 | 0.849962987 | 1.04E-44 |
| TGCT | TSG | PATL2 | IKZF1 | 0.861945603 | 2.77E-47 |
| UVM | CGC | PATL2 | B2M | 0.837293224 | 3.78E-22 |
| UVM | IUPHAR | PATL2 | NLRC5 | 0.801854795 | 4.01E-19 |
| UVM | IUPHAR | PATL2 | AIM2 | 0.808103596 | 1.30E-19 |
| UVM | IUPHAR | PATL2 | TAP1 | 0.809213828 | 1.06E-19 |
| UVM | TF | PATL2 | STAT1 | 0.816094256 | 2.92E-20 |
| UVM | TF | PATL2 | IRF1 | 0.830404624 | 1.66E-21 |
| UVM | TSG | PATL2 | GBP1 | 0.807837913 | 1.37E-19 |
| UVM | TSG | PATL2 | AIM2 | 0.808103596 | 1.30E-19 |
| UVM | TSG | PATL2 | STAT1 | 0.816094256 | 2.92E-20 |
| UVM | TSG | PATL2 | IRF1 | 0.830404624 | 1.66E-21 |
Top |
|
| Protein 3D structure Visit iCn3D. |
Top |
|
| Protein-protein interaction networks * Overlap between up-regulated DEGs (log2FC<-1 and adj.P<0.05) and STRING PPI network (center: Translation factor, node: DEGs, edges: weighted by -log2(adj.P)) |
 |
| Overlap between down-regulated DEGs (log2FC>1 and adj.P<0.05) and STRING PPI network (center: Translation factor, node: DEGs, edges: weighted by -log2(adj.P)) |
 |
 * Edge colors based on TCGA cancer types. |
| * Overlap between DEGs (log2FC>1 and adj.P<0.05) and STRING PPI network per cancer (center: Translation factor, node: DEGs, node color: log2FC, edges: weighted by -log2(adj.P)) |
 |
| Cancer type | Translation factor | Interacting protein coding gene | FC | adj.pval |
| LUAD | PATL2 | LSM1 | -2.25310461629053 | 0.000250126280442223 |
| THCA | PATL2 | LSM4 | -1.7720393464767 | 0.00053867884007499 |
| HNSC | PATL2 | LSM5 | -2.42626046370549 | 0.0014147440645047 |
| ESCA | PATL2 | LSM7 | -2.31243124209969 | 0.0029296875 |
| THCA | PATL2 | LSM7 | -1.257555185578 | 0.00448578010535268 |
| ESCA | PATL2 | LSM5 | -2.94289921304876 | 0.009765625 |
| KIRC | PATL2 | DCP2 | 1.26475649682567 | 0.0124189994647713 |
| ESCA | PATL2 | LSM4 | -1.10763832306386 | 0.013671875 |
| STAD | PATL2 | LSM5 | -2.04224010610308 | 0.0148032568395138 |
| THCA | PATL2 | LSM1 | -1.2467434703155 | 0.0168973193592333 |
| HNSC | PATL2 | LSM2 | -1.16751559143959 | 0.0177602205276344 |
| HNSC | PATL2 | XRN1 | 1.48932008251589 | 0.0217607007634797 |
| LIHC | PATL2 | LSM7 | -1.74964110437643 | 0.0251194595851845 |
| COAD | PATL2 | LSM7 | 2.30429568056628 | 1.2814998626709e-06 |
| BRCA | PATL2 | LSM5 | -3.47385312153922 | 1.5252788990783e-09 |
| STAD | PATL2 | LSM4 | -7.46687657673868 | 2.26888805627823e-05 |
| COAD | PATL2 | LSM4 | 2.16462365278872 | 2.27093696594239e-05 |
| BRCA | PATL2 | LSM2 | -2.87365292130904 | 3.37458938836032e-08 |
| BRCA | PATL2 | LSM4 | -2.45028637685104 | 3.44605555708978e-29 |
| KIRC | PATL2 | LSM4 | 1.00210951357873 | 3.97470828213212e-07 |
| LUAD | PATL2 | LSM4 | -1.48392189129577 | 4.20890892730867e-05 |
| KICH | PATL2 | LSM2 | 1.66342090505246 | 5.24520874023437e-06 |
| LUAD | PATL2 | LSM5 | -4.9594264060254 | 5.68692060030821e-07 |
| LIHC | PATL2 | LSM2 | -2.21541388815629 | 7.4950933254918e-06 |
| THCA | PATL2 | DDX6 | -4.18593714762416 | 8.3083675979354e-06 |
| Protein-protein interactors with this translation factor (BIOGRID-3.4.160) |
| PPI interactors with PATL2 |
| DNAH5, RRBP1, |
Top |
|
| Clinically associated variants from ClinVar. |
| Gene | Chr | Position | RefSeq | VarSeq | RefSeeq | VarType | Pathogenic | Disease | VarInfo |
| PATL2 | chr15 | 44958010 | A | T | single_nucleotide_variant | Uncertain_significance | not_provided | SO:0001624|3_prime_UTR_variant | SO:0001624|3_prime_UTR_variant |
| PATL2 | chr15 | 44958652 | T | C | single_nucleotide_variant | Benign | not_provided | SO:0001819|synonymous_variant | SO:0001819|synonymous_variant |
| PATL2 | chr15 | 44958673 | G | C | single_nucleotide_variant | Likely_benign | not_provided | SO:0001819|synonymous_variant | SO:0001819|synonymous_variant |
| PATL2 | chr15 | 44960683 | G | T | single_nucleotide_variant | Uncertain_significance | not_provided | SO:0001627|intron_variant | SO:0001627|intron_variant |
| PATL2 | chr15 | 44961176 | A | G | single_nucleotide_variant | Pathogenic | Oocyte_maturation_defect_4 | SO:0001575|splice_donor_variant | SO:0001575|splice_donor_variant |
| PATL2 | chr15 | 44961294 | C | T | single_nucleotide_variant | Uncertain_significance | Oocyte_maturation_defect_4 | SO:0001583|missense_variant | SO:0001583|missense_variant |
| PATL2 | chr15 | 44961589 | A | G | single_nucleotide_variant | Uncertain_significance | Oocyte_maturation_defect_4 | SO:0001583|missense_variant | SO:0001583|missense_variant |
| PATL2 | chr15 | 44962012 | C | T | single_nucleotide_variant | Uncertain_significance | Oocyte_maturation_defect_4 | SO:0001583|missense_variant | SO:0001583|missense_variant |
| PATL2 | chr15 | 44962067 | G | A | single_nucleotide_variant | Likely_pathogenic | Oocyte_maturation_defect_4 | SO:0001587|nonsense | SO:0001587|nonsense |
| PATL2 | chr15 | 44964221 | A | T | single_nucleotide_variant | Likely_pathogenic | Oocyte_maturation_defect_4 | SO:0001583|missense_variant,SO:0001627|intron_variant | SO:0001583|missense_variant,SO:0001627|intron_variant |
| PATL2 | chr15 | 44964304 | A | C | single_nucleotide_variant | Likely_pathogenic | Oocyte_maturation_defect_4 | SO:0001583|missense_variant,SO:0001623|5_prime_UTR_variant,SO:0001627|intron_variant | SO:0001583|missense_variant,SO:0001623|5_prime_UTR_variant,SO:0001627|intron_variant |
| PATL2 | chr15 | 44964312 | A | T | single_nucleotide_variant | Pathogenic | Oocyte_maturation_defect_4 | SO:0001587|nonsense,SO:0001623|5_prime_UTR_variant,SO:0001627|intron_variant | SO:0001587|nonsense,SO:0001623|5_prime_UTR_variant,SO:0001627|intron_variant |
| PATL2 | chr15 | 44964623 | G | A | single_nucleotide_variant | Likely_pathogenic | Oocyte_maturation_defect_2|Oocyte_maturation_defect_4 | SO:0001587|nonsense,SO:0001623|5_prime_UTR_variant | SO:0001587|nonsense,SO:0001623|5_prime_UTR_variant |
| PATL2 | chr15 | 44966389 | T | C | single_nucleotide_variant | Benign | Oocyte_maturation_defect_4 | SO:0001583|missense_variant,SO:0001627|intron_variant | SO:0001583|missense_variant,SO:0001627|intron_variant |
| PATL2 | chr15 | 44966429 | CTGGAACAGGAGGG | C | Deletion | Pathogenic | Oocyte_maturation_defect_4 | SO:0001574|splice_acceptor_variant,SO:0001627|intron_variant | SO:0001574|splice_acceptor_variant,SO:0001627|intron_variant |
| nsSNVs with sample frequency (size of circle) from TCGA 33 cancers. |
 |
| SNVs and Indels |
| Gene | Cancer type | Chromosome | Start | End | RefSeeq | MutSeq | Mutation type | AAchange | # samples |
| PATL2 | BRCA | chr15 | 44965451 | 44965451 | G | A | Missense_Mutation | p.S143L | 4 |
| PATL2 | UCEC | chr15 | 44960623 | 44960623 | C | T | Missense_Mutation | p.E428K | 4 |
| PATL2 | ACC | chr15 | 44964347 | 44964347 | C | A | Missense_Mutation | p.A175S | 3 |
| PATL2 | BRCA | chr15 | 44962197 | 44962197 | G | A | Missense_Mutation | p.P249L | 3 |
| PATL2 | PRAD | chr15 | 44966389 | 44966389 | T | C | Missense_Mutation | p.M88V | 3 |
| PATL2 | ESCA | chr15 | 44960587 | 44960587 | G | A | Missense_Mutation | p.P440S | 2 |
| PATL2 | LIHC | chr15 | 44960660 | 44960660 | T | - | Frame_Shift_Del | p.K415fs | 2 |
| PATL2 | ESCA | chr15 | 44961491 | 44961491 | G | A | Nonsense_Mutation | p.Q351* | 2 |
| PATL2 | CESC | chr15 | 44965451 | 44965451 | G | A | Missense_Mutation | 2 | |
| PATL2 | UCEC | chr15 | 44961567 | 44961567 | C | T | Silent | p.R325 | 2 |
| PATL2 | UCEC | chr15 | 44961718 | 44961718 | C | T | Missense_Mutation | p.R307Q | 2 |
| PATL2 | SARC | chr15 | 44961245 | 44961245 | G | T | Missense_Mutation | 2 | |
| PATL2 | UCEC | chr15 | 44962208 | 44962208 | C | T | Silent | p.K245 | 2 |
| PATL2 | UCEC | chr15 | 44966425 | 44966425 | C | T | Missense_Mutation | p.A76T | 2 |
| PATL2 | COAD | chr15 | 44962250 | 44962250 | G | A | Silent | p.D231D | 1 |
| PATL2 | LIHC | chr15 | 44964221 | 44964221 | A | G | Missense_Mutation | p.Y217H | 1 |
| PATL2 | TGCT | chr15 | 44958652 | 44958652 | T | C | Missense_Mutation | 1 | |
| PATL2 | COAD | chr15 | 44964622 | 44964622 | C | T | Missense_Mutation | p.R160Q | 1 |
| PATL2 | LIHC | chr15 | 44961589 | 44961589 | A | G | Missense_Mutation | p.I318T | 1 |
| PATL2 | THYM | chr15 | 44968674 | 44968674 | T | C | Silent | 1 | |
| PATL2 | THYM | chr15 | 44964267 | 44964267 | C | T | Silent | p.V201V | 1 |
| PATL2 | LIHC | chr15 | 44964626 | 44964626 | G | - | Frame_Shift_Del | p.Q159fs | 1 |
| PATL2 | THYM | chr15 | 44965491 | 44965491 | G | A | Missense_Mutation | p.P130S | 1 |
| PATL2 | ESCA | chr15 | 44961491 | 44961491 | G | A | Nonsense_Mutation | p.Q351X | 1 |
| PATL2 | LIHC | chr15 | 44966409 | 44966409 | G | - | Frame_Shift_Del | p.P81fs | 1 |
| PATL2 | THYM | chr15 | 44968674 | 44968674 | T | C | Silent | p.E5E | 1 |
| PATL2 | KIRC | chr15 | 44964245 | 44964245 | C | A | Missense_Mutation | p.A209S | 1 |
| PATL2 | LIHC | chr15 | 44959362 | 44959362 | C | - | Frame_Shift_Del | p.E469fs | 1 |
| PATL2 | KIRC | chr15 | 44962242 | 44962242 | A | G | Missense_Mutation | p.L234P | 1 |
| PATL2 | CESC | chr15 | 44958662 | 44958662 | G | T | Missense_Mutation | 1 | |
| PATL2 | KIRC | chr15 | 44965468 | 44965468 | G | A | Silent | p.F137F | 1 |
| PATL2 | SARC | chr15 | 44958658 | 44958658 | G | T | Missense_Mutation | 1 | |
| PATL2 | COAD | chr15 | 44961211 | 44961211 | C | T | Silent | p.L397L | 1 |
| PATL2 | KIRC | chr15 | 44964348 | 44964349 | - | G | Frame_Shift_Ins | p.P174fs | 1 |
| PATL2 | COAD | chr15 | 44961988 | 44961988 | C | A | Missense_Mutation | p.G288V | 1 |
| PATL2 | LIHC | chr15 | 44961753 | 44961753 | T | C | Silent | 1 | |
| PATL2 | SARC | chr15 | 44959356 | 44959356 | G | A | Silent | 1 | |
| PATL2 | COAD | chr15 | 44962066 | 44962066 | C | T | Missense_Mutation | p.R262Q | 1 |
| PATL2 | LIHC | chr15 | 44967716 | 44967716 | G | T | Missense_Mutation | 1 | |
| PATL2 | SARC | chr15 | 44958658 | 44958658 | G | T | Missense_Mutation | p.S515R | 1 |
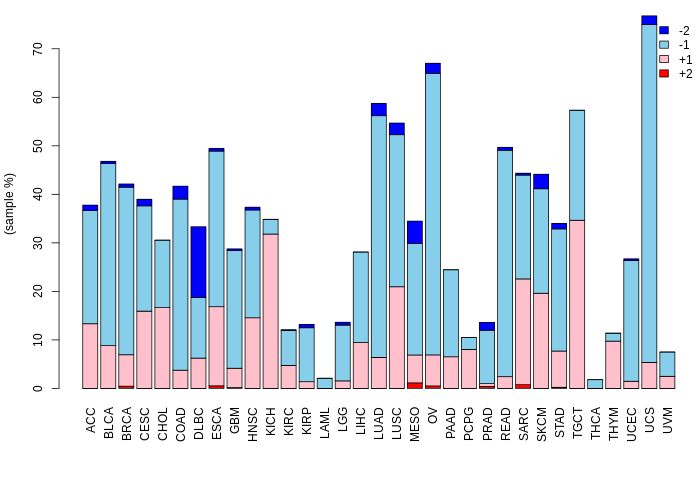
| Copy number variation (CNV) of PATL2 * Click on the image to open the original image in a new window. |
 |
| Fusion gene breakpoints (product of the structural variants (SVs)) across PATL2 * Click on the image to open the UCSC genome browser with custom track showing this image in a new window. |
 |
| Fusion genes with this translation factor from FusionGDB2.0. |
| FusionGDB2 ID | Disease | Sample | Hgene | Hchr | Hbp | Hstrand | Tgene | Tchr | Tbp | Tstrand |
| 56255 | CESC | TCGA-IR-A3LA-01A | B2M | chr15 | 45003811 | + | PATL2 | chr15 | 44968763 | - |
| 56255 | STAD | TCGA-VQ-A92D | FMN1 | chr15 | 33357157 | - | PATL2 | chr15 | 44968763 | - |
| 56255 | STAD | TCGA-VQ-A92D-01A | FMN1 | chr15 | 33357158 | - | PATL2 | chr15 | 44968763 | - |
| 56255 | Non-Cancer | TCGA-BH-A1EV-11A | MYEF2 | chr15 | 48458130 | - | PATL2 | chr15 | 44968763 | - |
| 62921 | N/A | GW493008 | PATL2 | chr15 | 44996699 | + | DSC2 | chr18 | 28645946 | + |
| 85147 | N/A | FN074041 | PATL2 | chr15 | 45002141 | - | SOGA3 | chr6 | 127774986 | - |
Top |
|
| Kaplan-Meier plots with logrank tests of overall survival (OS) |
 |
| Cancer type | Translation factor | Coefficent | Hazard ratio | Wald test pval | Likelihool ratio pval | Logrank test pval | # samples |
Top |
|
| Differential gene expression between female and male. (Wilcoxon test, pval<0.05) |
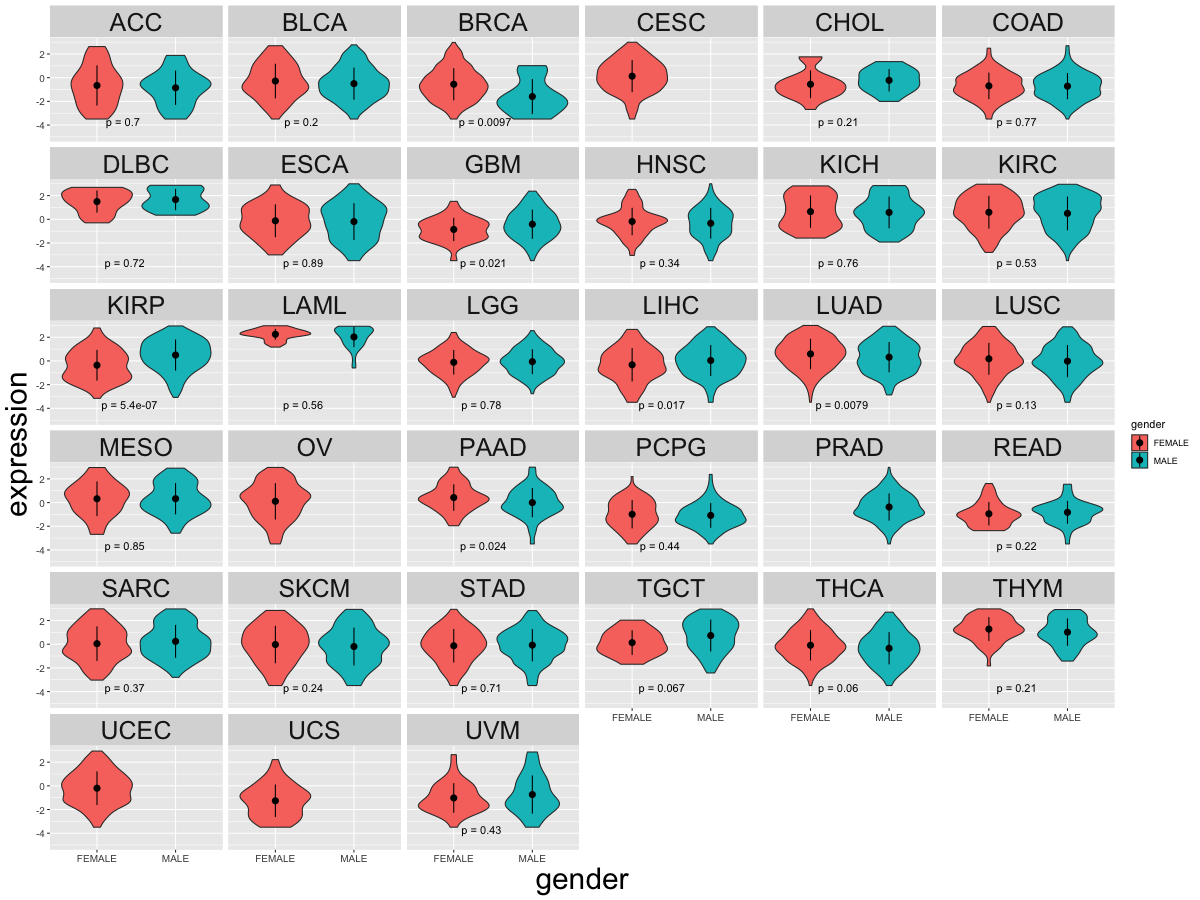 |
| Cancer type | Translation factor | pval | adj.p |
| LUAD | PATL2 | 0.00626661449126391 | 0.17 |
| BRCA | PATL2 | 0.00797186031052162 | 0.21 |
| LIHC | PATL2 | 0.0167227035987587 | 0.42 |
| PAAD | PATL2 | 0.0248622880283459 | 0.6 |
| GBM | PATL2 | 0.0275015584212043 | 0.63 |
| KIRP | PATL2 | 2.33850900583492e-07 | 6.5e-06 |
Top |
|
| Differential gene expression between young and old age groups (Wilcoxon test, pval<0.05) |
 |
| Cancer type | Translation factor | pval | adj.p |
| LUSC | PATL2 | 0.0412335731340031 | 1 |
| KIRP | PATL2 | 0.0273014551289126 | 0.87 |
| COAD | PATL2 | 0.0207114141303662 | 0.68 |
Top |
|
| Drugs targeting genes involved in this translation factor. (DrugBank Version 5.1.8 2021-05-08) |
| UniProtAcc | DrugBank ID | Drug name | Drug activity | Drug type | Drug status |
Top |
|
| Diseases associated with this translation factor. (DisGeNet 4.0) |
| Disease ID | Disease Name | # PubMeds | Disease source |
| C4540284 | OOCYTE MATURATION DEFECT 4 | 2 | UNIPROT |
(UTHealth)
Web File Viewing | Emergency Information |Campus Carry|Site Policies