
|
||||||
|

Translation Factor: EIF4EBP2 (NCBI Gene ID:1979) |
|
 Gene Summary Gene Summary |
| Gene Information | Gene Name: EIF4EBP2 | Gene ID: 1979 | Gene Symbol | EIF4EBP2 | Gene ID | 1979 |
| Gene Name | eukaryotic translation initiation factor 4E binding protein 2 | |
| Synonyms | 4EBP2|PHASII | |
| Cytomap | 10q22.1 | |
| Type of Gene | protein-coding | |
| Description | eukaryotic translation initiation factor 4E-binding protein 24E-BP2eIF4E-binding protein 2phosphorylated, heat and acid stable regulated by insulin protein II | |
| Modification date | 20200313 | |
| UniProtAcc | Q13542 | |
| Child GO biological process term(s) under GO:0006412 |
| GO ID | GO term |
| GO:0017148 | Negative regulation of translation |
| GO:0006417 | Regulation of translation |
| GO:0006413 | Translational initiation |
| GO:0006412 | Translation |
| Gene ontology of translaction factor with evidence of Inferred from Direct Assay (IDA) from Entrez |
| Partner | Gene | GO ID | GO term | PubMed ID |
| Inferred gene age of translation factor. |
| Gene | Inferred gene age group among (0 - 67.6], (67.6 - 355.7], (355.7 - 733], (733 - 1119.25], >1119.25 |
| EIF4EBP2 | (733 - 1119.25] |
Top |
|
| We searched PubMed using 'EIF4EBP2[title] AND translation [title] AND human.' |
| Gene | Title | PMID |
| EIF4EBP2 | . | . |
Top |
|
| Skipped exons in TCGA and GTEx based on Ensembl gene isoform structure. * Click on the image to open the UCSC genome browser with custom track showing this image in a new window. For more annotations, please visit our ExonSkipDB. |
 |
| Open reading frame (ORF) analsis of exon skipping events based on Ensembl gene isoform structure. * Click on the break point to see the gene structure around the break point region using the UCSC Genome Browser. |
| ENST | Exon skip start (DNA) | Exon Skip end (DNA) | ORF |
| Exon skipping position in the amino acid sequence. |
| ENST | Exon skip start (DNA) | Exon Skip end (DNA) | Len(transcript seq) | Exon skip start (mRNA) | Exon Skip end (mRNA) | Len(amino acid seq) | Exon skip start (AA) | Exon Skip end (AA) |
| Potentially (partially) lost protein functional features of UniProt. |
| UniProtAcc | Exon skip start (AA) | Exon Skip end (AA) | Function feature start (AA) | Function feature end (AA) | Functional feature type | Functional feature desc. |
Top |
|
| Gene expression level across TCGA pancancer |
 |
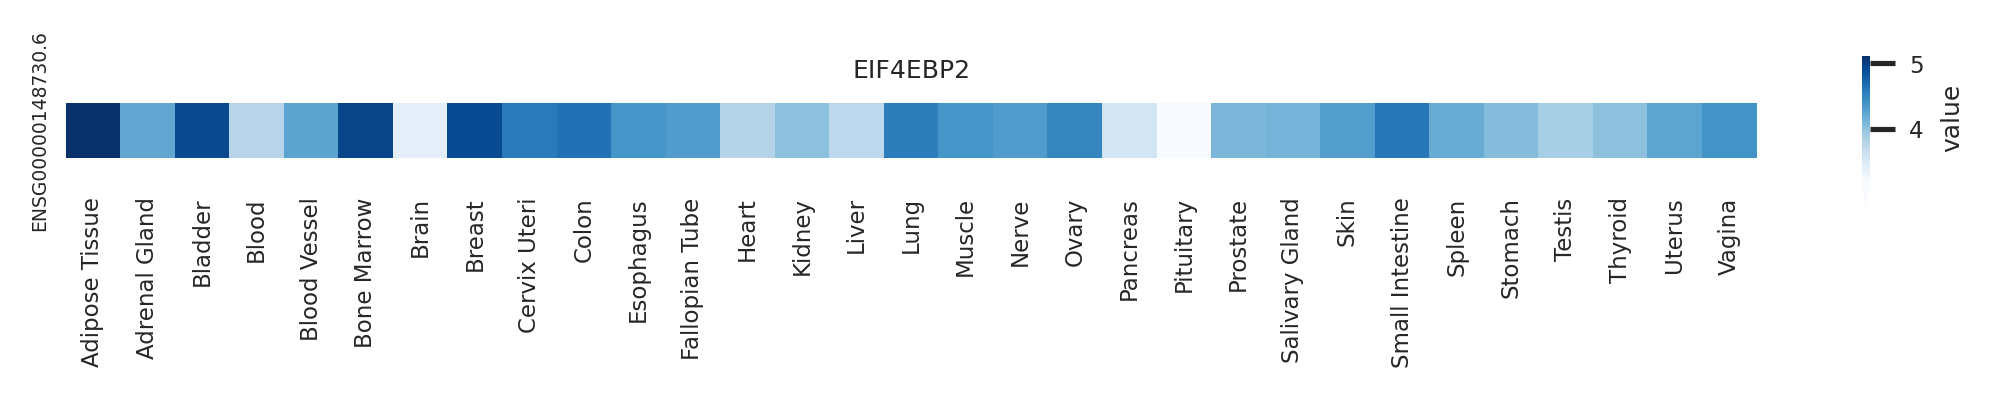
| Gene expression level across GTEx pantissue |
 |
| Expression level of gene isoforms across TCGA pancancer |
 |
| Expression level of gene isoforms across GTEx pantissue |
 |
| Cancer(tissue) type-specific expression level of Translation factor using z-score distriution |
 |
| Differential expression between tumor and matched normal (in the cancer types with more than 10 matched samples) |
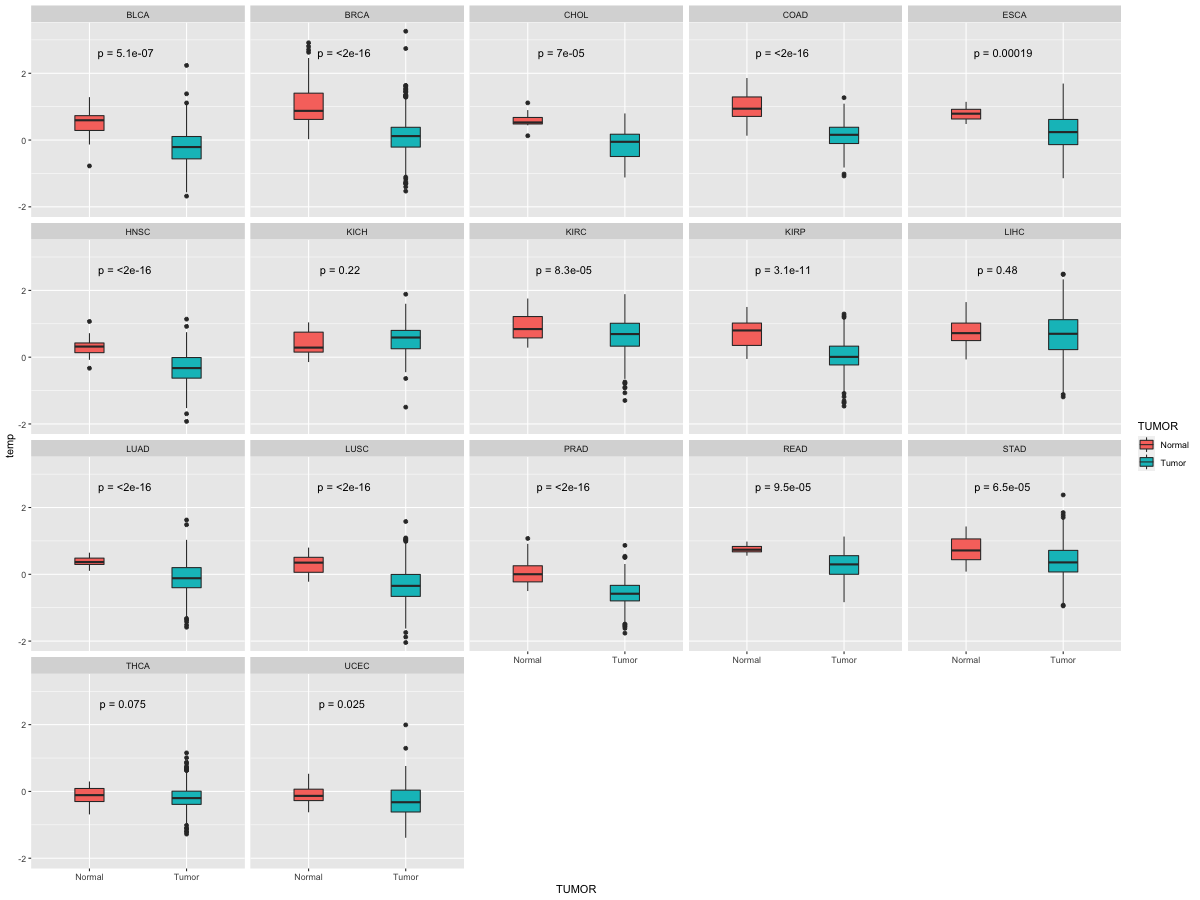 |
| Cancer type | Translation factor | FC | adj.pval |
| KIRP | EIF4EBP2 | -1.56598825328231 | 0.000234263017773628 |
| STAD | EIF4EBP2 | -1.31747176502436 | 0.000713176093995571 |
| BRCA | EIF4EBP2 | -2.12094117076536 | 4.28343095744558e-22 |
| PRAD | EIF4EBP2 | 1.54226259249754 | 9.23299304763812e-08 |
| COAD | EIF4EBP2 | -2.26222876251036 | 9.83476638793947e-07 |
Top |
|
| Translation factor expression regulation through miRNA binding |
| Cancer type | Gene | miRNA | TargetScan binding score (Context++ score percentile) | Coefficient | Pvalue |
| KIRP | EIF4EBP2 | hsa-miR-182-5p | 86 | 0.330842259006816 | 0.00303481856701657 |
| KIRP | EIF4EBP2 | hsa-miR-96-5p | 97 | 0.320813047711782 | 0.00409968705958751 |
| Translation factor expression regulation through methylation in the promoter of Translation factor |
 |
| Cancer type | Gene | methyl group b | methyl group a | DEG pval | avg methyl in b | avg methyl in a | avg exp in b | avg exp in a |
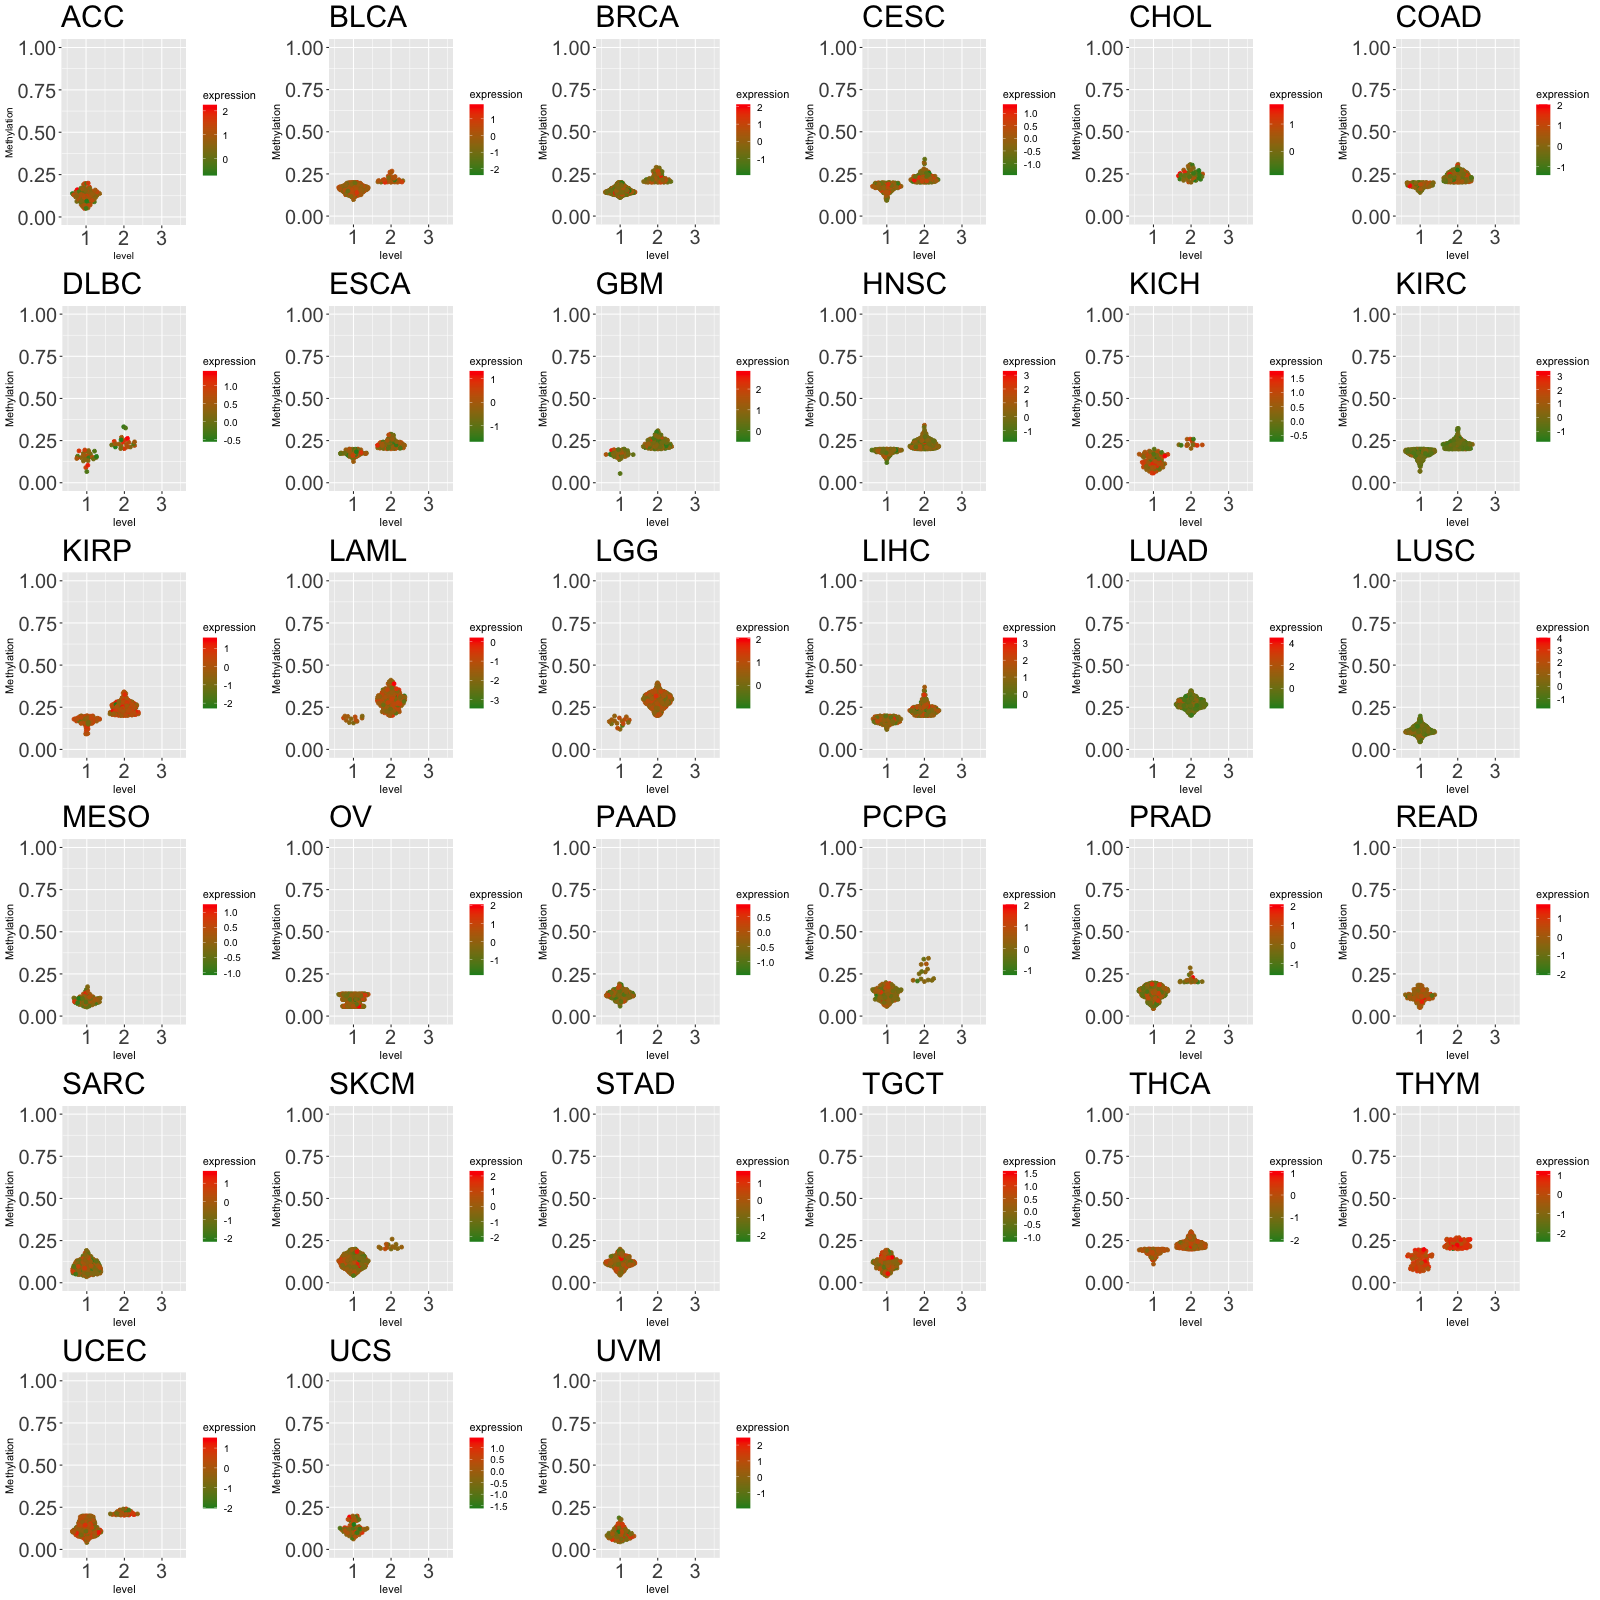
| Translation factor expression regulation through methylation in the gene body of Translation factor (positive regulation) |
 |
| Cancer type | Gene | methyl group b | methyl group a | DEG pval | avg methyl in b | avg methyl in a | avg exp in b | avg exp in a |
| PCPG | EIF4EBP2 | 1 | 2 | 0.00199481831761605 | 0.153301875 | 0.271833008130081 | 0.12880095908104 | 0.307580608471235 |
| READ | EIF4EBP2 | 1 | 2 | 0.00678993660906573 | 0.158347586206897 | 0.243455416666667 | -0.328432553850097 | -0.102939665918983 |
| Translation factor expression regulation through copy number variation of Translation factor |
 |
| Cancer type | Gene | Coefficient | Pvalue |
| LGG | EIF4EBP2 | 0.076253437 | 0.03067111 |
| CESC | EIF4EBP2 | -0.047058472 | 0.038230225 |
Top |
|
| Strongly correlated genes belong to cellular important gene groups with EIF4EBP2 (coefficient>0.8, pval<0.05, node color based on FC between tumor and matched normal). Significantly associated important genes in the individual cancer types. * Cell metabolism gene: cell metabolism genes from REACTOME (black edge), IUPHAR: drug target genes from IUPHAR (blue edge), Kinase: human kinase genes (brown edge), CGC: cancer gene census genes (orange edge), TSG: tumor suppresor genes (purple edge), Epifactor: epigenetic factors (light blue edge), TF: transcription factors (green) |
| Cancer type | Gene group | Translation factor | Correlated gene | Coefficient | Pvalue |
Top |
|
| Protein 3D structure Visit iCn3D. |
Top |
|
| Protein-protein interaction networks * Overlap between up-regulated DEGs (log2FC<-1 and adj.P<0.05) and STRING PPI network (center: Translation factor, node: DEGs, edges: weighted by -log2(adj.P)) |
 |
| Overlap between down-regulated DEGs (log2FC>1 and adj.P<0.05) and STRING PPI network (center: Translation factor, node: DEGs, edges: weighted by -log2(adj.P)) |
 |
 * Edge colors based on TCGA cancer types. |
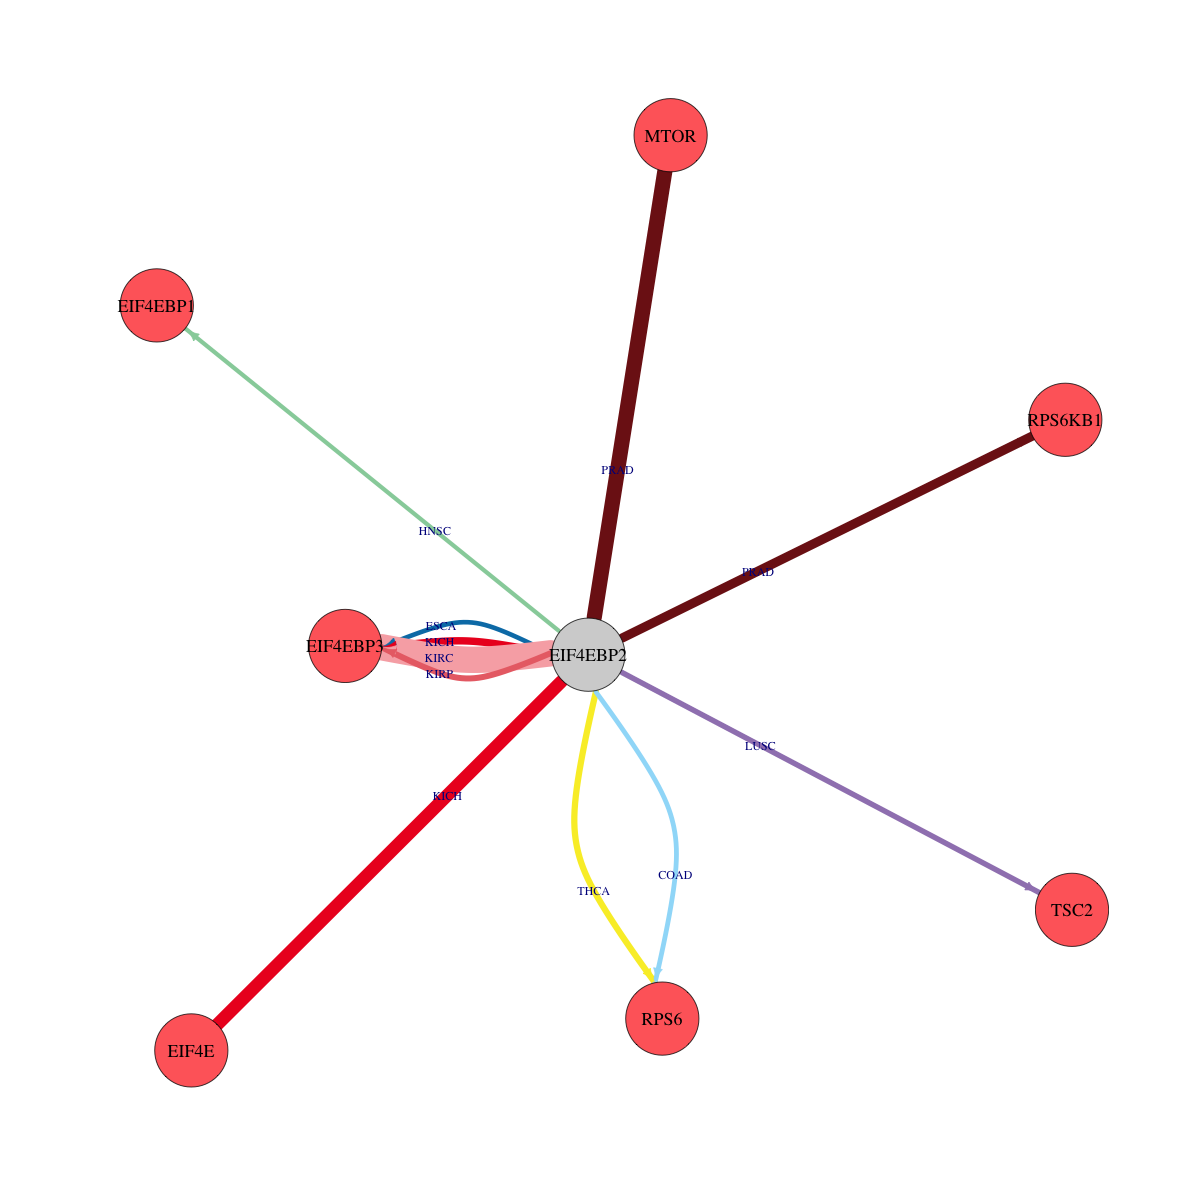
| * Overlap between DEGs (log2FC>1 and adj.P<0.05) and STRING PPI network per cancer (center: Translation factor, node: DEGs, node color: log2FC, edges: weighted by -log2(adj.P)) |
 |
| Cancer type | Translation factor | Interacting protein coding gene | FC | adj.pval |
| KIRC | EIF4EBP2 | RPS6 | -3.4556058277803 | 0.0001224322154943 |
| PRAD | EIF4EBP2 | RPS6KB1 | 1.25047501981198 | 0.000199084406212897 |
| KICH | EIF4EBP2 | RPS6KB2 | -4.22026554870888 | 0.000911891460418701 |
| KICH | EIF4EBP2 | EIF4EBP3 | 1.9759816418175 | 0.00102710723876953 |
| THCA | EIF4EBP2 | RPS6KB2 | -1.02516199753119 | 0.00125200545023797 |
| COAD | EIF4EBP2 | RPS6KB1 | -1.1133069567678 | 0.00144392251968384 |
| PRAD | EIF4EBP2 | EIF4EBP1 | -1.52730406636296 | 0.00170492480464144 |
| ESCA | EIF4EBP2 | TSC2 | -3.24919207627469 | 0.001953125 |
| BRCA | EIF4EBP2 | EIF4EBP3 | -1.22871675560918 | 0.00216137798426823 |
| THCA | EIF4EBP2 | RPS6 | 1.46346143665389 | 0.00305071956645465 |
| KIRP | EIF4EBP2 | EIF4EBP3 | 1.30969388002957 | 0.0038655917160213 |
| CHOL | EIF4EBP2 | RPTOR | -2.34317187916664 | 0.00390625 |
| KICH | EIF4EBP2 | EIF4G1 | -1.46656081150743 | 0.00612920522689819 |
| LUSC | EIF4EBP2 | TSC2 | 1.12504498503233 | 0.00646935999315137 |
| KIRP | EIF4EBP2 | RPS6 | -1.15360907834159 | 0.0111397774890065 |
| COAD | EIF4EBP2 | RPS6 | 1.03379589520851 | 0.011966735124588 |
| BLCA | EIF4EBP2 | RPS6 | -1.76940777579938 | 0.012359619140625 |
| ESCA | EIF4EBP2 | EIF4EBP3 | 2.98324688612886 | 0.013671875 |
| STAD | EIF4EBP2 | TSC2 | -1.66130396745917 | 0.018431528005749 |
| HNSC | EIF4EBP2 | EIF4EBP1 | 1.16888194926653 | 0.0196738412400919 |
| HNSC | EIF4EBP2 | RPS6KB1 | -1.27996809705029 | 0.0301271170746986 |
| KIRP | EIF4EBP2 | RPS6KB1 | -1.46465474284348 | 2.00420618057251e-06 |
| KIRC | EIF4EBP2 | EIF4EBP3 | 3.34630238884032 | 2.66680331214666e-11 |
| KIRP | EIF4EBP2 | EIF4EBP1 | -2.1223854491688 | 2.98023223876953e-07 |
| LIHC | EIF4EBP2 | TSC2 | -2.06124259504281 | 3.59406613648813e-06 |
| KICH | EIF4EBP2 | TSC2 | -5.67340295495929 | 6.36577606201172e-05 |
| LUAD | EIF4EBP2 | EIF4EBP1 | -2.82691479456829 | 6.51132046672323e-08 |
| KICH | EIF4EBP2 | EIF4E | 1.61675210562671 | 6.55651092529297e-06 |
| LIHC | EIF4EBP2 | RPTOR | -4.36362270436135 | 6.64579404273587e-07 |
| BRCA | EIF4EBP2 | RPS6KB2 | -1.61361650027185 | 6.83985375255908e-15 |
| PRAD | EIF4EBP2 | MTOR | 2.45767376269894 | 8.16442831201447e-07 |
| BRCA | EIF4EBP2 | EIF4EBP1 | -1.867430312542 | 8.26346922422571e-07 |
| KIRC | EIF4EBP2 | EIF4EBP1 | -3.14860466879601 | 9.40007073737459e-12 |
| Protein-protein interactors with this translation factor (BIOGRID-3.4.160) |
| PPI interactors with EIF4EBP2 |
| EIF4E, ELAVL1, MTOR, BAG3, RPTOR, ARHGAP17, HNRNPA2B1, TXN, TBCA, EIF4E2, NFYA, RDH12, LSM3, FHL3, CDK4, EIF4ENIF1, EIF4EBP1, EIF4G1, EIF4G3, EIF4A2, EIF3B, EIF3D, EIF3C, EIF3L, EIF3I, EIF3K, EIF3H, EIF3G, EIF3A, EIF3M, EIF3E, ANGEL1, RPS27L, EIF3F, |
Top |
|
| Clinically associated variants from ClinVar. |
| Gene | Chr | Position | RefSeq | VarSeq | RefSeeq | VarType | Pathogenic | Disease | VarInfo |
| EIF4EBP2 | chr10 | 72164174 | G | A | single_nucleotide_variant | Likely_benign | not_provided | SO:0001583|missense_variant | SO:0001583|missense_variant |
| EIF4EBP2 | chr10 | 72164178 | C | T | single_nucleotide_variant | Benign | not_provided | SO:0001819|synonymous_variant | SO:0001819|synonymous_variant |
| nsSNVs with sample frequency (size of circle) from TCGA 33 cancers. |
 |
| SNVs and Indels |
| Gene | Cancer type | Chromosome | Start | End | RefSeeq | MutSeq | Mutation type | AAchange | # samples |
| EIF4EBP2 | ESCA | chr10 | 72179687 | 72179687 | G | T | Missense_Mutation | p.D55Y | 7 |
| EIF4EBP2 | COAD | chr10 | 72179709 | 72179709 | G | C | Missense_Mutation | p.R62P | 4 |
| EIF4EBP2 | LIHC | chr10 | 72164272 | 72164272 | G | - | Frame_Shift_Del | p.G40fs | 3 |
| EIF4EBP2 | ESCA | chr10 | 72179687 | 72179687 | G | T | Missense_Mutation | 2 | |
| EIF4EBP2 | UCEC | chr10 | 72179676 | 72179676 | G | A | Missense_Mutation | p.R51Q | 2 |
| EIF4EBP2 | PAAD | chr10 | 72179709 | 72179709 | G | C | Missense_Mutation | 2 | |
| EIF4EBP2 | BLCA | chr10 | 72179690 | 72179691 | AG | - | Frame_Shift_Del | p.R56fs | 2 |
| EIF4EBP2 | STAD | chr10 | 72179739 | 72179739 | C | T | Missense_Mutation | p.P72L | 2 |
| EIF4EBP2 | STAD | chr10 | 72179853 | 72179853 | T | C | Missense_Mutation | p.V110A | 2 |
| EIF4EBP2 | BLCA | chr10 | 72179746 | 72179746 | C | T | Silent | 1 | |
| EIF4EBP2 | THYM | chr10 | 72179807 | 72179807 | G | T | Missense_Mutation | 1 | |
| EIF4EBP2 | BLCA | chr10 | 72179690 | 72179691 | AG | - | Frame_Shift_Del | 1 | |
| EIF4EBP2 | THYM | chr10 | 72179807 | 72179807 | G | T | Missense_Mutation | p.V95L | 1 |
| EIF4EBP2 | BLCA | chr10 | 72179697 | 72179697 | T | G | Missense_Mutation | 1 | |
| EIF4EBP2 | LIHC | chr10 | 72164180 | 72164180 | G | T | Missense_Mutation | p.G8V | 1 |
| EIF4EBP2 | BLCA | chr10 | 72179676 | 72179676 | G | T | Missense_Mutation | 1 | |
| EIF4EBP2 | BLCA | chr10 | 72179789 | 72179789 | G | T | Nonsense_Mutation | p.E89* | 1 |
| EIF4EBP2 | LUAD | chr10 | 72181483 | 72181483 | C | G | Missense_Mutation | p.Q115E | 1 |
| EIF4EBP2 | BLCA | chr10 | 72164229 | 72164229 | C | T | Silent | p.I24I | 1 |
| EIF4EBP2 | BLCA | chr10 | 72179697 | 72179697 | T | G | Missense_Mutation | p.F58C | 1 |
| EIF4EBP2 | PRAD | chr10 | 72179743 | 72179743 | C | T | Silent | p.C73C | 1 |
| EIF4EBP2 | SKCM | chr10 | 72181474 | 72181474 | G | T | Missense_Mutation | p.D112Y | 1 |
| EIF4EBP2 | COAD | chr10 | 72164271 | 72164272 | - | G | Frame_Shift_Ins | p.P38fs | 1 |
| EIF4EBP2 | STAD | chr10 | 72164272 | 72164272 | G | - | Frame_Shift_Del | 1 | |
| EIF4EBP2 | COAD | chr10 | 72179746 | 72179746 | C | T | Silent | p.H74H | 1 |
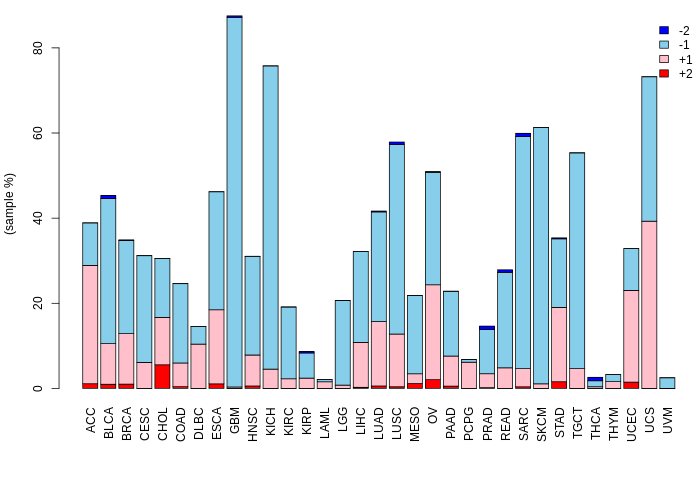
| Copy number variation (CNV) of EIF4EBP2 * Click on the image to open the original image in a new window. |
 |
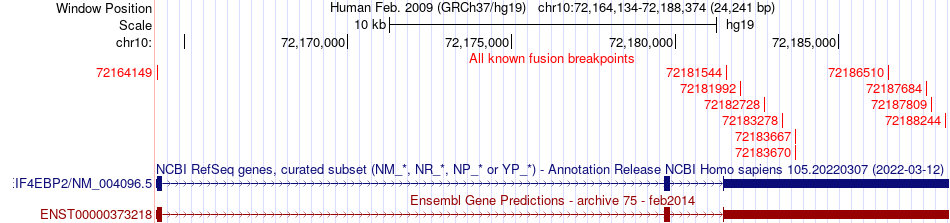
| Fusion gene breakpoints (product of the structural variants (SVs)) across EIF4EBP2 * Click on the image to open the UCSC genome browser with custom track showing this image in a new window. |
 |
| Fusion genes with this translation factor from FusionGDB2.0. |
| FusionGDB2 ID | Disease | Sample | Hgene | Hchr | Hbp | Hstrand | Tgene | Tchr | Tbp | Tstrand |
| 89452 | N/A | BM150873 | CD70 | chr19 | 6584147 | - | EIF4EBP2 | chr10 | 72183667 | - |
| 102023 | N/A | FN088420 | EIF4EBP2 | chr10 | 72188244 | - | EIF3H | chr8 | 117661079 | - |
| 89452 | N/A | AA278954 | EIF4EBP2 | chr10 | 72187809 | + | EIF4EBP2 | chr10 | 72187684 | - |
| 35116 | N/A | BE091541 | EIF4EBP2 | chr10 | 72182728 | - | GSTM1 | chr1 | 110236002 | - |
| 47085 | N/A | BF526065 | EIF4EBP2 | chr10 | 72188374 | + | HNRNPA1L2 | chr13 | 53214046 | - |
| 85632 | N/A | AW603986 | EIF4EBP2 | chr10 | 72181992 | + | NTM | chr11 | 131913622 | + |
| 89452 | N/A | CA414218 | LDHA | chr11 | 18429072 | - | EIF4EBP2 | chr10 | 72181544 | - |
| 89452 | N/A | BE837785 | PARD3B | chr2 | 205926524 | - | EIF4EBP2 | chr10 | 72186510 | + |
| 89452 | N/A | BP288018 | RBMS2 | chr12 | 56965502 | + | EIF4EBP2 | chr10 | 72164149 | + |
| 89452 | N/A | W03794 | SERPING1 | chr11 | 57382278 | + | EIF4EBP2 | chr10 | 72164079 | + |
| 89452 | N/A | AI738781 | SSBP3 | chr1 | 54692683 | + | EIF4EBP2 | chr10 | 72183278 | - |
| 89458 | N/A | AL561402 | TBCB | chr19 | 36606557 | + | EIF4EBP2 | chr10 | 72164111 | + |
Top |
|
| Kaplan-Meier plots with logrank tests of overall survival (OS) |
 |
| Cancer type | Translation factor | Coefficent | Hazard ratio | Wald test pval | Likelihool ratio pval | Logrank test pval | # samples |
Top |
|
| Differential gene expression between female and male. (Wilcoxon test, pval<0.05) |
 |
| Cancer type | Translation factor | pval | adj.p |
| STAD | EIF4EBP2 | 0.0290190568084263 | 0.78 |
| LUSC | EIF4EBP2 | 0.0313012756808054 | 0.81 |
| TGCT | EIF4EBP2 | 1.58384969216625e-05 | 0.00044 |
Top |
|
| Differential gene expression between young and old age groups (Wilcoxon test, pval<0.05) |
 |
| Cancer type | Translation factor | pval | adj.p |
| LGG | EIF4EBP2 | 7.49063455802573e-09 | 2.5e-07 |
| BRCA | EIF4EBP2 | 0.00645677200912683 | 0.21 |
Top |
|
| Drugs targeting genes involved in this translation factor. (DrugBank Version 5.1.8 2021-05-08) |
| UniProtAcc | DrugBank ID | Drug name | Drug activity | Drug type | Drug status |
Top |
|
| Diseases associated with this translation factor. (DisGeNet 4.0) |
| Disease ID | Disease Name | # PubMeds | Disease source |
| C0019193 | Hepatitis, Toxic | 1 | CTD_human |
| C1262760 | Hepatitis, Drug-Induced | 1 | CTD_human |
| C3658290 | Drug-Induced Acute Liver Injury | 1 | CTD_human |
| C4277682 | Chemical and Drug Induced Liver Injury | 1 | CTD_human |
| C4279912 | Chemically-Induced Liver Toxicity | 1 | CTD_human |
(UTHealth)
Web File Viewing | Emergency Information |Campus Carry|Site Policies