
|
||||||
|

Translation Factor: RPL22L1 (NCBI Gene ID:200916) |
|
 Gene Summary Gene Summary |
| Gene Information | Gene Name: RPL22L1 | Gene ID: 200916 | Gene Symbol | RPL22L1 | Gene ID | 200916 |
| Gene Name | ribosomal protein L22 like 1 | |
| Synonyms | - | |
| Cytomap | 3q26.2 | |
| Type of Gene | protein-coding | |
| Description | 60S ribosomal protein L22-like 1large ribosomal subunit protein eL22-like 1 | |
| Modification date | 20200315 | |
| UniProtAcc | Q6P5R6 | |
| Child GO biological process term(s) under GO:0006412 |
| GO ID | GO term |
| GO:0005840 | Ribosome |
| GO:0002181 | Cytoplasmic translation |
| GO:0006412 | Translation |
| Gene ontology of translaction factor with evidence of Inferred from Direct Assay (IDA) from Entrez |
| Partner | Gene | GO ID | GO term | PubMed ID |
| Inferred gene age of translation factor. |
| Gene | Inferred gene age group among (0 - 67.6], (67.6 - 355.7], (355.7 - 733], (733 - 1119.25], >1119.25 |
| RPL22L1 | (67.6 - 355.7] |
Top |
|
| We searched PubMed using 'RPL22L1[title] AND translation [title] AND human.' |
| Gene | Title | PMID |
| RPL22L1 | . | . |
Top |
|
| Skipped exons in TCGA and GTEx based on Ensembl gene isoform structure. * Click on the image to open the UCSC genome browser with custom track showing this image in a new window. For more annotations, please visit our ExonSkipDB. |
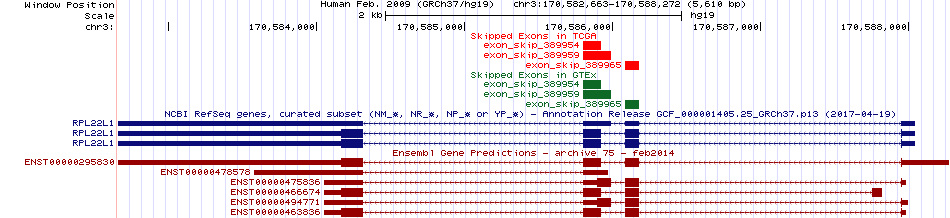 |
| Open reading frame (ORF) analsis of exon skipping events based on Ensembl gene isoform structure. * Click on the break point to see the gene structure around the break point region using the UCSC Genome Browser. |
| ENST | Exon skip start (DNA) | Exon Skip end (DNA) | ORF |
| ENST00000295830 | 170585801 | 170585923 | Frame-shift |
| Exon skipping position in the amino acid sequence. |
| ENST | Exon skip start (DNA) | Exon Skip end (DNA) | Len(transcript seq) | Exon skip start (mRNA) | Exon Skip end (mRNA) | Len(amino acid seq) | Exon skip start (AA) | Exon Skip end (AA) |
| Potentially (partially) lost protein functional features of UniProt. |
| UniProtAcc | Exon skip start (AA) | Exon Skip end (AA) | Function feature start (AA) | Function feature end (AA) | Functional feature type | Functional feature desc. |
Top |
|
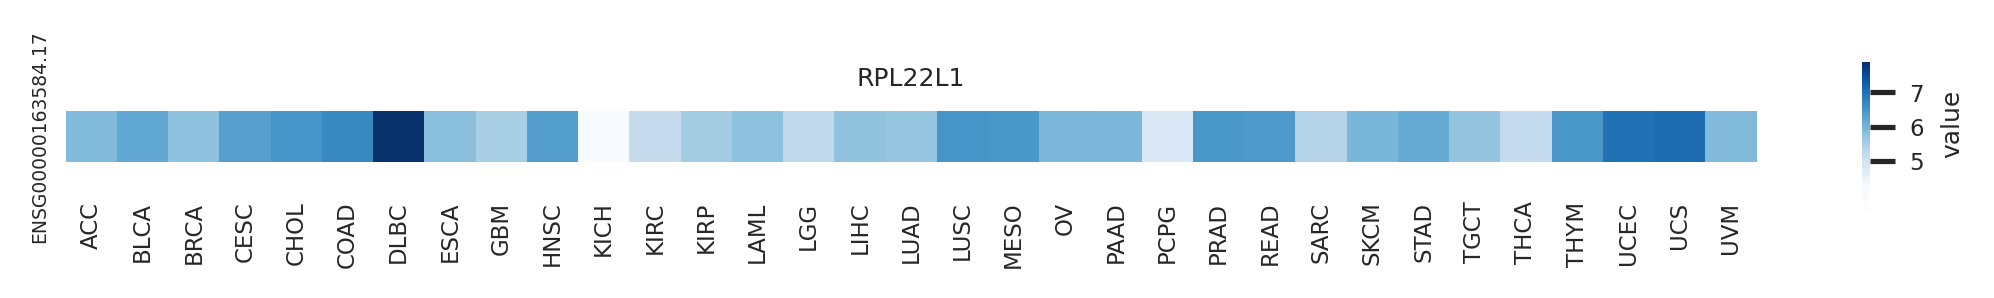
| Gene expression level across TCGA pancancer |
 |
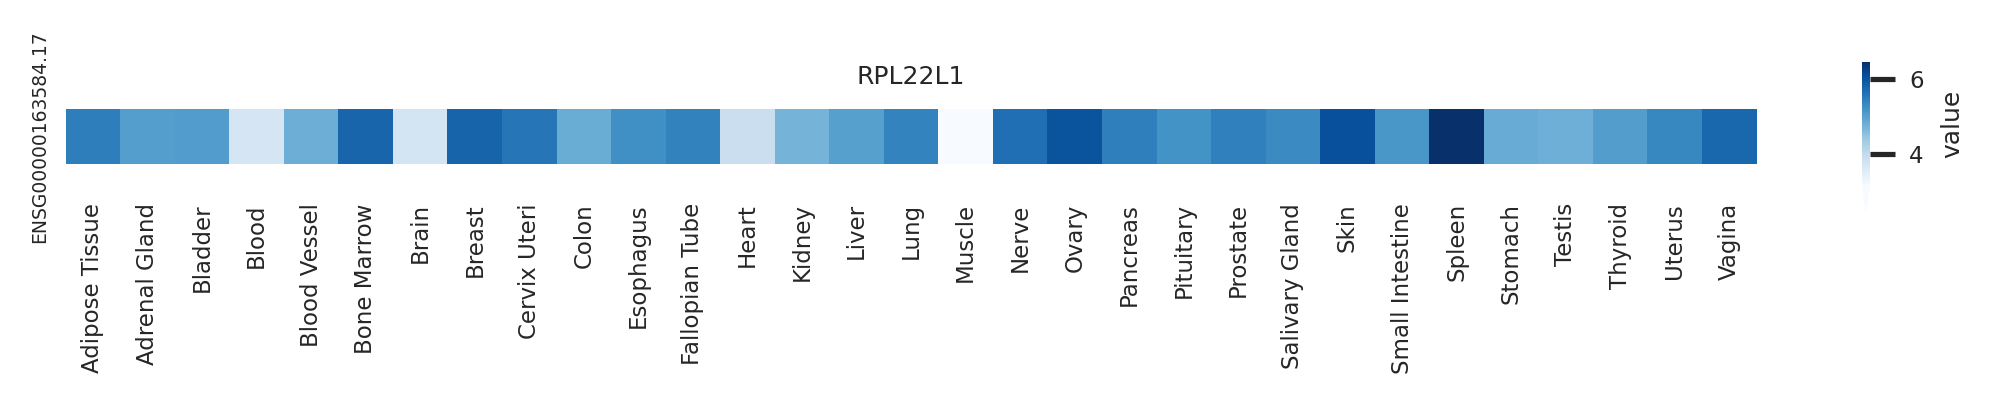
| Gene expression level across GTEx pantissue |
 |
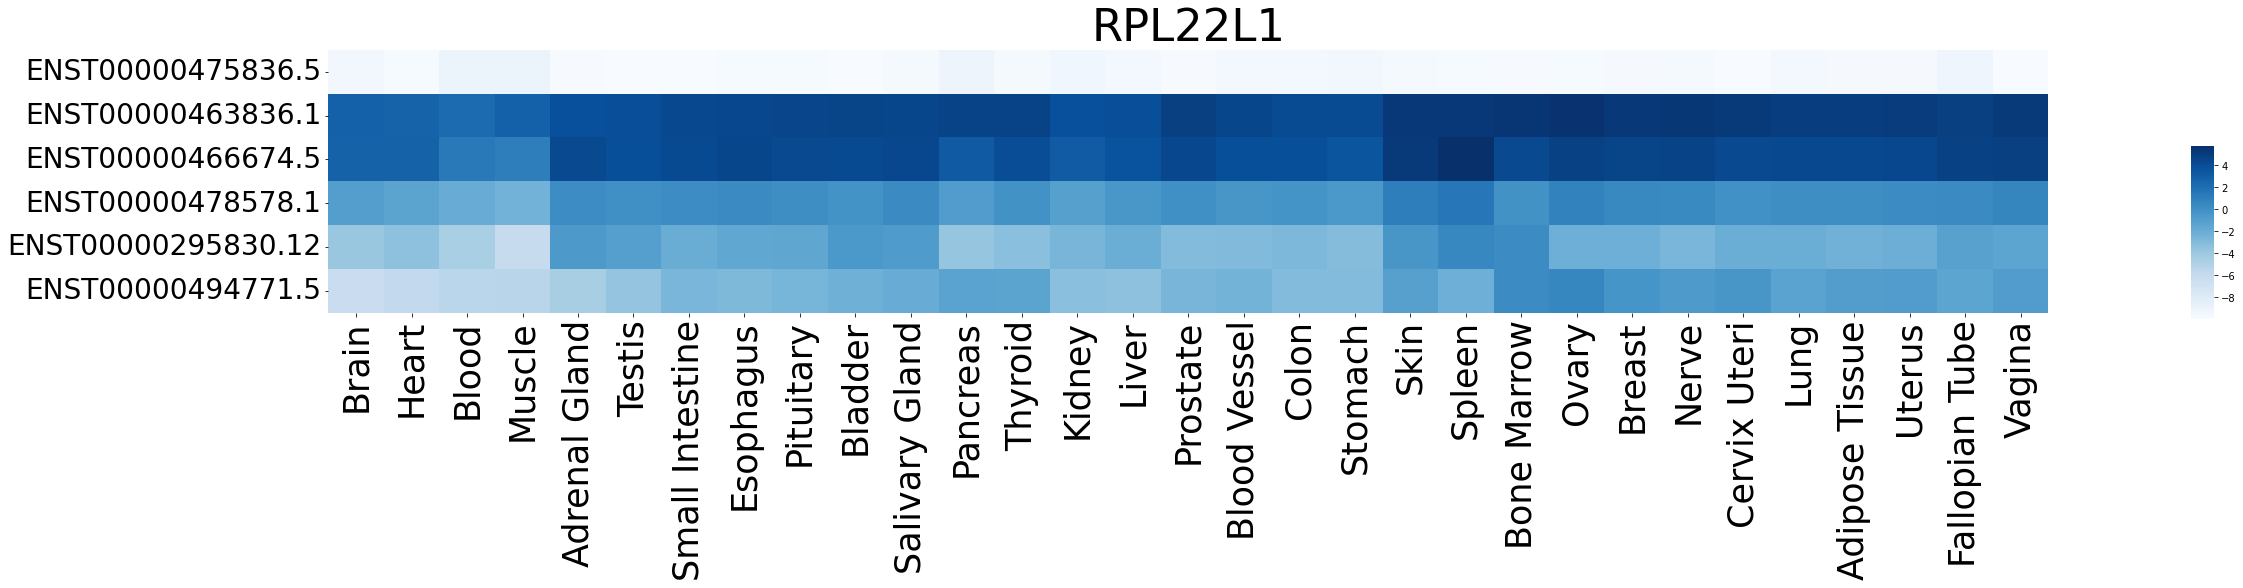
| Expression level of gene isoforms across TCGA pancancer |
 |
| Expression level of gene isoforms across GTEx pantissue |
 |
| Cancer(tissue) type-specific expression level of Translation factor using z-score distriution |
 |
| Differential expression between tumor and matched normal (in the cancer types with more than 10 matched samples) |
 |
| Cancer type | Translation factor | FC | adj.pval |
| KIRC | RPL22L1 | -1.72551636417352 | 2.66680331214666e-11 |
| LUAD | RPL22L1 | -1.82833887383775 | 4.46433706434638e-07 |
| KIRP | RPL22L1 | -2.37326250605867 | 5.12227416038514e-08 |
Top |
|
| Translation factor expression regulation through miRNA binding |
| Cancer type | Gene | miRNA | TargetScan binding score (Context++ score percentile) | Coefficient | Pvalue |
| Translation factor expression regulation through methylation in the promoter of Translation factor |
 |
| Cancer type | Gene | methyl group b | methyl group a | DEG pval | avg methyl in b | avg methyl in a | avg exp in b | avg exp in a |
| Translation factor expression regulation through methylation in the gene body of Translation factor (positive regulation) |
 |
| Cancer type | Gene | methyl group b | methyl group a | DEG pval | avg methyl in b | avg methyl in a | avg exp in b | avg exp in a |
| Translation factor expression regulation through copy number variation of Translation factor |
 |
| Cancer type | Gene | Coefficient | Pvalue |
| KICH | RPL22L1 | -0.022596592 | 0.00285164 |
| STAD | RPL22L1 | -0.022412291 | 0.015333358 |
Top |
|
| Strongly correlated genes belong to cellular important gene groups with RPL22L1 (coefficient>0.8, pval<0.05, node color based on FC between tumor and matched normal). Significantly associated important genes in the individual cancer types. * Cell metabolism gene: cell metabolism genes from REACTOME (black edge), IUPHAR: drug target genes from IUPHAR (blue edge), Kinase: human kinase genes (brown edge), CGC: cancer gene census genes (orange edge), TSG: tumor suppresor genes (purple edge), Epifactor: epigenetic factors (light blue edge), TF: transcription factors (green) |
 |
| Cancer type | Gene group | Translation factor | Correlated gene | Coefficient | Pvalue |
| CHOL | Cell metabolism gene | RPL22L1 | HAGHL | 0.802562431 | 3.36E-11 |
| CHOL | Cell metabolism gene | RPL22L1 | ATIC | 0.809763912 | 1.63E-11 |
| CHOL | Cell metabolism gene | RPL22L1 | NME1 | 0.809894442 | 1.61E-11 |
| CHOL | Cell metabolism gene | RPL22L1 | NME2 | 0.838992973 | 6.17E-13 |
| CHOL | CGC | RPL22L1 | ATIC | 0.809763912 | 1.63E-11 |
| CHOL | Epifactor | RPL22L1 | PRMT1 | 0.807549743 | 2.05E-11 |
| CHOL | IUPHAR | RPL22L1 | PRMT1 | 0.807549743 | 2.05E-11 |
| CHOL | TF | RPL22L1 | NME2 | 0.838992973 | 6.17E-13 |
| CHOL | TSG | RPL22L1 | NME1 | 0.809894442 | 1.61E-11 |
| THYM | Cell metabolism gene | RPL22L1 | PSME1 | 0.801935444 | 1.28E-28 |
| THYM | Cell metabolism gene | RPL22L1 | POLR2H | 0.843689948 | 3.27E-34 |
| UCS | Cell metabolism gene | RPL22L1 | PSME1 | 0.801935444 | 1.28E-28 |
| UCS | Cell metabolism gene | RPL22L1 | POLR2H | 0.843689948 | 3.27E-34 |
Top |
|
| Protein 3D structure Visit iCn3D. |
Top |
|
| Protein-protein interaction networks * Overlap between up-regulated DEGs (log2FC<-1 and adj.P<0.05) and STRING PPI network (center: Translation factor, node: DEGs, edges: weighted by -log2(adj.P)) |
 |
| Overlap between down-regulated DEGs (log2FC>1 and adj.P<0.05) and STRING PPI network (center: Translation factor, node: DEGs, edges: weighted by -log2(adj.P)) |
 |
 * Edge colors based on TCGA cancer types. |
| * Overlap between DEGs (log2FC>1 and adj.P<0.05) and STRING PPI network per cancer (center: Translation factor, node: DEGs, node color: log2FC, edges: weighted by -log2(adj.P)) |
 |
| Cancer type | Translation factor | Interacting protein coding gene | FC | adj.pval |
| THCA | RPL22L1 | RPS19 | -2.32758478069179 | 0.00017855596420982 |
| LUAD | RPL22L1 | RPL38 | -1.66722943744988 | 0.000257795914027732 |
| BLCA | RPL22L1 | RPL5 | -3.50581551367555 | 0.00026702880859375 |
| STAD | RPL22L1 | RPS23 | 1.85076760664576 | 0.000364991836249828 |
| STAD | RPL22L1 | RPL5 | 2.24361928856279 | 0.000433447770774365 |
| LUAD | RPL22L1 | RPS19 | -1.60312048165889 | 0.00049387504195037 |
| LUSC | RPL22L1 | RPL38 | -2.00110253296947 | 0.00049723236196648 |
| PRAD | RPL22L1 | RPL12 | 1.03140367520778 | 0.0008447947014615 |
| PRAD | RPL22L1 | RPL29 | 1.34120891282909 | 0.00141303901136259 |
| PRAD | RPL22L1 | RPL14 | 1.1487848232634 | 0.00321821289681976 |
| COAD | RPL22L1 | RPL29 | 2.01531946700608 | 0.00390031933784485 |
| ESCA | RPL22L1 | RPS19 | -1.36319696331652 | 0.0068359375 |
| BLCA | RPL22L1 | RPL12 | -3.6124920986454 | 0.012359619140625 |
| HNSC | RPL22L1 | RPL12 | 1.31949815918867 | 0.0149245594448075 |
| THCA | RPL22L1 | FAU | 1.18509450470262 | 0.0152379297688856 |
| LUSC | RPL22L1 | RPS23 | 1.46751169891047 | 0.0174932185880974 |
| KICH | RPL22L1 | RPL5 | 1.79380241489629 | 0.0219083428382874 |
| STAD | RPL22L1 | RPL29 | -1.21862598776416 | 0.0227867118082941 |
| KIRP | RPL22L1 | FAU | -1.04355048353271 | 0.0309218638576567 |
| PRAD | RPL22L1 | RPL38 | -1.37307294389303 | 0.0319785302138518 |
| COAD | RPL22L1 | RPS13 | 1.30175825100469 | 0.0357243716716767 |
| BLCA | RPL22L1 | RPS19 | 1.84549544688262 | 0.0360679626464844 |
| UCEC | RPL22L1 | RPS23 | -2.03658159814007 | 0.046875 |
| KIRP | RPL22L1 | RPL12 | -2.07599071662134 | 1.26352533698082e-05 |
| KIRC | RPL22L1 | FAU | -2.50135425883801 | 1.33253564327251e-08 |
| KIRP | RPL22L1 | RPS19 | -2.58536264561008 | 2.00234353542328e-08 |
| KIRP | RPL22L1 | RPL29 | -3.32206918296731 | 2.00420618057251e-06 |
| KIRC | RPL22L1 | RPL38 | -2.47198269993031 | 2.66680331214666e-11 |
| BRCA | RPL22L1 | RPL12 | -2.15215406494599 | 4.57396841975666e-06 |
| KIRP | RPL22L1 | RPL38 | -2.05925877790715 | 4.97791916131974e-07 |
| THCA | RPL22L1 | RPL12 | 1.7343782363164 | 5.23308492993332e-06 |
| COAD | RPL22L1 | RPL14 | 2.38206887570306 | 6.03199005126954e-05 |
| BRCA | RPL22L1 | RPL14 | -2.51759496082785 | 6.20044644295049e-06 |
| KIRC | RPL22L1 | RPS19 | -2.33153322465833 | 8.36006881044836e-12 |
| KIRC | RPL22L1 | RPL12 | -2.90541430500864 | 8.74519390827313e-10 |
| Protein-protein interactors with this translation factor (BIOGRID-3.4.160) |
| PPI interactors with RPL22L1 |
| USP39, G3BP2, RAD21, COPS6, CAND1, C17orf70, L3HYPDH, VMAC, MDM2, CCDC85B, RPS6KB2, UNK, PTEN, LDHD, MCM2, PTP4A2, PTPN6, HEY1, BRD1, EFTUD2, TNIP2, MB21D1, MYC, MAD2L2, RC3H1, NR2C2, KRAS, ITFG1, CLUAP1, WWP2, SDCBP2, DUSP6, FGFR1, GRB2, LCK, MAP2K5, PTPRR, KIF14, KIF23, ARHGAP36, ARHGEF16, DOCK4, Ect2, PLEKHG1, PLEKHG4, STARD8, TRIO, VAV1, NPC1, POU2F1, DDRGK1, UFL1, FZR1, Ewsr1, |
Top |
|
| Clinically associated variants from ClinVar. |
| Gene | Chr | Position | RefSeq | VarSeq | RefSeeq | VarType | Pathogenic | Disease | VarInfo |
| nsSNVs with sample frequency (size of circle) from TCGA 33 cancers. |
 |
| SNVs and Indels |
| Gene | Cancer type | Chromosome | Start | End | RefSeeq | MutSeq | Mutation type | AAchange | # samples |
| RPL22L1 | BLCA | chr3 | 170584195 | 170584195 | C | T | Missense_Mutation | p.E115K | 3 |
| RPL22L1 | PAAD | chr3 | 170585924 | 170585924 | C | A | Splice_Site | 3 | |
| RPL22L1 | STAD | chr3 | 170586135 | 170586135 | C | T | Silent | p.L18L | 2 |
| RPL22L1 | ESCA | chr3 | 170587752 | 170587752 | A | T | Splice_Site | 2 | |
| RPL22L1 | THCA | chr3 | 170586127 | 170586127 | G | T | Missense_Mutation | p.T21N | 2 |
| RPL22L1 | KIRC | chr3 | 170584196 | 170584196 | A | G | Silent | p.D114D | 2 |
| RPL22L1 | UCEC | chr3 | 170584219 | 170584219 | G | T | Missense_Mutation | p.R107S | 2 |
| RPL22L1 | UCEC | chr3 | 170584225 | 170584225 | C | T | Missense_Mutation | p.E105K | 2 |
| RPL22L1 | LUAD | chr3 | 170587948 | 170587948 | C | T | Splice_Site | p.P3_splice | 2 |
| RPL22L1 | UCEC | chr3 | 170584255 | 170584255 | G | A | Nonsense_Mutation | p.R95* | 2 |
| RPL22L1 | UCEC | chr3 | 170585875 | 170585875 | G | T | Missense_Mutation | p.L51I | 2 |
| RPL22L1 | UCEC | chr3 | 170585926 | 170585926 | A | G | Missense_Mutation | p.I56T | 2 |
| RPL22L1 | BLCA | chr3 | 170587949 | 170587949 | G | A | Splice_Site | p.P3L | 1 |
| RPL22L1 | STAD | chr3 | 170584266 | 170584266 | C | T | Missense_Mutation | p.R91H | 1 |
| RPL22L1 | GBM | chr3 | 170584263 | 170584263 | T | C | Missense_Mutation | p.D92G | 1 |
| RPL22L1 | THCA | chr3 | 170587962 | 170587962 | G | C | Missense_Mutation | 1 | |
| RPL22L1 | GBM | chr3 | 170584263 | 170584263 | T | C | Missense_Mutation | 1 | |
| RPL22L1 | THCA | chr3 | 170586127 | 170586127 | G | T | Missense_Mutation | 1 | |
| RPL22L1 | HNSC | chr3 | 170587980 | 170587980 | G | C | Missense_Mutation | 1 | |
| RPL22L1 | HNSC | chr3 | 170587973 | 170587973 | G | A | Missense_Mutation | 1 | |
| RPL22L1 | THYM | chr3 | 170584296 | 170584296 | G | T | Missense_Mutation | p.T81N | 1 |
| RPL22L1 | LUAD | chr3 | 170587954 | 170587954 | C | A | Translation_Start_Site | p.M1I | 1 |
| RPL22L1 | BLCA | chr3 | 170587949 | 170587949 | G | A | Missense_Mutation | 1 | |
| RPL22L1 | OV | chr3 | 172070644 | 172070644 | G | A | Missense_Mutation | p.P3S | 1 |
| Copy number variation (CNV) of RPL22L1 * Click on the image to open the original image in a new window. |
 |
| Fusion gene breakpoints (product of the structural variants (SVs)) across RPL22L1 * Click on the image to open the UCSC genome browser with custom track showing this image in a new window. |
 |
| Fusion genes with this translation factor from FusionGDB2.0. |
| FusionGDB2 ID | Disease | Sample | Hgene | Hchr | Hbp | Hstrand | Tgene | Tchr | Tbp | Tstrand |
| 80167 | N/A | EC573220 | DMD | chrX | 32796672 | + | RPL22L1 | chr3 | 170584245 | - |
| 80167 | N/A | BC049823 | HNRNPUL2-BSCL2 | chr11 | 62472985 | - | RPL22L1 | chr3 | 170587980 | - |
| 80167 | N/A | EC563777 | MAP4K5 | chr14 | 50956895 | - | RPL22L1 | chr3 | 170584056 | + |
| 102383 | N/A | CF123667 | RPL22L1 | chr3 | 170584098 | - | CACNA1A | chr19 | 13329878 | - |
| 80169 | CESC | TCGA-EK-A2R9-01A | SEC62 | chr3 | 169706147 | + | RPL22L1 | chr3 | 170586179 | - |
Top |
|
| Kaplan-Meier plots with logrank tests of overall survival (OS) |
 |
| Cancer type | Translation factor | Coefficent | Hazard ratio | Wald test pval | Likelihool ratio pval | Logrank test pval | # samples |
Top |
|
| Differential gene expression between female and male. (Wilcoxon test, pval<0.05) |
 |
| Cancer type | Translation factor | pval | adj.p |
| BLCA | RPL22L1 | 0.00439170850955343 | 0.12 |
| STAD | RPL22L1 | 0.00564846635541737 | 0.15 |
| GBM | RPL22L1 | 0.00600508649724609 | 0.16 |
| LUAD | RPL22L1 | 0.0128065068287892 | 0.32 |
| TGCT | RPL22L1 | 0.0481148550492708 | 1 |
Top |
|
| Differential gene expression between young and old age groups (Wilcoxon test, pval<0.05) |
 |
| Cancer type | Translation factor | pval | adj.p |
| LUSC | RPL22L1 | 0.01541745051395 | 0.48 |
| LGG | RPL22L1 | 4.07077272883951e-05 | 0.0013 |
| LAML | RPL22L1 | 0.0426800888045764 | 1 |
| PRAD | RPL22L1 | 0.0409358486166901 | 1 |
| PAAD | RPL22L1 | 0.00969955408567462 | 0.31 |
| HNSC | RPL22L1 | 0.020977015252383 | 0.63 |
Top |
|
| Drugs targeting genes involved in this translation factor. (DrugBank Version 5.1.8 2021-05-08) |
| UniProtAcc | DrugBank ID | Drug name | Drug activity | Drug type | Drug status |
Top |
|
| Diseases associated with this translation factor. (DisGeNet 4.0) |
| Disease ID | Disease Name | # PubMeds | Disease source |
(UTHealth)
Web File Viewing | Emergency Information |Campus Carry|Site Policies