
|
||||||
|

Translation Factor: LTO1 (NCBI Gene ID:220064) |
|
 Gene Summary Gene Summary |
| Gene Information | Gene Name: LTO1 | Gene ID: 220064 | Gene Symbol | LTO1 | Gene ID | 220064 |
| Gene Name | LTO1 maturation factor of ABCE1 | |
| Synonyms | CIAB1|ORAOV1|TAOS1 | |
| Cytomap | 11q13.3 | |
| Type of Gene | protein-coding | |
| Description | protein LTO1 homologLTO1, ABCE1 maturation factororal cancer overexpressed 1oral cancer overexpressed protein 1-Aoral cancer-overexpressed protein 1tumor-amplified and overexpressed sequence 1 | |
| Modification date | 20200313 | |
| UniProtAcc | Q8WV07 | |
| Child GO biological process term(s) under GO:0006412 |
| GO ID | GO term |
| GO:0006413 | Translational initiation |
| GO:0006412 | Translation |
| Gene ontology of translaction factor with evidence of Inferred from Direct Assay (IDA) from Entrez |
| Partner | Gene | GO ID | GO term | PubMed ID |
| Hgene | LTO1 | GO:0106035 | protein maturation by [4Fe-4S] cluster transfer | 26182403 |
| Inferred gene age of translation factor. |
| Gene | Inferred gene age group among (0 - 67.6], (67.6 - 355.7], (355.7 - 733], (733 - 1119.25], >1119.25 |
| LTO1 | (733 - 1119.25] |
Top |
|
| We searched PubMed using 'LTO1[title] AND translation [title] AND human.' |
| Gene | Title | PMID |
| LTO1 | . | . |
Top |
|
| Skipped exons in TCGA and GTEx based on Ensembl gene isoform structure. * Click on the image to open the UCSC genome browser with custom track showing this image in a new window. For more annotations, please visit our ExonSkipDB. |
 |
| Open reading frame (ORF) analsis of exon skipping events based on Ensembl gene isoform structure. * Click on the break point to see the gene structure around the break point region using the UCSC Genome Browser. |
| ENST | Exon skip start (DNA) | Exon Skip end (DNA) | ORF |
| ENST00000279147 | 69482662 | 69482780 | Frame-shift |
| ENST00000535657 | 69482662 | 69482780 | Frame-shift |
| ENST00000279147 | 69486516 | 69486587 | Frame-shift |
| ENST00000535657 | 69486516 | 69486587 | Frame-shift |
| ENST00000279147 | 69487983 | 69488089 | Frame-shift |
| ENST00000535657 | 69487983 | 69488089 | Frame-shift |
| Exon skipping position in the amino acid sequence. |
| ENST | Exon skip start (DNA) | Exon Skip end (DNA) | Len(transcript seq) | Exon skip start (mRNA) | Exon Skip end (mRNA) | Len(amino acid seq) | Exon skip start (AA) | Exon Skip end (AA) |
| Potentially (partially) lost protein functional features of UniProt. |
| UniProtAcc | Exon skip start (AA) | Exon Skip end (AA) | Function feature start (AA) | Function feature end (AA) | Functional feature type | Functional feature desc. |
Top |
|
| Gene expression level across TCGA pancancer |
 |
| Gene expression level across GTEx pantissue |
 |
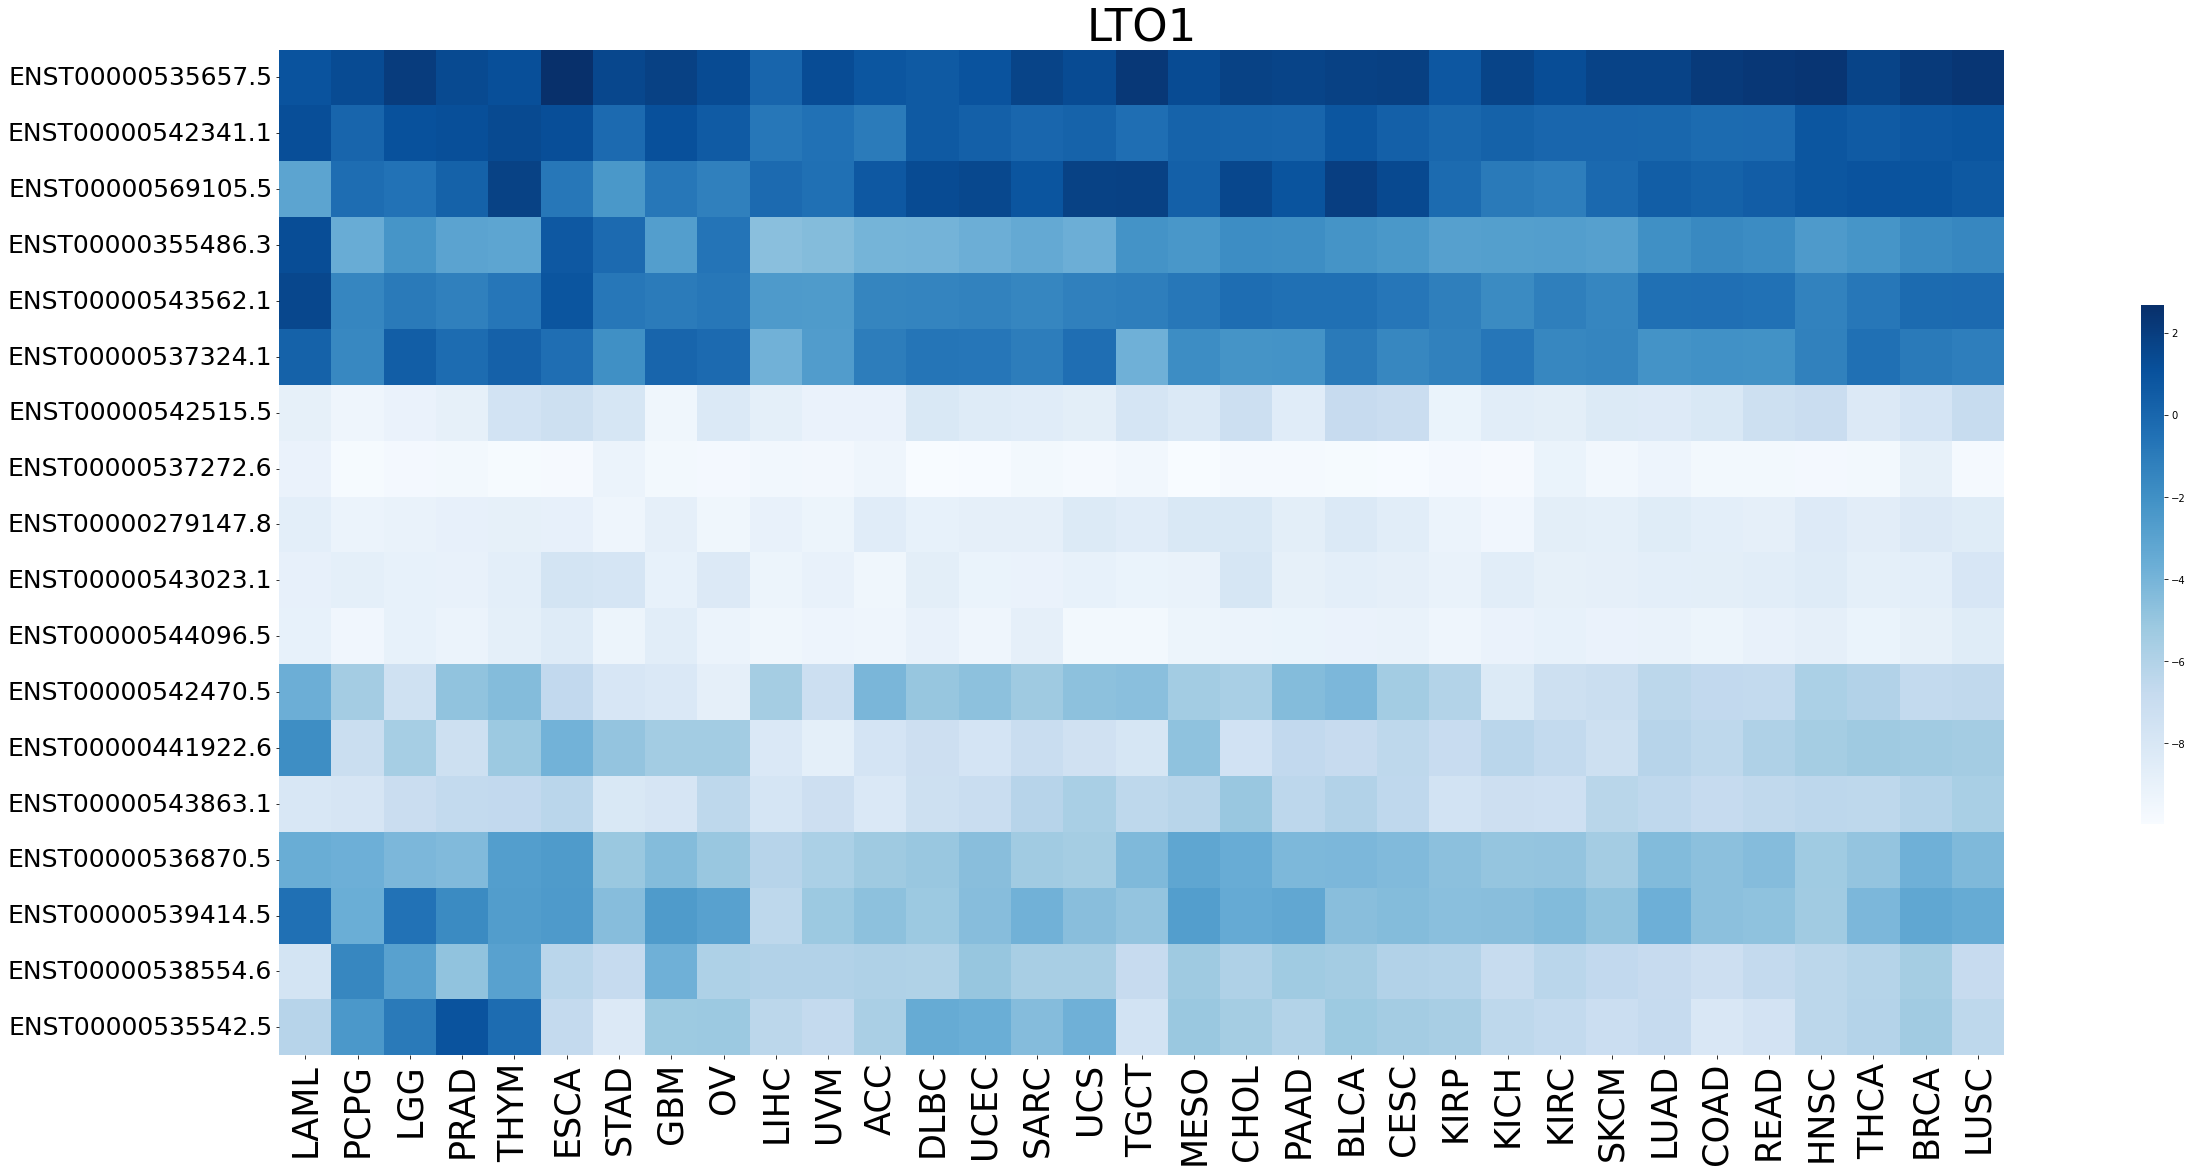
| Expression level of gene isoforms across TCGA pancancer |
 |
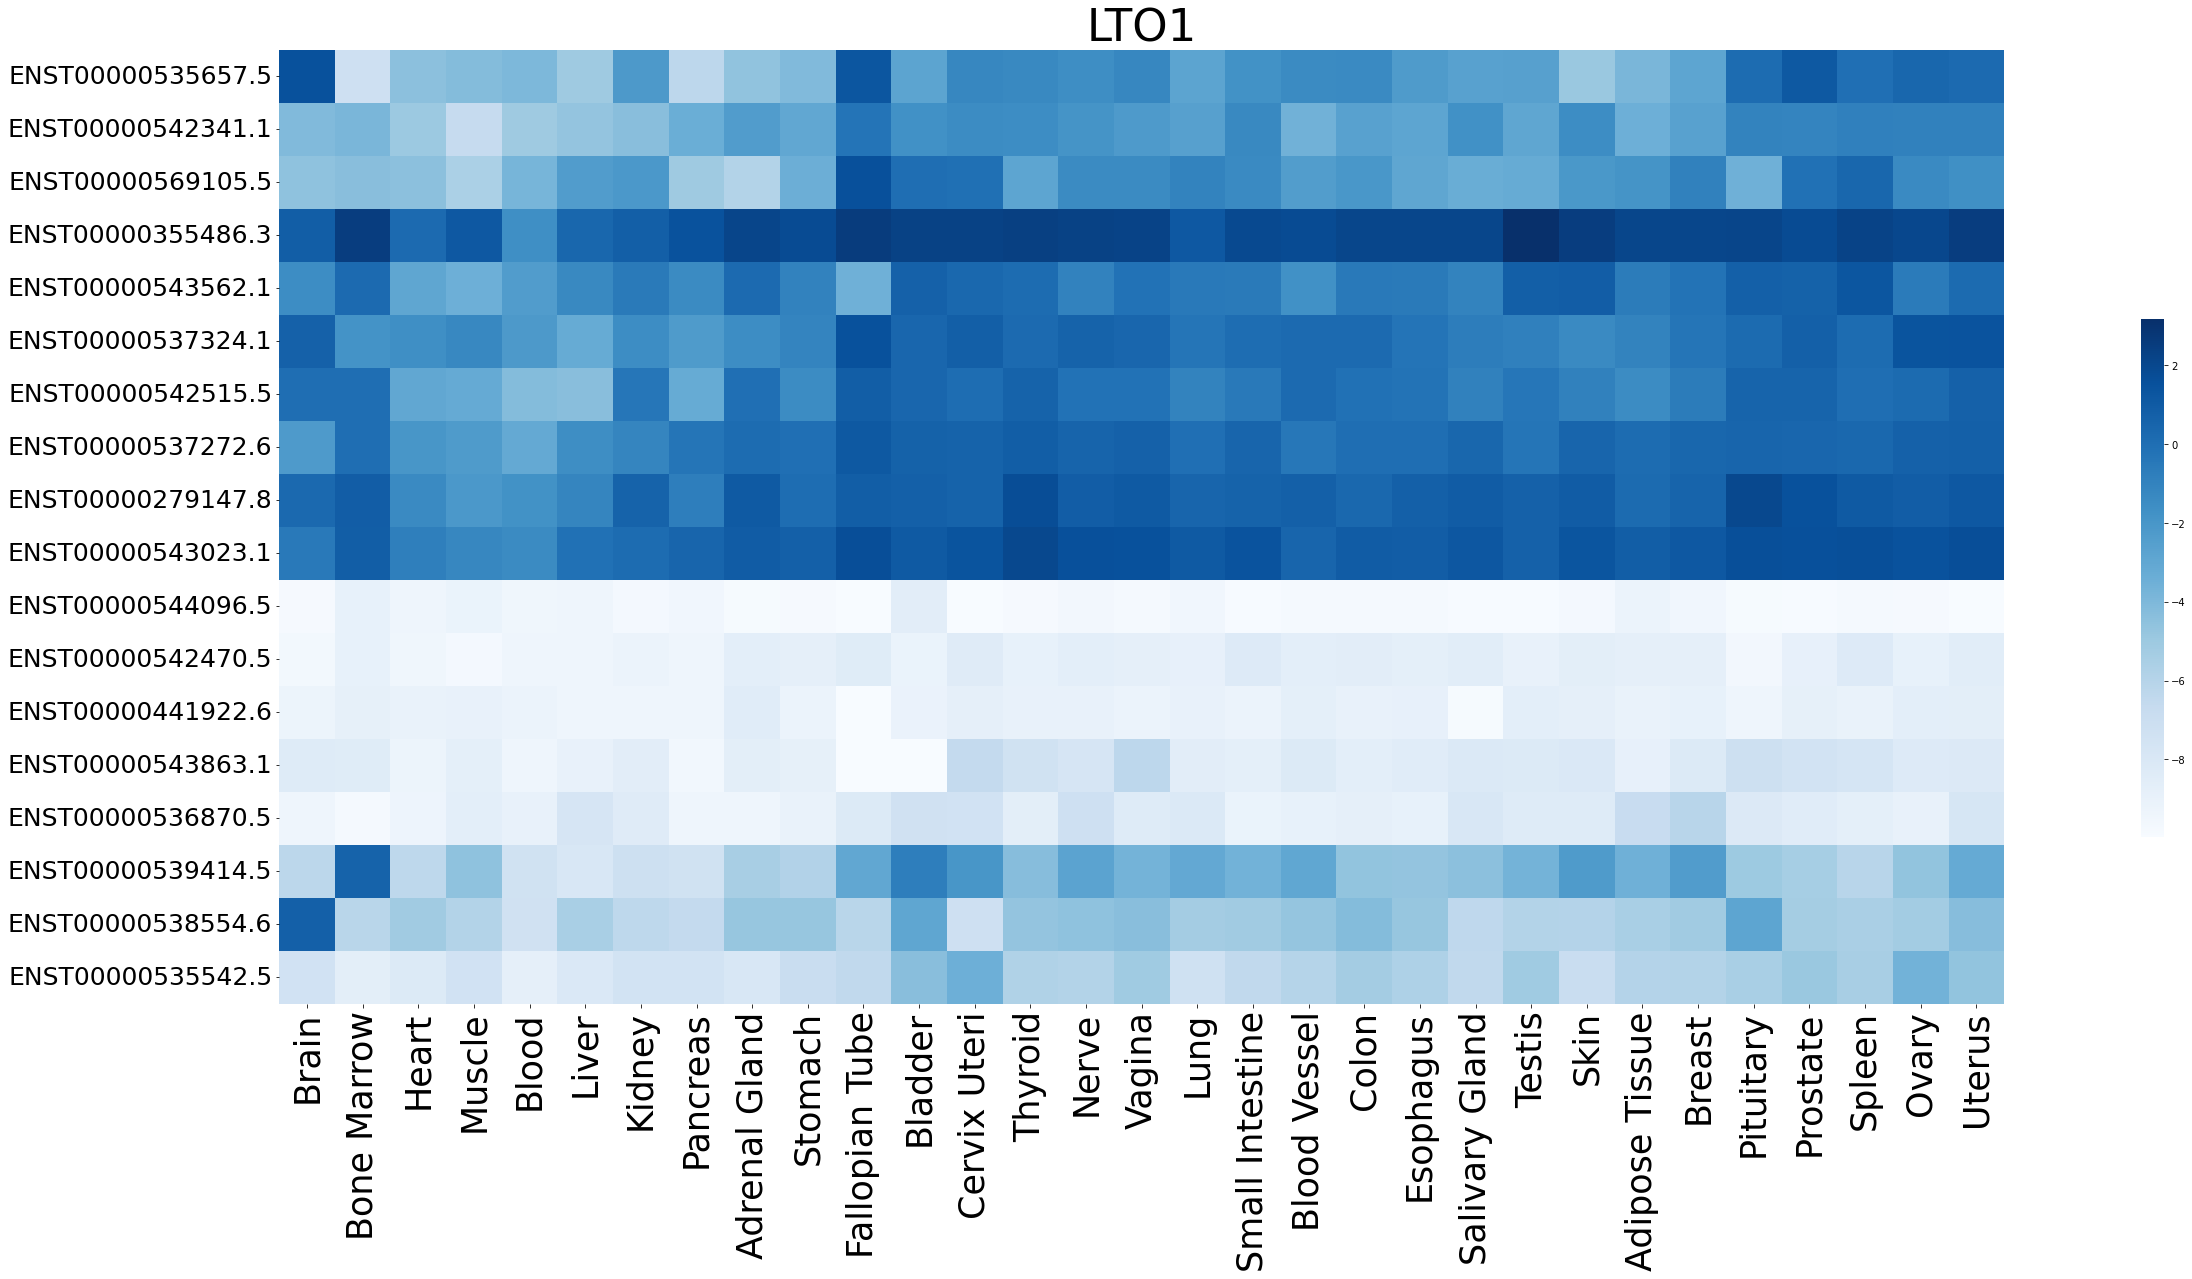
| Expression level of gene isoforms across GTEx pantissue |
 |
| Cancer(tissue) type-specific expression level of Translation factor using z-score distriution |
| Differential expression between tumor and matched normal (in the cancer types with more than 10 matched samples) |
| Cancer type | Translation factor | FC | adj.pval |
Top |
|
| Translation factor expression regulation through miRNA binding |
| Cancer type | Gene | miRNA | TargetScan binding score (Context++ score percentile) | Coefficient | Pvalue |
| Translation factor expression regulation through methylation in the promoter of Translation factor |
| Cancer type | Gene | methyl group b | methyl group a | DEG pval | avg methyl in b | avg methyl in a | avg exp in b | avg exp in a |
| Translation factor expression regulation through methylation in the gene body of Translation factor (positive regulation) |
| Cancer type | Gene | methyl group b | methyl group a | DEG pval | avg methyl in b | avg methyl in a | avg exp in b | avg exp in a |
| Translation factor expression regulation through copy number variation of Translation factor |
| Cancer type | Gene | Coefficient | Pvalue |
Top |
|
| Strongly correlated genes belong to cellular important gene groups with LTO1 (coefficient>0.8, pval<0.05, node color based on FC between tumor and matched normal). Significantly associated important genes in the individual cancer types. * Cell metabolism gene: cell metabolism genes from REACTOME (black edge), IUPHAR: drug target genes from IUPHAR (blue edge), Kinase: human kinase genes (brown edge), CGC: cancer gene census genes (orange edge), TSG: tumor suppresor genes (purple edge), Epifactor: epigenetic factors (light blue edge), TF: transcription factors (green) |
| Cancer type | Gene group | Translation factor | Correlated gene | Coefficient | Pvalue |
Top |
|
| Protein 3D structure Visit iCn3D. |
Top |
|
| Protein-protein interaction networks * Overlap between up-regulated DEGs (log2FC<-1 and adj.P<0.05) and STRING PPI network (center: Translation factor, node: DEGs, edges: weighted by -log2(adj.P)) |
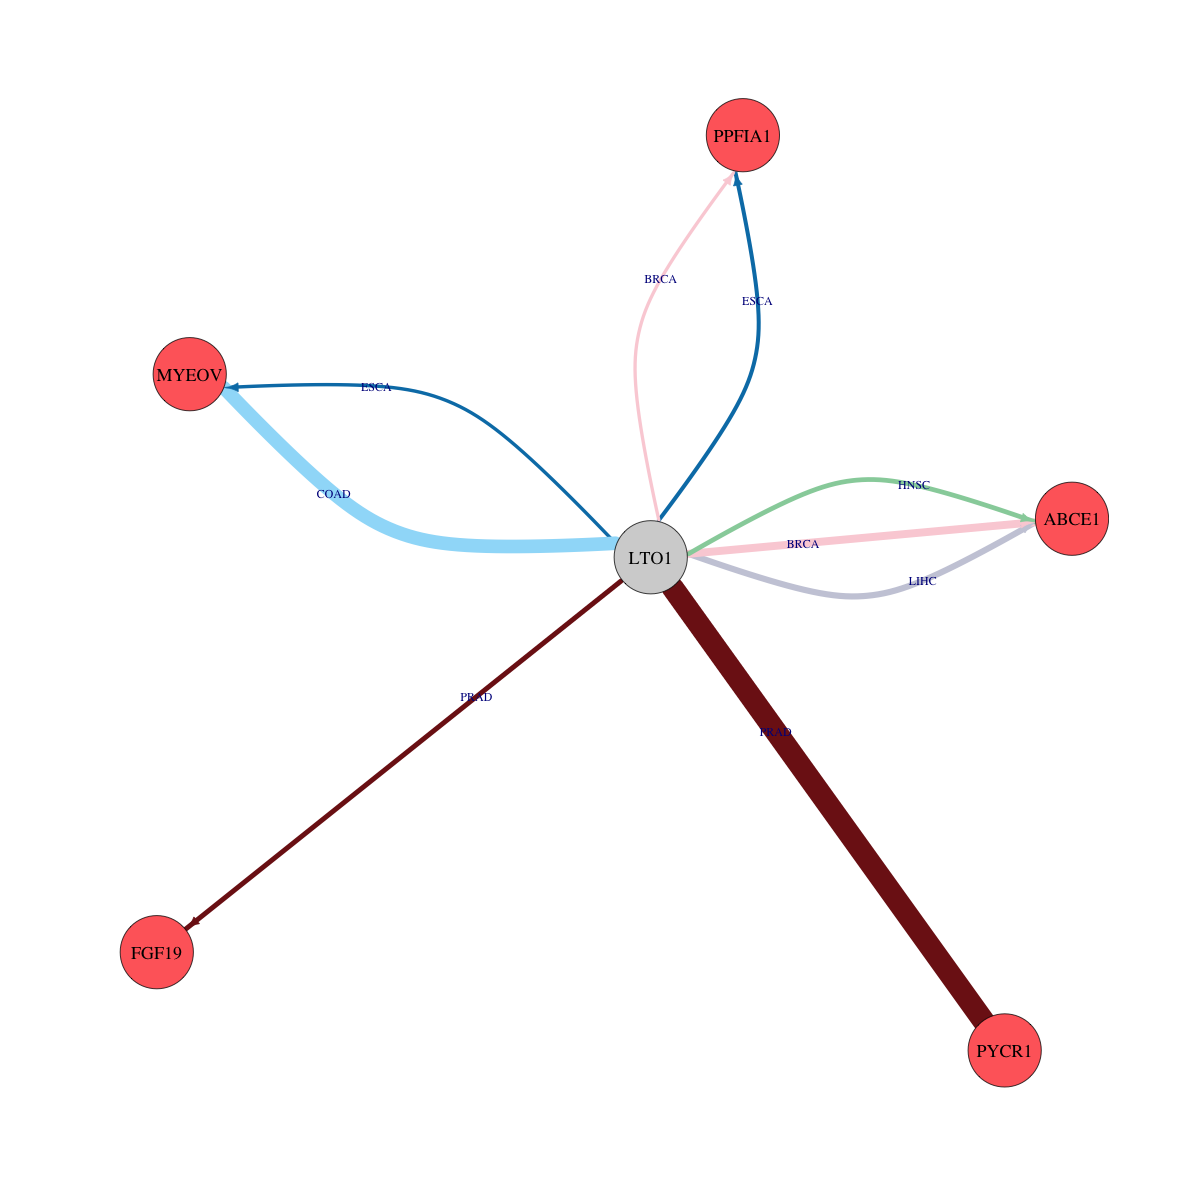 |
| Overlap between down-regulated DEGs (log2FC>1 and adj.P<0.05) and STRING PPI network (center: Translation factor, node: DEGs, edges: weighted by -log2(adj.P)) |
 |
 * Edge colors based on TCGA cancer types. |
| * Overlap between DEGs (log2FC>1 and adj.P<0.05) and STRING PPI network per cancer (center: Translation factor, node: DEGs, node color: log2FC, edges: weighted by -log2(adj.P)) |
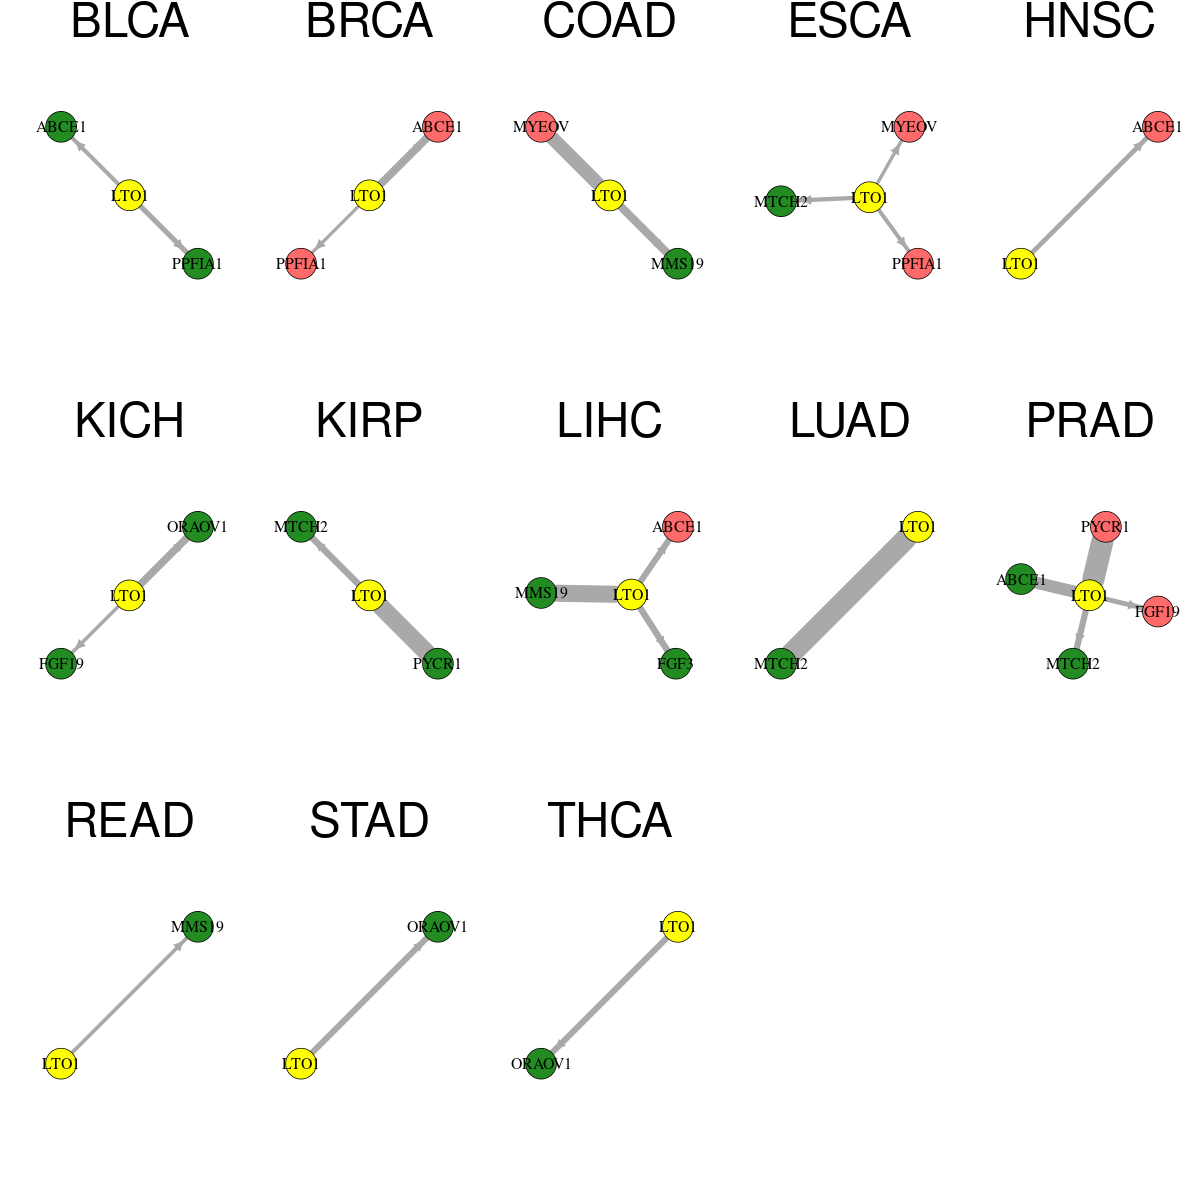 |
| Cancer type | Translation factor | Interacting protein coding gene | FC | adj.pval |
| COAD | LTO1 | MMS19 | -2.95049821557081 | 0.000524610280990601 |
| BRCA | LTO1 | ABCE1 | 1.3740626146648 | 0.000669229587514616 |
| KICH | LTO1 | ORAOV1 | -3.36811604860702 | 0.000911891460418701 |
| KIRP | LTO1 | MTCH2 | -1.30882693838506 | 0.00222697434946895 |
| LIHC | LTO1 | FGF3 | -1.48176676903504 | 0.00252617426850217 |
| PRAD | LTO1 | MTCH2 | -2.04188603953015 | 0.00312472017787764 |
| LIHC | LTO1 | ABCE1 | 1.33775121002715 | 0.0033398145023608 |
| THCA | LTO1 | ORAOV1 | -1.68856915085357 | 0.00361724055434455 |
| STAD | LTO1 | ORAOV1 | -1.5601458582361 | 0.0038655917160213 |
| BLCA | LTO1 | PPFIA1 | -2.44766264757648 | 0.00823211669921875 |
| PRAD | LTO1 | FGF19 | 1.35620612790562 | 0.0100527822465422 |
| HNSC | LTO1 | ABCE1 | 1.20332081233659 | 0.0124875666290336 |
| ESCA | LTO1 | MTCH2 | -1.1432352017003 | 0.0185546875 |
| BLCA | LTO1 | ABCE1 | -4.08863120087471 | 0.0229873657226562 |
| ESCA | LTO1 | PPFIA1 | 2.87732170481772 | 0.0244140625 |
| READ | LTO1 | MMS19 | -5.26046345831749 | 0.03125 |
| KICH | LTO1 | FGF19 | -1.73321134287718 | 0.0381666313335627 |
| ESCA | LTO1 | MYEOV | 1.29591063348914 | 0.0419921875 |
| BRCA | LTO1 | PPFIA1 | 1.59561910731225 | 0.0467071774266751 |
| PRAD | LTO1 | PYCR1 | 1.73371251676157 | 1.28101552451481e-09 |
| PRAD | LTO1 | ABCE1 | -2.9089513514626 | 1.31460603050763e-05 |
| LIHC | LTO1 | MMS19 | -1.11076183863501 | 1.35911736021717e-07 |
| COAD | LTO1 | MYEOV | 1.41085626294202 | 3.27825546264649e-06 |
| LUAD | LTO1 | MTCH2 | -2.53997448544601 | 3.31565482735716e-09 |
| KIRP | LTO1 | PYCR1 | -1.69507661866965 | 7.8696757555008e-08 |
| Protein-protein interactors with this translation factor (BIOGRID-3.4.160) |
| PPI interactors with LTO1 |
Top |
|
| Clinically associated variants from ClinVar. |
| Gene | Chr | Position | RefSeq | VarSeq | RefSeeq | VarType | Pathogenic | Disease | VarInfo |
| LTO1 | chr11 | 69486591 | T | G | single_nucleotide_variant | Benign | not_provided | SO:0001627|intron_variant | SO:0001627|intron_variant |
| nsSNVs with sample frequency (size of circle) from TCGA 33 cancers. |
| SNVs and Indels |
| Gene | Cancer type | Chromosome | Start | End | RefSeeq | MutSeq | Mutation type | AAchange | # samples |
| Copy number variation (CNV) of LTO1 * Click on the image to open the original image in a new window. |
 |
| Fusion gene breakpoints (product of the structural variants (SVs)) across LTO1 * Click on the image to open the UCSC genome browser with custom track showing this image in a new window. |
 |
| Fusion genes with this translation factor from FusionGDB2.0. |
| FusionGDB2 ID | Disease | Sample | Hgene | Hchr | Hbp | Hstrand | Tgene | Tchr | Tbp | Tstrand |
Top |
|
| Kaplan-Meier plots with logrank tests of overall survival (OS) |
| Cancer type | Translation factor | Coefficent | Hazard ratio | Wald test pval | Likelihool ratio pval | Logrank test pval | # samples |
Top |
|
| Differential gene expression between female and male. (Wilcoxon test, pval<0.05) |
| Cancer type | Translation factor | pval | adj.p |
Top |
|
| Differential gene expression between young and old age groups (Wilcoxon test, pval<0.05) |
| Cancer type | Translation factor | pval | adj.p |
Top |
|
| Drugs targeting genes involved in this translation factor. (DrugBank Version 5.1.8 2021-05-08) |
| UniProtAcc | DrugBank ID | Drug name | Drug activity | Drug type | Drug status |
Top |
|
| Diseases associated with this translation factor. (DisGeNet 4.0) |
| Disease ID | Disease Name | # PubMeds | Disease source |
(UTHealth)
Web File Viewing | Emergency Information |Campus Carry|Site Policies