
|
||||||
|

Translation Factor: RBM24 (NCBI Gene ID:221662) |
|
 Gene Summary Gene Summary |
| Gene Information | Gene Name: RBM24 | Gene ID: 221662 | Gene Symbol | RBM24 | Gene ID | 221662 |
| Gene Name | RNA binding motif protein 24 | |
| Synonyms | RNPC6|dJ259A10.1 | |
| Cytomap | 6p22.3 | |
| Type of Gene | protein-coding | |
| Description | RNA-binding protein 24RNA-binding region (RNP1, RRM) containing 6RNA-binding region-containing protein 6 | |
| Modification date | 20200313 | |
| UniProtAcc | Q9BX46 | |
| Child GO biological process term(s) under GO:0006412 |
| GO ID | GO term |
| GO:0017148 | Negative regulation of translation |
| GO:0006417 | Regulation of translation |
| GO:0002181 | Cytoplasmic translation |
| GO:0006412 | Translation |
| Gene ontology of translaction factor with evidence of Inferred from Direct Assay (IDA) from Entrez |
| Partner | Gene | GO ID | GO term | PubMed ID |
| Hgene | RBM24 | GO:0061158 | 3'-UTR-mediated mRNA destabilization | 24375645 |
| Inferred gene age of translation factor. |
| Gene | Inferred gene age group among (0 - 67.6], (67.6 - 355.7], (355.7 - 733], (733 - 1119.25], >1119.25 |
| RBM24 | (733 - 1119.25] |
Top |
|
| We searched PubMed using 'RBM24[title] AND translation [title] AND human.' |
| Gene | Title | PMID |
| RBM24 | RBM24 stabilizes hepatitis B virus pregenomic RNA but inhibits core protein translation by targeting the terminal redundancy sequence | 29760415 |
Top |
|
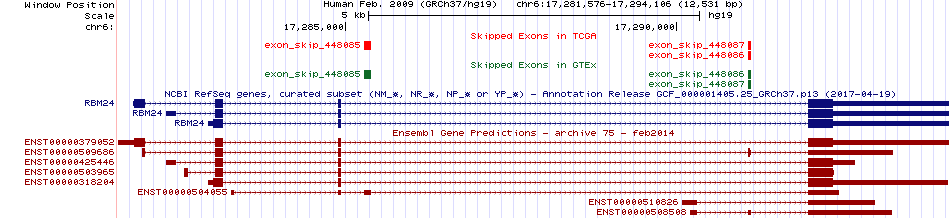
| Skipped exons in TCGA and GTEx based on Ensembl gene isoform structure. * Click on the image to open the UCSC genome browser with custom track showing this image in a new window. For more annotations, please visit our ExonSkipDB. |
 |
| Open reading frame (ORF) analsis of exon skipping events based on Ensembl gene isoform structure. * Click on the break point to see the gene structure around the break point region using the UCSC Genome Browser. |
| ENST | Exon skip start (DNA) | Exon Skip end (DNA) | ORF |
| Exon skipping position in the amino acid sequence. |
| ENST | Exon skip start (DNA) | Exon Skip end (DNA) | Len(transcript seq) | Exon skip start (mRNA) | Exon Skip end (mRNA) | Len(amino acid seq) | Exon skip start (AA) | Exon Skip end (AA) |
| Potentially (partially) lost protein functional features of UniProt. |
| UniProtAcc | Exon skip start (AA) | Exon Skip end (AA) | Function feature start (AA) | Function feature end (AA) | Functional feature type | Functional feature desc. |
Top |
|
| Gene expression level across TCGA pancancer |
 |
| Gene expression level across GTEx pantissue |
 |
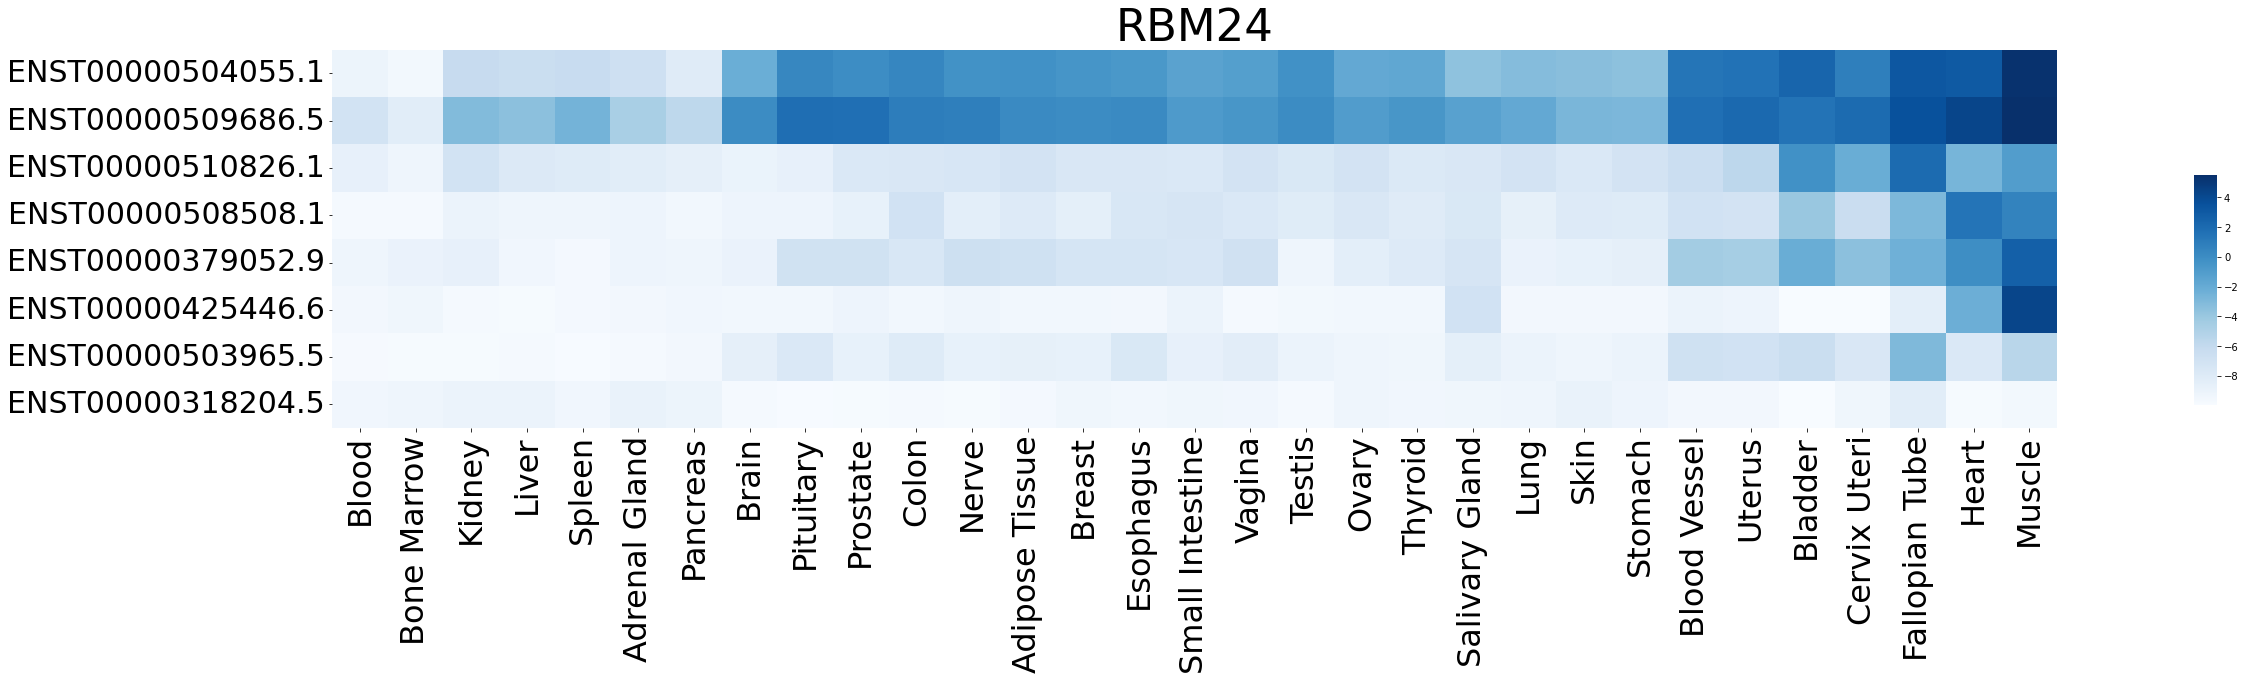
| Expression level of gene isoforms across TCGA pancancer |
 |
| Expression level of gene isoforms across GTEx pantissue |
 |
| Cancer(tissue) type-specific expression level of Translation factor using z-score distriution |
 |
| Differential expression between tumor and matched normal (in the cancer types with more than 10 matched samples) |
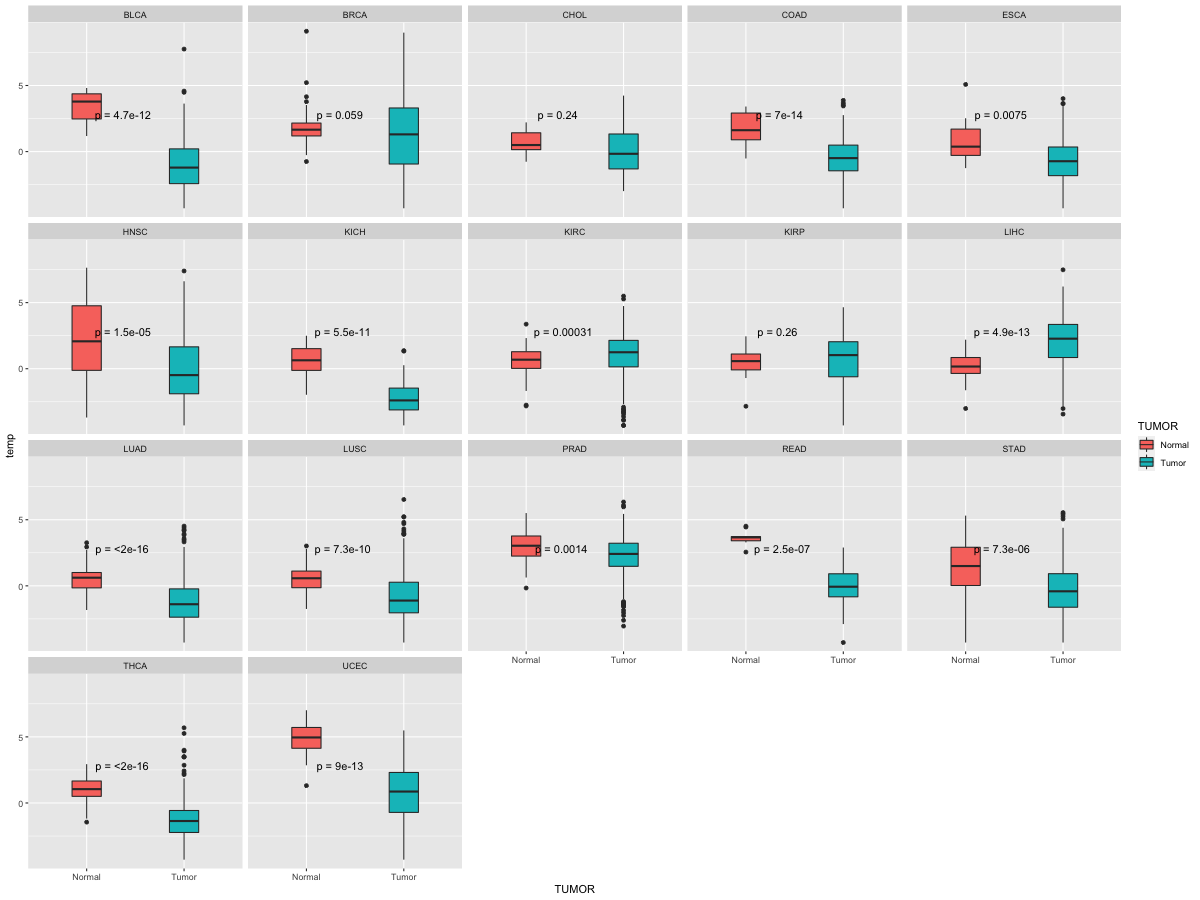 |
| Cancer type | Translation factor | FC | adj.pval |
| KIRC | RBM24 | 1.65442071880919 | 0.000224528839221527 |
| UCEC | RBM24 | -2.23655380194261 | 0.015625 |
| HNSC | RBM24 | -1.60068400196876 | 0.049041343804447 |
| LIHC | RBM24 | 3.57564165825458 | 7.57892378533037e-08 |
Top |
|
| Translation factor expression regulation through miRNA binding |
| Cancer type | Gene | miRNA | TargetScan binding score (Context++ score percentile) | Coefficient | Pvalue |
| DLBC | RBM24 | hsa-miR-125b-5p | 95 | -0.336702457144448 | 0.0206576919519927 |
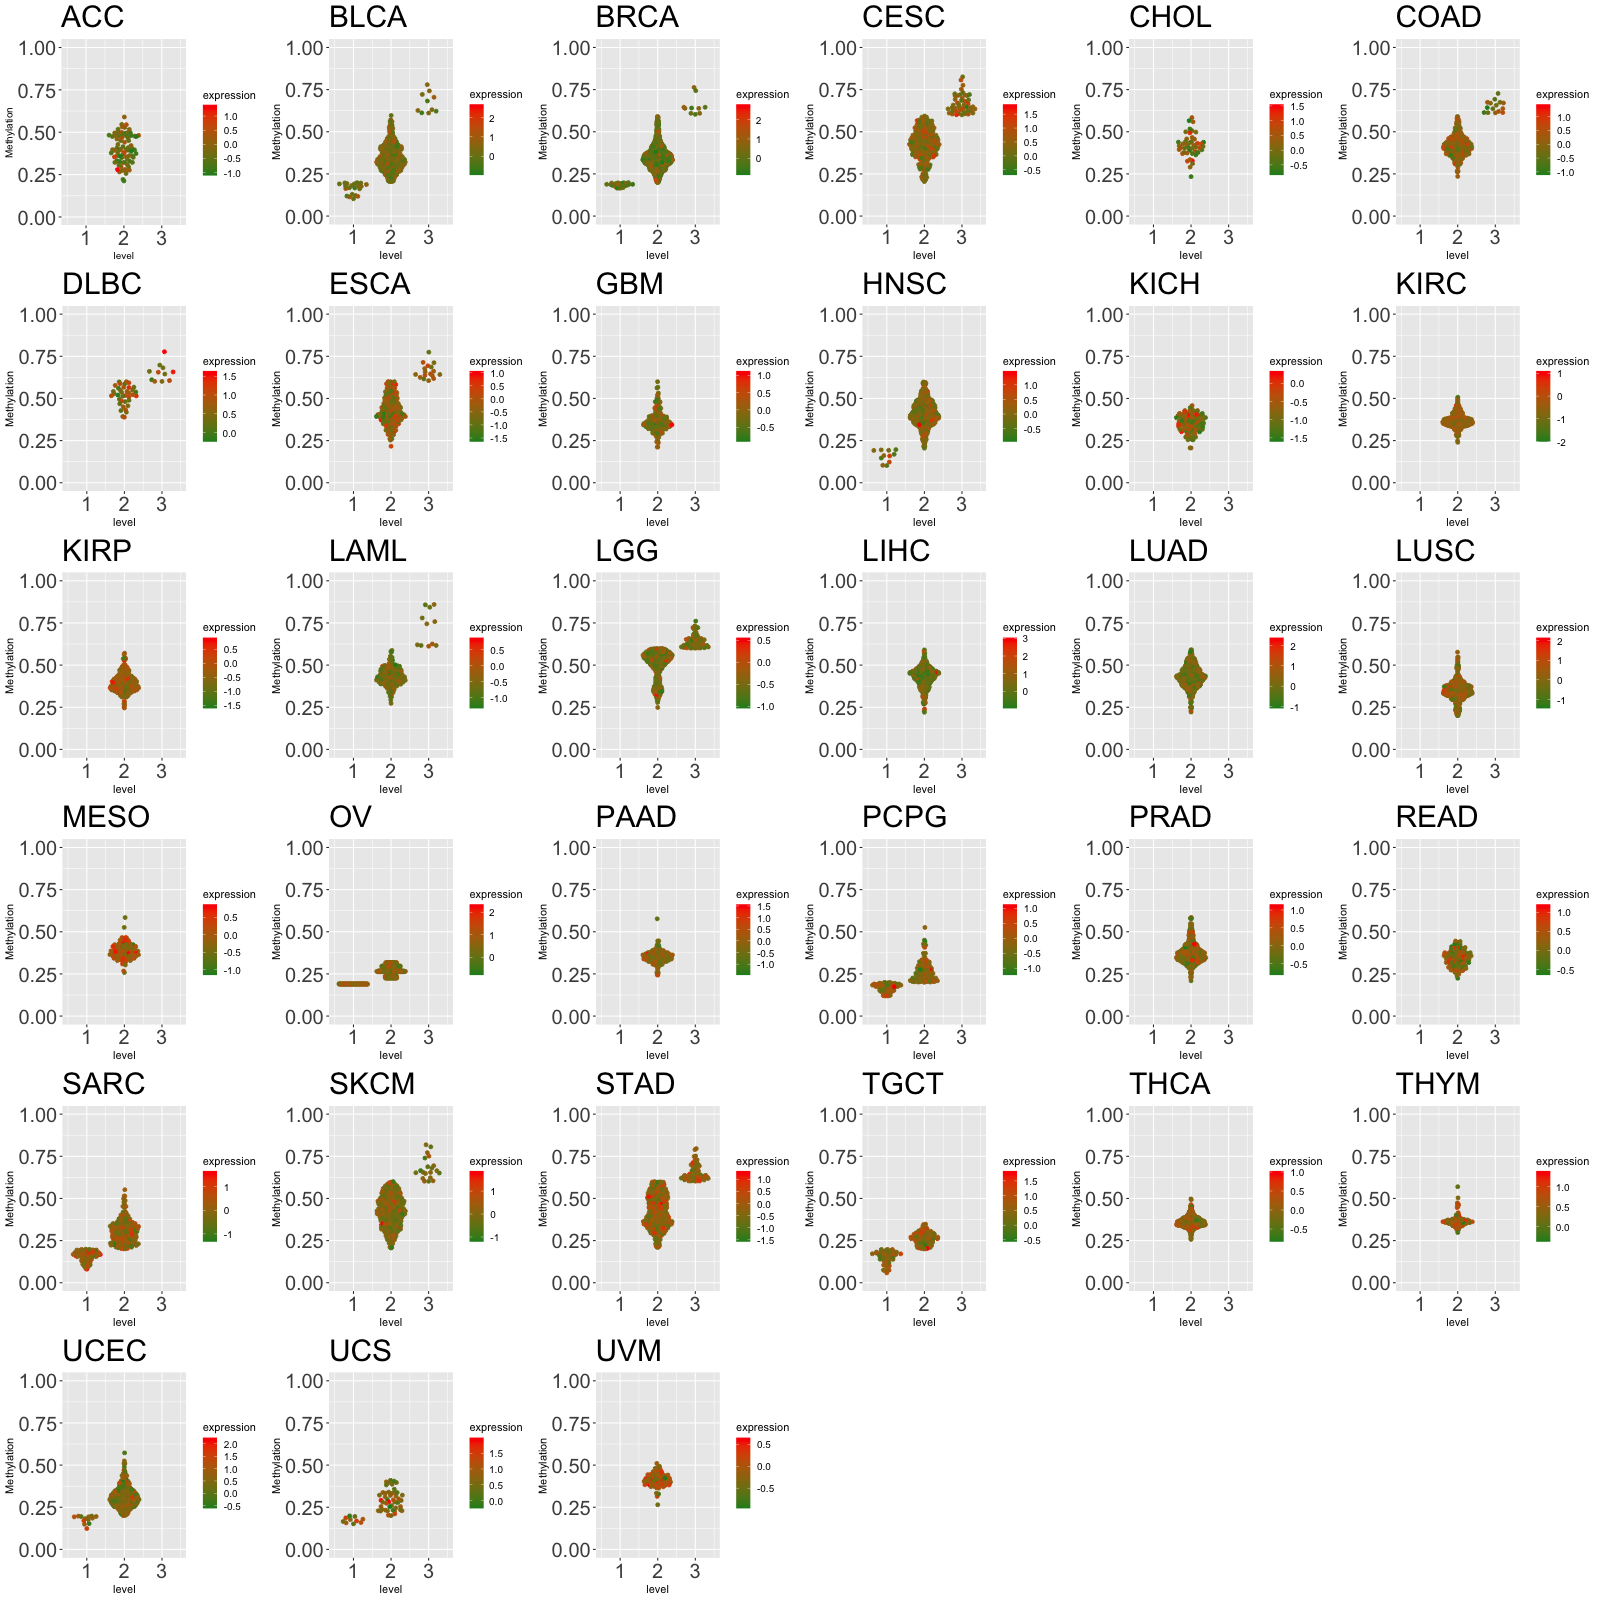
| Translation factor expression regulation through methylation in the promoter of Translation factor |
 |
| Cancer type | Gene | methyl group b | methyl group a | DEG pval | avg methyl in b | avg methyl in a | avg exp in b | avg exp in a |
| OV | RBM24 | 1 | 2 | 0.0169427339748412 | 0.190235185185185 | 0.270535380909365 | 0.653034687172535 | 0.500261798371471 |
| Translation factor expression regulation through methylation in the gene body of Translation factor (positive regulation) |
 |
| Cancer type | Gene | methyl group b | methyl group a | DEG pval | avg methyl in b | avg methyl in a | avg exp in b | avg exp in a |
| PRAD | RBM24 | 3 | 2 | 0.00127112092928488 | 0.669659741248097 | 0.552168705941591 | 0.336503713577114 | 0.124176330112098 |
| Translation factor expression regulation through copy number variation of Translation factor |
 |
| Cancer type | Gene | Coefficient | Pvalue |
| LIHC | RBM24 | -0.042719553 | 0.024266608 |
Top |
|
| Strongly correlated genes belong to cellular important gene groups with RBM24 (coefficient>0.8, pval<0.05, node color based on FC between tumor and matched normal). Significantly associated important genes in the individual cancer types. * Cell metabolism gene: cell metabolism genes from REACTOME (black edge), IUPHAR: drug target genes from IUPHAR (blue edge), Kinase: human kinase genes (brown edge), CGC: cancer gene census genes (orange edge), TSG: tumor suppresor genes (purple edge), Epifactor: epigenetic factors (light blue edge), TF: transcription factors (green) |
 |
| Cancer type | Gene group | Translation factor | Correlated gene | Coefficient | Pvalue |
| HNSC | Cell metabolism gene | RBM24 | CKMT2 | 0.81080779 | 2.65E-133 |
| HNSC | Cell metabolism gene | RBM24 | CKM | 0.821743067 | 7.30E-140 |
| HNSC | Cell metabolism gene | RBM24 | ANKRD1 | 0.833420194 | 2.20E-147 |
| HNSC | CGC | RBM24 | MYOD1 | 0.811498772 | 1.05E-133 |
| HNSC | Epifactor | RBM24 | PRKAG3 | 0.835698018 | 6.41E-149 |
| HNSC | Epifactor | RBM24 | APOBEC2 | 0.842536432 | 1.13E-153 |
| HNSC | Epifactor | RBM24 | SMYD1 | 0.865004489 | 4.68E-171 |
| HNSC | IUPHAR | RBM24 | CHRNA1 | 0.807985424 | 1.12E-131 |
| HNSC | IUPHAR | RBM24 | NPY6R | 0.809834452 | 9.70E-133 |
| HNSC | IUPHAR | RBM24 | CHRNG | 0.820336632 | 5.40E-139 |
| HNSC | IUPHAR | RBM24 | SCN4A | 0.830306737 | 2.53E-145 |
| HNSC | IUPHAR | RBM24 | ATP1A2 | 0.832417998 | 1.02E-146 |
| HNSC | IUPHAR | RBM24 | TTN | 0.833698788 | 1.43E-147 |
| HNSC | IUPHAR | RBM24 | PRKAG3 | 0.835698018 | 6.41E-149 |
| HNSC | IUPHAR | RBM24 | CHRND | 0.853769274 | 5.33E-162 |
| HNSC | IUPHAR | RBM24 | CACNA1S | 0.864417864 | 1.46E-170 |
| HNSC | Kinase | RBM24 | TTN | 0.833698788 | 1.43E-147 |
| HNSC | TF | RBM24 | MYOD1 | 0.811498772 | 1.05E-133 |
| HNSC | TF | RBM24 | MYOG | 0.835521725 | 8.45E-149 |
| HNSC | TF | RBM24 | MYF6 | 0.862525232 | 5.47E-169 |
| HNSC | TSG | RBM24 | FHL1 | 0.804550171 | 9.73E-130 |
| HNSC | TSG | RBM24 | DUSP26 | 0.806751699 | 5.61E-131 |
| HNSC | TSG | RBM24 | HSPB7 | 0.86005539 | 5.72E-167 |
| KICH | IUPHAR | RBM24 | ATP10A | 0.808566723 | 3.29E-22 |
| KICH | IUPHAR | RBM24 | MRGPRF | 0.820090635 | 2.72E-23 |
| TGCT | Cell metabolism gene | RBM24 | MTMR3 | 0.817240341 | 1.08E-38 |
| TGCT | Cell metabolism gene | RBM24 | B3GAT2 | 0.827395969 | 2.01E-40 |
| TGCT | CGC | RBM24 | PRDM1 | 0.80734181 | 4.17E-37 |
| TGCT | Epifactor | RBM24 | PRDM1 | 0.80734181 | 4.17E-37 |
| TGCT | Epifactor | RBM24 | UHRF2 | 0.834871383 | 9.01E-42 |
| TGCT | Epifactor | RBM24 | BMI1 | 0.879844968 | 1.29E-51 |
| TGCT | IUPHAR | RBM24 | SLC5A7 | 0.807513399 | 3.92E-37 |
| TGCT | IUPHAR | RBM24 | ACVR1B | 0.830071711 | 6.72E-41 |
| TGCT | Kinase | RBM24 | ACVR1B | 0.830071711 | 6.72E-41 |
| TGCT | TF | RBM24 | ZFP30 | 0.801260906 | 3.54E-36 |
| TGCT | TF | RBM24 | ZNF304 | 0.804693982 | 1.07E-36 |
| TGCT | TF | RBM24 | ZNF345 | 0.805098132 | 9.26E-37 |
| TGCT | TF | RBM24 | PRDM1 | 0.80734181 | 4.17E-37 |
| TGCT | TF | RBM24 | SOX17 | 0.810526548 | 1.32E-37 |
| TGCT | TF | RBM24 | ZNF2 | 0.821866926 | 1.81E-39 |
| TGCT | TF | RBM24 | ZNF548 | 0.841838703 | 4.33E-43 |
| TGCT | TF | RBM24 | ZNF781 | 0.853100768 | 2.31E-45 |
| TGCT | TF | RBM24 | ZNF518B | 0.859292894 | 1.08E-46 |
| TGCT | TSG | RBM24 | KANK1 | 0.803123374 | 1.85E-36 |
| TGCT | TSG | RBM24 | PRDM1 | 0.80734181 | 4.17E-37 |
| TGCT | TSG | RBM24 | NRCAM | 0.8162525 | 1.57E-38 |
| TGCT | TSG | RBM24 | UHRF2 | 0.834871383 | 9.01E-42 |
Top |
|
| Protein 3D structure Visit iCn3D. |
Top |
|
| Protein-protein interaction networks * Overlap between up-regulated DEGs (log2FC<-1 and adj.P<0.05) and STRING PPI network (center: Translation factor, node: DEGs, edges: weighted by -log2(adj.P)) |
 |
| Overlap between down-regulated DEGs (log2FC>1 and adj.P<0.05) and STRING PPI network (center: Translation factor, node: DEGs, edges: weighted by -log2(adj.P)) |
 |
 * Edge colors based on TCGA cancer types. |
| * Overlap between DEGs (log2FC>1 and adj.P<0.05) and STRING PPI network per cancer (center: Translation factor, node: DEGs, node color: log2FC, edges: weighted by -log2(adj.P)) |
 |
| Cancer type | Translation factor | Interacting protein coding gene | FC | adj.pval |
| ESCA | RBM24 | RBM42 | -1.16407050073883 | 0.0009765625 |
| LUAD | RBM24 | CELF1 | -2.27949736131754 | 0.0118606607155675 |
| COAD | RBM24 | SF1 | -4.15611836563102 | 0.0176135301589966 |
| READ | RBM24 | SF1 | -4.06236226767122 | 0.03125 |
| LUAD | RBM24 | RBM42 | -1.122142531126 | 0.0417265102143948 |
| BLCA | RBM24 | SF1 | -2.17267387315221 | 0.0493659973144531 |
| BLCA | RBM24 | RBPMS2 | -9.19886836304731 | 1.1444091796875e-05 |
| BRCA | RBM24 | RBM20 | -1.93319029427805 | 1.28234576273742e-12 |
| STAD | RBM24 | RBPMS2 | -2.4464031312502 | 1.49570405483246e-06 |
| KIRP | RBM24 | RBPMS2 | -2.35527114075536 | 1.60322524607182e-05 |
| LUSC | RBM24 | RBM42 | -5.46633676984415 | 1.95811408544885e-05 |
| THCA | RBM24 | SF1 | -9.3346192550436 | 2.943362132749e-05 |
| PRAD | RBM24 | EPB41 | 1.72202637982275 | 4.09008451860611e-08 |
| THCA | RBM24 | RBM20 | -1.80564303968356 | 6.25847760426763e-06 |
| Protein-protein interactors with this translation factor (BIOGRID-3.4.160) |
| PPI interactors with RBM24 |
| RBFOX1, EPPK1, JUP, SERPINB13, CALML5, H2AFY, TRIM29, IGHG2, IGHG1, RBM38, LGALS7B, CALML3, SERPINB5, PKP1, IVL, ANKRD40, SERPINB2, CRYAB, EVPL, PKP3, PPL, TYMP, PLCD1, DMKN, QSOX1, SERPINB3, POU2AF1, RBPMS, DAZAP2, UBQLN2, C10orf55, DUX4L9, CREBBP, PIK3IP1, SS18L2, |
Top |
|
| Clinically associated variants from ClinVar. |
| Gene | Chr | Position | RefSeq | VarSeq | RefSeeq | VarType | Pathogenic | Disease | VarInfo |
| nsSNVs with sample frequency (size of circle) from TCGA 33 cancers. |
 |
| SNVs and Indels |
| Gene | Cancer type | Chromosome | Start | End | RefSeeq | MutSeq | Mutation type | AAchange | # samples |
| RBM24 | KIRC | chr6 | 17292140 | 17292140 | C | T | Silent | p.A167A | 5 |
| RBM24 | BRCA | chr6 | 17292294 | 17292294 | G | A | Missense_Mutation | p.A219T | 4 |
| RBM24 | KIRP | chr6 | 17292212 | 17292212 | G | A | Silent | p.G191G | 4 |
| RBM24 | STAD | chr6 | 17292146 | 17292146 | C | T | Silent | p.A169A | 3 |
| RBM24 | ESCA | chr6 | 17292011 | 17292011 | G | T | Silent | p.P124P | 3 |
| RBM24 | LUAD | chr6 | 17292081 | 17292081 | C | A | Missense_Mutation | p.P148T | 3 |
| RBM24 | PAAD | chr6 | 17283114 | 17283114 | G | A | Missense_Mutation | p.V83M | 3 |
| RBM24 | BRCA | chr6 | 17283067 | 17283067 | G | C | Missense_Mutation | p.R67T | 3 |
| RBM24 | STAD | chr6 | 17292143 | 17292143 | C | T | Silent | p.A168A | 2 |
| RBM24 | CESC | chr6 | 17292245 | 17292245 | C | T | Silent | 2 | |
| RBM24 | LUAD | chr6 | 17292055 | 17292055 | C | A | Missense_Mutation | p.P139Q | 2 |
| RBM24 | STAD | chr6 | 17292068 | 17292068 | C | T | Silent | p.A143A | 2 |
| RBM24 | LUAD | chr6 | 17292138 | 17292138 | G | A | Missense_Mutation | p.A167T | 2 |
| RBM24 | HNSC | chr6 | 17291995 | 17291995 | C | T | Missense_Mutation | p.A119V | 2 |
| RBM24 | LUAD | chr6 | 17283081 | 17283081 | C | A | Missense_Mutation | p.P72T | 2 |
| RBM24 | SARC | chr6 | 17292011 | 17292011 | G | T | Silent | 2 | |
| RBM24 | STAD | chr6 | 17292264 | 17292264 | G | T | Missense_Mutation | p.A209S | 2 |
| RBM24 | LUAD | chr6 | 17292285 | 17292285 | G | T | Missense_Mutation | p.A216S | 2 |
| RBM24 | STAD | chr6 | 17292117 | 17292117 | T | C | Missense_Mutation | p.Y160H | 2 |
| RBM24 | ESCA | chr6 | 17292449 | 17292449 | A | - | RNA | NULL | 2 |
| RBM24 | STAD | chr6 | 17292179 | 17292179 | C | A | Silent | p.A180A | 2 |
| RBM24 | UCEC | chr6 | 17281911 | 17281911 | C | A | Silent | p.V33 | 2 |
| RBM24 | UCEC | chr6 | 17292140 | 17292140 | C | T | Silent | p.P132L | 2 |
| RBM24 | BRCA | chr6 | 17292010 | 17292010 | C | T | Missense_Mutation | p.P124L | 2 |
| RBM24 | LIHC | chr6 | 17281858 | 17281858 | G | - | Frame_Shift_Del | p.G17fs | 2 |
| RBM24 | STAD | chr6 | 17292149 | 17292149 | T | C | Silent | p.A170A | 2 |
| RBM24 | UCEC | chr6 | 17292146 | 17292146 | C | T | Silent | p.P134L | 2 |
| RBM24 | ESCA | chr6 | 17292224 | 17292224 | C | T | Silent | 2 | |
| RBM24 | LIHC | chr6 | 17284896 | 17284896 | T | - | Frame_Shift_Del | p.F101fs | 1 |
| RBM24 | PAAD | chr6 | 17292038 | 17292038 | C | G | Silent | p.V133V | 1 |
| RBM24 | SKCM | chr6 | 17292009 | 17292009 | C | T | Missense_Mutation | p.P124S | 1 |
| RBM24 | LIHC | chr6 | 17292029 | 17292029 | G | - | Frame_Shift_Del | p.P130fs | 1 |
| RBM24 | PAAD | chr6 | 17283114 | 17283114 | G | A | Missense_Mutation | 1 | |
| RBM24 | ESCA | chr6 | 17292224 | 17292224 | C | T | Silent | p.Y195Y | 1 |
| RBM24 | SKCM | chr6 | 17291987 | 17291987 | G | A | Splice_Site | p.G116_splice | 1 |
| RBM24 | COAD | chr6 | 17292140 | 17292140 | C | T | Silent | p.A122A | 1 |
| RBM24 | PCPG | chr6 | 17283076 | 17283076 | A | T | Missense_Mutation | p.K70M | 1 |
| RBM24 | HNSC | chr6 | 17291995 | 17291995 | C | T | Missense_Mutation | 1 | |
| RBM24 | SKCM | chr6 | 17283149 | 17283149 | C | T | Silent | p.I94I | 1 |
| RBM24 | THYM | chr6 | 17292130 | 17292130 | C | T | Missense_Mutation | 1 | |
| RBM24 | COAD | chr6 | 17292149 | 17292149 | T | C | Silent | p.A125A | 1 |
| RBM24 | READ | chr6 | 17284940 | 17284940 | C | T | Silent | p.F70F | 1 |
| RBM24 | HNSC | chr6 | 17292144 | 17292144 | G | A | Missense_Mutation | p.A169T | 1 |
| RBM24 | SKCM | chr6 | 17284914 | 17284914 | C | T | Missense_Mutation | p.H107Y | 1 |
| RBM24 | THYM | chr6 | 17281866 | 17281866 | G | A | Silent | 1 | |
| RBM24 | ESCA | chr6 | 17283276 | 17283276 | A | G | RNA | NULL | 1 |
| RBM24 | SARC | chr6 | 17284893 | 17284893 | G | T | Missense_Mutation | 1 | |
| RBM24 | STAD | chr6 | 17292264 | 17292264 | G | T | Missense_Mutation | 1 | |
| RBM24 | THYM | chr6 | 17292130 | 17292130 | C | T | Missense_Mutation | p.A164V | 1 |
| RBM24 | ESCA | chr6 | 17291124 | 17291124 | G | T | RNA | NULL | 1 |
| RBM24 | ESCA | chr6 | 17292448 | 17292449 | - | AAA | RNA | NULL | 1 |
| RBM24 | SKCM | chr6 | 17292073 | 17292073 | C | T | Missense_Mutation | p.S100F | 1 |
| RBM24 | THYM | chr6 | 17281866 | 17281866 | G | A | Silent | p.L18L | 1 |
| RBM24 | LUAD | chr6 | 17292272 | 17292272 | C | T | Silent | p.A211A | 1 |
| RBM24 | SKCM | chr6 | 17292009 | 17292009 | C | T | Missense_Mutation | p.P79S | 1 |
| RBM24 | KIRP | chr6 | 17292212 | 17292212 | G | A | Silent | 1 | |
| RBM24 | BLCA | chr6 | 17292231 | 17292231 | C | T | Nonsense_Mutation | p.Q198* | 1 |
| RBM24 | LUAD | chr6 | 17292270 | 17292270 | G | A | Missense_Mutation | p.A211T | 1 |
| RBM24 | ESCA | chr6 | 17292540 | 17292540 | G | T | RNA | NULL | 1 |
| RBM24 | SKCM | chr6 | 17291987 | 17291987 | G | A | Silent | p.G71G | 1 |
| RBM24 | LIHC | chr6 | 17281858 | 17281858 | G | - | Frame_Shift_Del | p.V15fs | 1 |
| RBM24 | STAD | chr6 | 17283113 | 17283113 | C | T | Silent | p.N82N | 1 |
| RBM24 | OV | chr6 | 17284942 | 17284942 | G | A | Missense_Mutation | p.G71E | 1 |
| RBM24 | ESCA | chr6 | 17292855 | 17292855 | C | G | RNA | NULL | 1 |
| RBM24 | SKCM | chr6 | 17292073 | 17292073 | C | T | Missense_Mutation | p.S145F | 1 |
| RBM24 | SKCM | chr6 | 17292259 | 17292259 | G | A | Missense_Mutation | p.G207E | 1 |
| Copy number variation (CNV) of RBM24 * Click on the image to open the original image in a new window. |
 |
| Fusion gene breakpoints (product of the structural variants (SVs)) across RBM24 * Click on the image to open the UCSC genome browser with custom track showing this image in a new window. |
 |
| Fusion genes with this translation factor from FusionGDB2.0. |
| FusionGDB2 ID | Disease | Sample | Hgene | Hchr | Hbp | Hstrand | Tgene | Tchr | Tbp | Tstrand |
| 24781 | BRCA | TCGA-B6-A0I6-01A | CDKAL1 | chr6 | 20955816 | + | RBM24 | chr6 | 17291987 | + |
| 24781 | SARC | TCGA-IW-A3M4-01A | DST | chr6 | 56354288 | - | RBM24 | chr6 | 17291987 | + |
| 24783 | OV | TCGA-25-2393-01A | E2F3 | chr6 | 20404063 | + | RBM24 | chr6 | 17283036 | + |
Top |
|
| Kaplan-Meier plots with logrank tests of overall survival (OS) |
 |
| Cancer type | Translation factor | Coefficent | Hazard ratio | Wald test pval | Likelihool ratio pval | Logrank test pval | # samples |
Top |
|
| Differential gene expression between female and male. (Wilcoxon test, pval<0.05) |
 |
| Cancer type | Translation factor | pval | adj.p |
| TGCT | RBM24 | 0.000469267515286963 | 0.013 |
| KIRC | RBM24 | 0.00140315319276969 | 0.036 |
| KIRP | RBM24 | 0.00238643590428942 | 0.06 |
| SARC | RBM24 | 0.00973303664880348 | 0.23 |
| LAML | RBM24 | 0.0119772926982472 | 0.28 |
| BLCA | RBM24 | 0.0211284102468715 | 0.46 |
| PAAD | RBM24 | 0.0366902500725875 | 0.77 |
| LIHC | RBM24 | 4.7118583950832e-08 | 1.3e-06 |
Top |
|
| Differential gene expression between young and old age groups (Wilcoxon test, pval<0.05) |
 |
| Cancer type | Translation factor | pval | adj.p |
| PRAD | RBM24 | 0.00149173474369712 | 0.049 |
| BLCA | RBM24 | 0.0311056544468953 | 0.96 |
| SARC | RBM24 | 0.0213093552497233 | 0.68 |
Top |
|
| Drugs targeting genes involved in this translation factor. (DrugBank Version 5.1.8 2021-05-08) |
| UniProtAcc | DrugBank ID | Drug name | Drug activity | Drug type | Drug status |
Top |
|
| Diseases associated with this translation factor. (DisGeNet 4.0) |
| Disease ID | Disease Name | # PubMeds | Disease source |
(UTHealth)
Web File Viewing | Emergency Information |Campus Carry|Site Policies