
|
||||||
|

Translation Factor: METAP1 (NCBI Gene ID:23173) |
|
 Gene Summary Gene Summary |
| Gene Information | Gene Name: METAP1 | Gene ID: 23173 | Gene Symbol | METAP1 | Gene ID | 23173 |
| Gene Name | methionyl aminopeptidase 1 | |
| Synonyms | MAP1A|MetAP1A | |
| Cytomap | 4q23 | |
| Type of Gene | protein-coding | |
| Description | methionine aminopeptidase 1MAP 1metAP 1peptidase M 1 | |
| Modification date | 20200313 | |
| UniProtAcc | P53582 | |
| Child GO biological process term(s) under GO:0006412 |
| GO ID | GO term |
| GO:0006417 | Regulation of translation |
| GO:0006412 | Translation |
| Gene ontology of translaction factor with evidence of Inferred from Direct Assay (IDA) from Entrez |
| Partner | Gene | GO ID | GO term | PubMed ID |
| Inferred gene age of translation factor. |
| Gene | Inferred gene age group among (0 - 67.6], (67.6 - 355.7], (355.7 - 733], (733 - 1119.25], >1119.25 |
Top |
|
| We searched PubMed using 'METAP1[title] AND translation [title] AND human.' |
| Gene | Title | PMID |
| METAP1 | . | . |
Top |
|
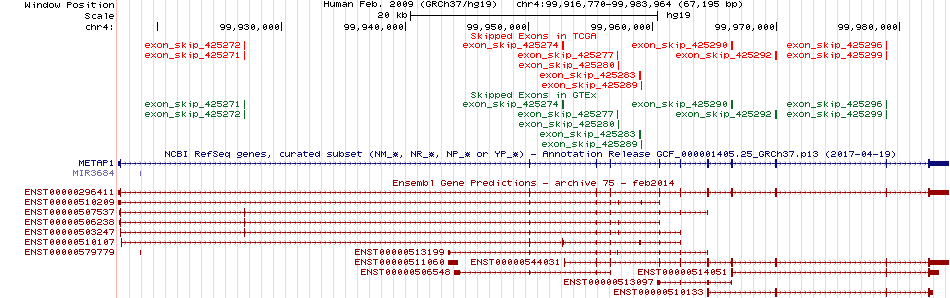
| Skipped exons in TCGA and GTEx based on Ensembl gene isoform structure. * Click on the image to open the UCSC genome browser with custom track showing this image in a new window. For more annotations, please visit our ExonSkipDB. |
 |
| Open reading frame (ORF) analsis of exon skipping events based on Ensembl gene isoform structure. * Click on the break point to see the gene structure around the break point region using the UCSC Genome Browser. |
| ENST | Exon skip start (DNA) | Exon Skip end (DNA) | ORF |
| ENST00000296411 | 99966329 | 99966461 | In-frame |
| ENST00000296411 | 99969883 | 99970027 | In-frame |
| ENST00000296411 | 99978903 | 99978969 | In-frame |
| Exon skipping position in the amino acid sequence. |
| ENST | Exon skip start (DNA) | Exon Skip end (DNA) | Len(transcript seq) | Exon skip start (mRNA) | Exon Skip end (mRNA) | Len(amino acid seq) | Exon skip start (AA) | Exon Skip end (AA) |
| ENST00000296411 | 99966329 | 99966461 | 2808 | 790 | 921 | 386 | 218 | 262 |
| ENST00000296411 | 99969883 | 99970027 | 2808 | 922 | 1065 | 386 | 262 | 310 |
| ENST00000296411 | 99978903 | 99978969 | 2808 | 1066 | 1131 | 386 | 310 | 332 |
| Potentially (partially) lost protein functional features of UniProt. |
| UniProtAcc | Exon skip start (AA) | Exon Skip end (AA) | Function feature start (AA) | Function feature end (AA) | Functional feature type | Functional feature desc. |
| P53582 | 262 | 310 | 2 | 386 | Chain | ID=PRO_0000148967;Note=Methionine aminopeptidase 1 |
| P53582 | 218 | 262 | 2 | 386 | Chain | ID=PRO_0000148967;Note=Methionine aminopeptidase 1 |
| P53582 | 310 | 332 | 2 | 386 | Chain | ID=PRO_0000148967;Note=Methionine aminopeptidase 1 |
| P53582 | 218 | 262 | 220 | 220 | Metal binding | Note=Divalent metal cation 1;Ontology_term=ECO:0000255,ECO:0000269,ECO:0000269,ECO:0000269,ECO:0000269;evidence=ECO:0000255|HAMAP-Rule:MF_03174,ECO:0000269|PubMed:16274222,ECO:0000269|PubMed:16724298,ECO:0000269|PubMed:16823043,ECO:0000269|PubMed:17114291;Dbxref=PMID:16274222,PMID:16724298,PMID:16823043,PMID:17114291 |
| P53582 | 218 | 262 | 231 | 231 | Metal binding | Note=Divalent metal cation 1;Ontology_term=ECO:0000255,ECO:0000269,ECO:0000269,ECO:0000269,ECO:0000269;evidence=ECO:0000255|HAMAP-Rule:MF_03174,ECO:0000269|PubMed:16274222,ECO:0000269|PubMed:16724298,ECO:0000269|PubMed:16823043,ECO:0000269|PubMed:17114291;Dbxref=PMID:16274222,PMID:16724298,PMID:16823043,PMID:17114291 |
| P53582 | 218 | 262 | 231 | 231 | Metal binding | Note=Divalent metal cation 2%3B catalytic;Ontology_term=ECO:0000255,ECO:0000269,ECO:0000269,ECO:0000269,ECO:0000269;evidence=ECO:0000255|HAMAP-Rule:MF_03174,ECO:0000269|PubMed:16274222,ECO:0000269|PubMed:16724298,ECO:0000269|PubMed:16823043,ECO:0000269|PubMed:17114291;Dbxref=PMID:16274222,PMID:16724298,PMID:16823043,PMID:17114291 |
| P53582 | 262 | 310 | 294 | 294 | Metal binding | Note=Divalent metal cation 2%3B catalytic%3B via tele nitrogen;Ontology_term=ECO:0000255,ECO:0000269,ECO:0000269,ECO:0000269,ECO:0000269;evidence=ECO:0000255|HAMAP-Rule:MF_03174,ECO:0000269|PubMed:16274222,ECO:0000269|PubMed:16724298,ECO:0000269|PubMed:16823043,ECO:0000269|PubMed:17114291;Dbxref=PMID:16274222,PMID:16724298,PMID:16823043,PMID:17114291 |
| P53582 | 310 | 332 | 327 | 327 | Metal binding | Note=Divalent metal cation 2%3B catalytic;Ontology_term=ECO:0000255,ECO:0000269,ECO:0000269,ECO:0000269,ECO:0000269;evidence=ECO:0000255|HAMAP-Rule:MF_03174,ECO:0000269|PubMed:16274222,ECO:0000269|PubMed:16724298,ECO:0000269|PubMed:16823043,ECO:0000269|PubMed:17114291;Dbxref=PMID:16274222,PMID:16724298,PMID:16823043,PMID:17114291 |
| P53582 | 262 | 310 | 301 | 301 | Binding site | Note=Substrate;Ontology_term=ECO:0000255,ECO:0000269,ECO:0000269,ECO:0000269;evidence=ECO:0000255|HAMAP-Rule:MF_03174,ECO:0000269|PubMed:16724298,ECO:0000269|PubMed:16823043,ECO:0000269|PubMed:17114291;Dbxref=PMID:16724298,PMID:16823043,PMID:17114291 |
| P53582 | 218 | 262 | 216 | 225 | Beta strand | Ontology_term=ECO:0000244;evidence=ECO:0000244|PDB:2B3H |
| P53582 | 218 | 262 | 228 | 237 | Beta strand | Ontology_term=ECO:0000244;evidence=ECO:0000244|PDB:2B3H |
| P53582 | 218 | 262 | 243 | 261 | Helix | Ontology_term=ECO:0000244;evidence=ECO:0000244|PDB:2B3H |
| P53582 | 262 | 310 | 271 | 282 | Helix | Ontology_term=ECO:0000244;evidence=ECO:0000244|PDB:2B3H |
| P53582 | 262 | 310 | 293 | 295 | Beta strand | Ontology_term=ECO:0000244;evidence=ECO:0000244|PDB:2B3H |
| P53582 | 262 | 310 | 297 | 306 | Beta strand | Ontology_term=ECO:0000244;evidence=ECO:0000244|PDB:2B3H |
| P53582 | 262 | 310 | 309 | 311 | Beta strand | Ontology_term=ECO:0000244;evidence=ECO:0000244|PDB:2B3H |
| P53582 | 310 | 332 | 309 | 311 | Beta strand | Ontology_term=ECO:0000244;evidence=ECO:0000244|PDB:2B3H |
| P53582 | 310 | 332 | 323 | 326 | Beta strand | Ontology_term=ECO:0000244;evidence=ECO:0000244|PDB:2B3H |
| P53582 | 310 | 332 | 329 | 333 | Beta strand | Ontology_term=ECO:0000244;evidence=ECO:0000244|PDB:2B3H |
Top |
|
| Gene expression level across TCGA pancancer |
 |
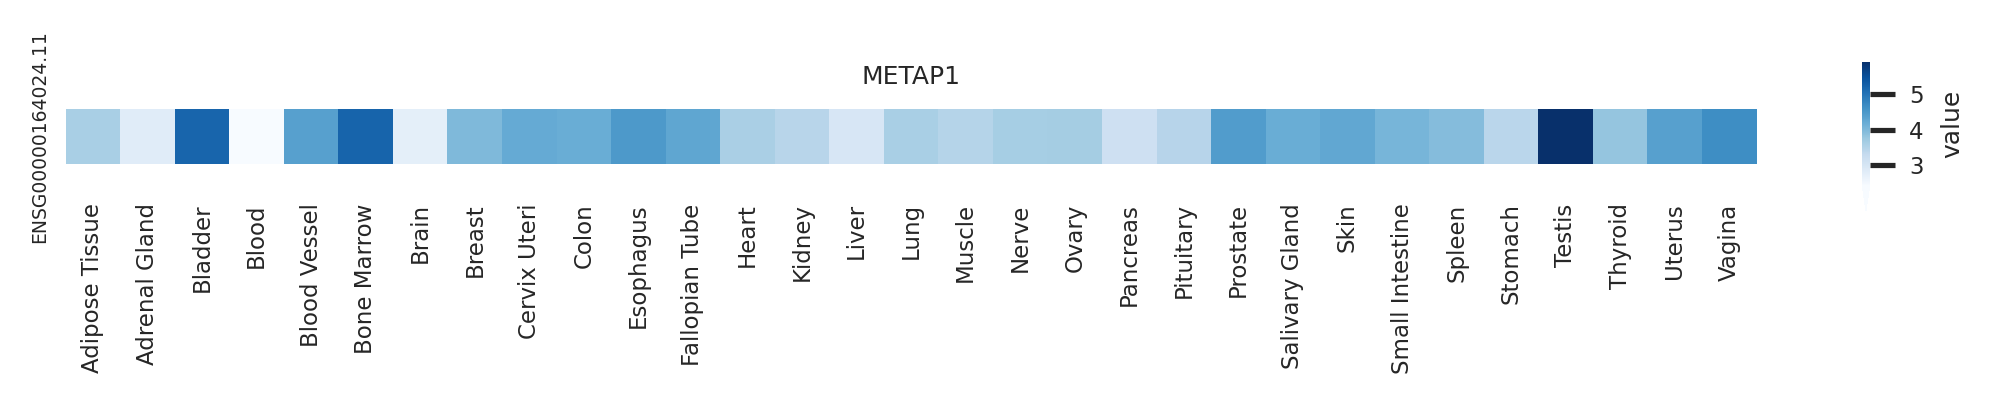
| Gene expression level across GTEx pantissue |
 |
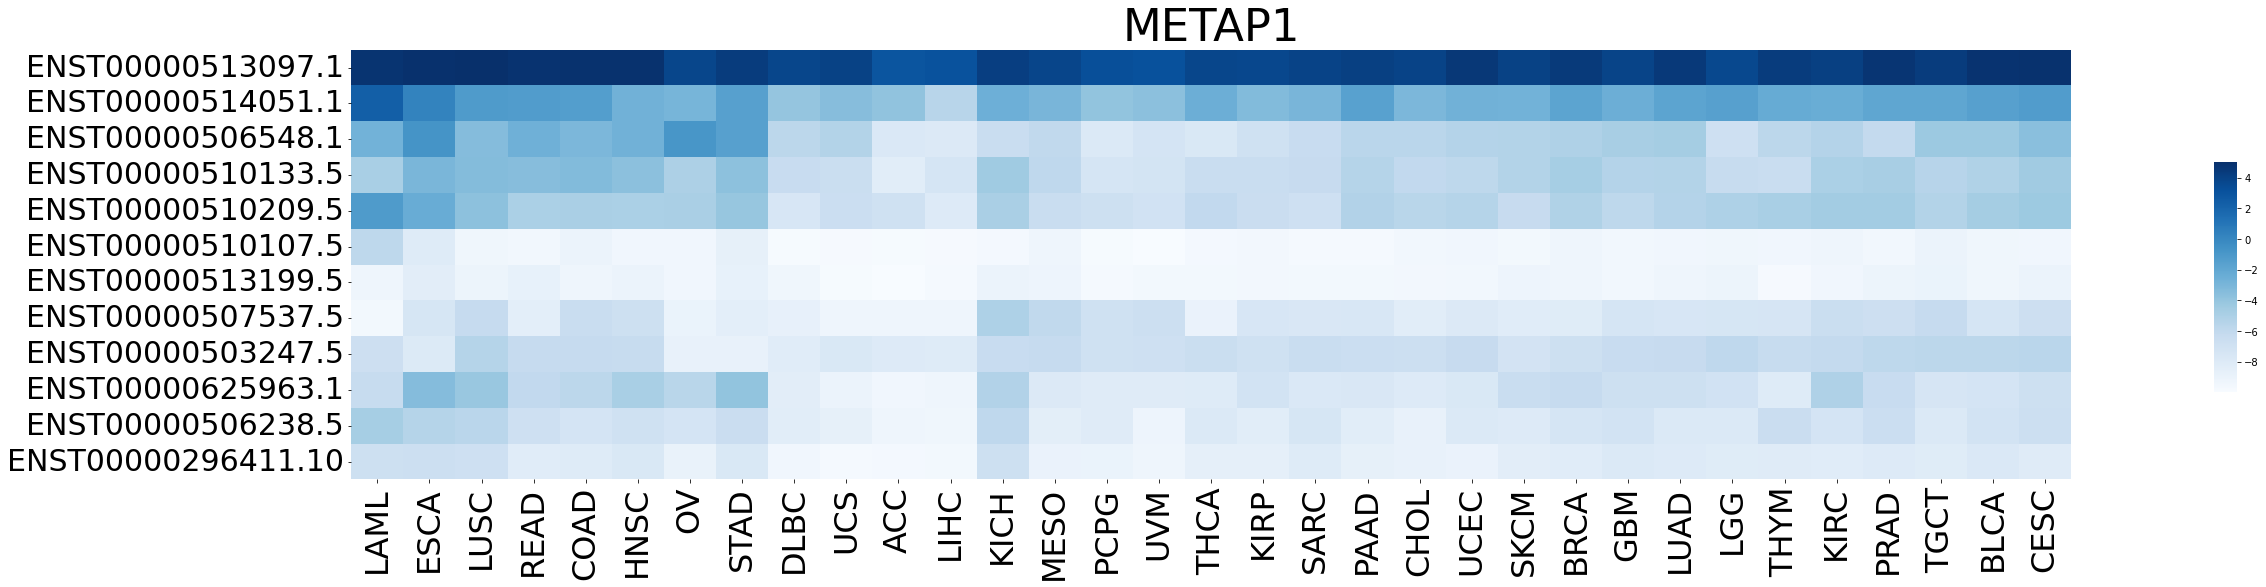
| Expression level of gene isoforms across TCGA pancancer |
 |
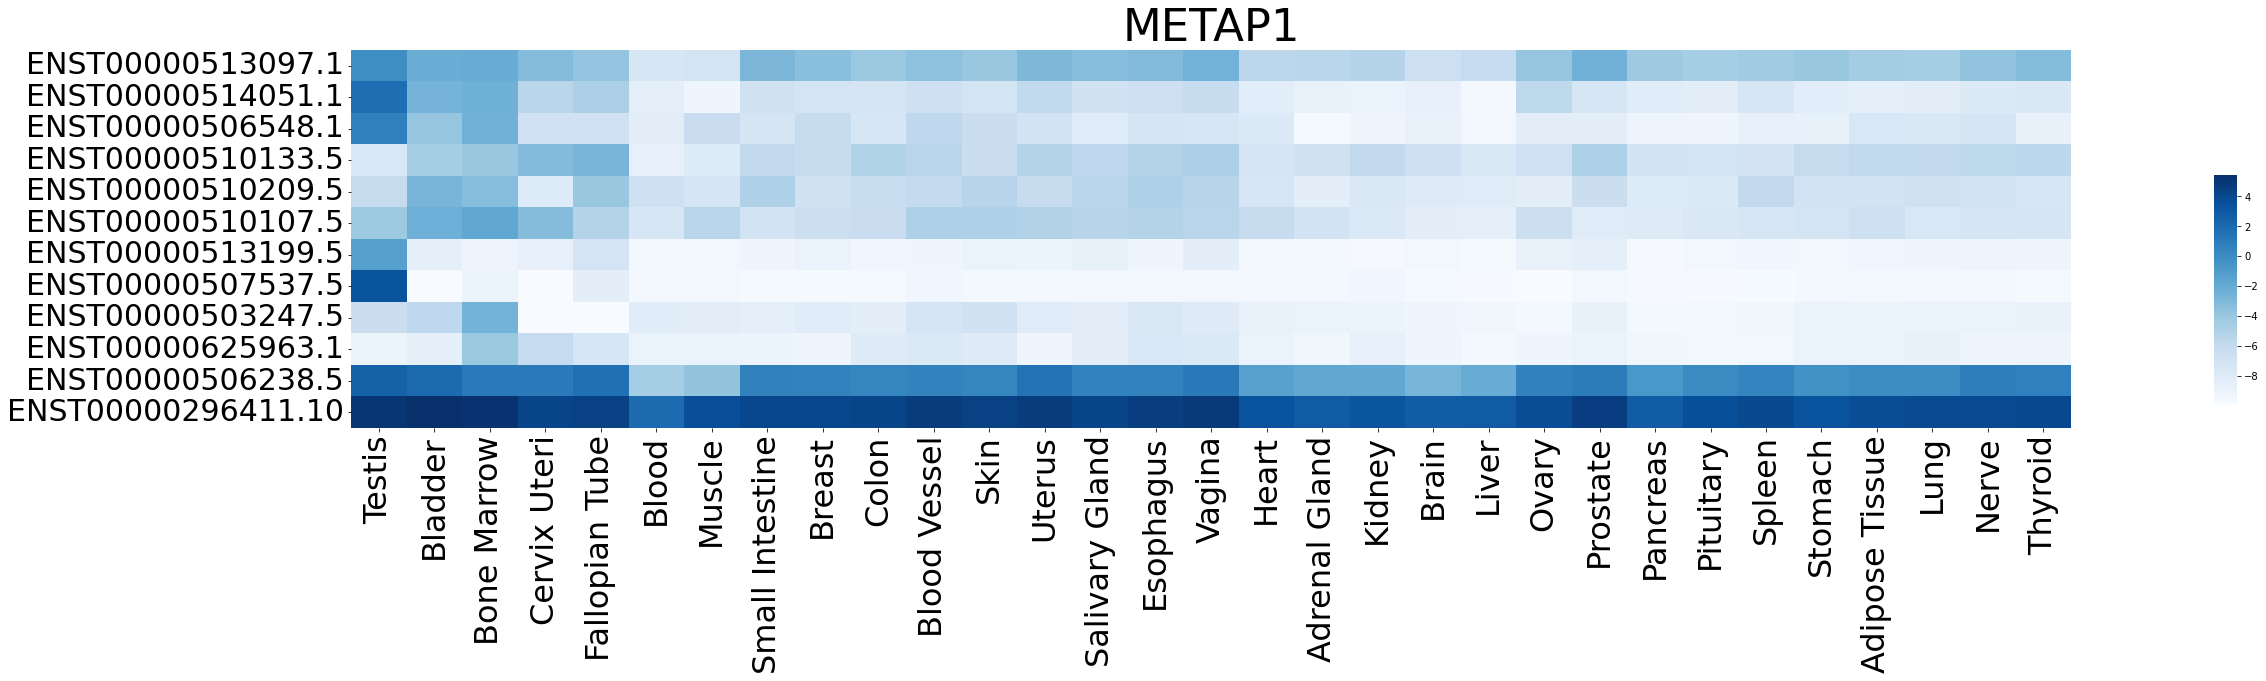
| Expression level of gene isoforms across GTEx pantissue |
 |
| Cancer(tissue) type-specific expression level of Translation factor using z-score distriution |
 |
| Differential expression between tumor and matched normal (in the cancer types with more than 10 matched samples) |
 |
| Cancer type | Translation factor | FC | adj.pval |
| KIRP | METAP1 | 1.245174280985 | 0.0111397774890065 |
Top |
|
| Translation factor expression regulation through miRNA binding |
| Cancer type | Gene | miRNA | TargetScan binding score (Context++ score percentile) | Coefficient | Pvalue |
| LUSC | METAP1 | hsa-miR-143-3p | 88 | -0.339629990262902 | 0.00231353891581781 |
| Translation factor expression regulation through methylation in the promoter of Translation factor |
 |
| Cancer type | Gene | methyl group b | methyl group a | DEG pval | avg methyl in b | avg methyl in a | avg exp in b | avg exp in a |
| Translation factor expression regulation through methylation in the gene body of Translation factor (positive regulation) |
 |
| Cancer type | Gene | methyl group b | methyl group a | DEG pval | avg methyl in b | avg methyl in a | avg exp in b | avg exp in a |
| Translation factor expression regulation through copy number variation of Translation factor |
 |
| Cancer type | Gene | Coefficient | Pvalue |
| LUSC | METAP1 | -0.135663252 | 0.001659752 |
| TGCT | METAP1 | -0.074623144 | 0.015921932 |
| KIRP | METAP1 | 0.038692603 | 0.016306039 |
Top |
|
| Strongly correlated genes belong to cellular important gene groups with METAP1 (coefficient>0.8, pval<0.05, node color based on FC between tumor and matched normal). Significantly associated important genes in the individual cancer types. * Cell metabolism gene: cell metabolism genes from REACTOME (black edge), IUPHAR: drug target genes from IUPHAR (blue edge), Kinase: human kinase genes (brown edge), CGC: cancer gene census genes (orange edge), TSG: tumor suppresor genes (purple edge), Epifactor: epigenetic factors (light blue edge), TF: transcription factors (green) |
 |
| Cancer type | Gene group | Translation factor | Correlated gene | Coefficient | Pvalue |
| DLBC | Cell metabolism gene | METAP1 | PFAS | 0.816313037 | 1.54E-12 |
| DLBC | Cell metabolism gene | METAP1 | L2HGDH | 0.821720396 | 8.23E-13 |
| DLBC | Cell metabolism gene | METAP1 | NUP54 | 0.870653559 | 8.95E-16 |
| THYM | Cell metabolism gene | METAP1 | NUP205 | 0.800785669 | 1.75E-28 |
| THYM | Cell metabolism gene | METAP1 | ENOPH1 | 0.801106047 | 1.60E-28 |
| THYM | Cell metabolism gene | METAP1 | POLR2B | 0.80844974 | 2.12E-29 |
| THYM | Cell metabolism gene | METAP1 | NUP107 | 0.86604313 | 6.25E-38 |
| THYM | CGC | METAP1 | PWWP2A | 0.80811595 | 2.33E-29 |
| THYM | CGC | METAP1 | RAD21 | 0.828370091 | 5.51E-32 |
| THYM | CGC | METAP1 | SUZ12 | 0.831030795 | 2.35E-32 |
| THYM | CGC | METAP1 | ABI1 | 0.875096709 | 1.24E-39 |
| THYM | CGC | METAP1 | TOP1 | 0.889305422 | 1.37E-42 |
| THYM | Epifactor | METAP1 | YY1 | 0.801280785 | 1.53E-28 |
| THYM | Epifactor | METAP1 | MASTL | 0.802480492 | 1.11E-28 |
| THYM | Epifactor | METAP1 | RCOR1 | 0.827003644 | 8.49E-32 |
| THYM | Epifactor | METAP1 | SUZ12 | 0.831030795 | 2.35E-32 |
| THYM | Epifactor | METAP1 | PHF20L1 | 0.833492537 | 1.05E-32 |
| THYM | Epifactor | METAP1 | TAF4 | 0.8425155 | 4.94E-34 |
| THYM | Epifactor | METAP1 | ACTL6A | 0.858217577 | 1.48E-36 |
| THYM | IUPHAR | METAP1 | SLC35A3 | 0.801739395 | 1.35E-28 |
| THYM | IUPHAR | METAP1 | MASTL | 0.802480492 | 1.11E-28 |
| THYM | IUPHAR | METAP1 | OXSR1 | 0.808162854 | 2.30E-29 |
| THYM | IUPHAR | METAP1 | TOP1 | 0.889305422 | 1.37E-42 |
| THYM | Kinase | METAP1 | MASTL | 0.802480492 | 1.11E-28 |
| THYM | Kinase | METAP1 | OXSR1 | 0.808162854 | 2.30E-29 |
| THYM | Kinase | METAP1 | PAN3 | 0.826674511 | 9.42E-32 |
| THYM | TF | METAP1 | YY1 | 0.801280785 | 1.53E-28 |
| THYM | TF | METAP1 | ZUFSP | 0.802030395 | 1.25E-28 |
| THYM | TF | METAP1 | ELF1 | 0.813635424 | 4.83E-30 |
| THYM | TF | METAP1 | ZNF143 | 0.818443117 | 1.17E-30 |
| THYM | TF | METAP1 | ZNF207 | 0.843827518 | 3.11E-34 |
| THYM | TF | METAP1 | ZNF131 | 0.854117019 | 7.20E-36 |
| THYM | TSG | METAP1 | INTS6 | 0.812267192 | 7.17E-30 |
| THYM | TSG | METAP1 | SUZ12 | 0.831030795 | 2.35E-32 |
| THYM | TSG | METAP1 | LIN9 | 0.856386382 | 3.02E-36 |
| THYM | TSG | METAP1 | CCAR1 | 0.891835206 | 3.70E-43 |
| UCS | Cell metabolism gene | METAP1 | NUP205 | 0.800785669 | 1.75E-28 |
| UCS | Cell metabolism gene | METAP1 | ENOPH1 | 0.801106047 | 1.60E-28 |
| UCS | Cell metabolism gene | METAP1 | POLR2B | 0.80844974 | 2.12E-29 |
| UCS | Cell metabolism gene | METAP1 | NUP107 | 0.86604313 | 6.25E-38 |
| UCS | CGC | METAP1 | PWWP2A | 0.80811595 | 2.33E-29 |
| UCS | CGC | METAP1 | RAD21 | 0.828370091 | 5.51E-32 |
| UCS | CGC | METAP1 | SUZ12 | 0.831030795 | 2.35E-32 |
| UCS | CGC | METAP1 | ABI1 | 0.875096709 | 1.24E-39 |
| UCS | CGC | METAP1 | TOP1 | 0.889305422 | 1.37E-42 |
| UCS | Epifactor | METAP1 | YY1 | 0.801280785 | 1.53E-28 |
| UCS | Epifactor | METAP1 | MASTL | 0.802480492 | 1.11E-28 |
| UCS | Epifactor | METAP1 | RCOR1 | 0.827003644 | 8.49E-32 |
| UCS | Epifactor | METAP1 | SUZ12 | 0.831030795 | 2.35E-32 |
| UCS | Epifactor | METAP1 | PHF20L1 | 0.833492537 | 1.05E-32 |
| UCS | Epifactor | METAP1 | TAF4 | 0.8425155 | 4.94E-34 |
| UCS | Epifactor | METAP1 | ACTL6A | 0.858217577 | 1.48E-36 |
| UCS | IUPHAR | METAP1 | SLC35A3 | 0.801739395 | 1.35E-28 |
| UCS | IUPHAR | METAP1 | MASTL | 0.802480492 | 1.11E-28 |
| UCS | IUPHAR | METAP1 | OXSR1 | 0.808162854 | 2.30E-29 |
| UCS | IUPHAR | METAP1 | TOP1 | 0.889305422 | 1.37E-42 |
| UCS | Kinase | METAP1 | MASTL | 0.802480492 | 1.11E-28 |
| UCS | Kinase | METAP1 | OXSR1 | 0.808162854 | 2.30E-29 |
| UCS | Kinase | METAP1 | PAN3 | 0.826674511 | 9.42E-32 |
| UCS | TF | METAP1 | YY1 | 0.801280785 | 1.53E-28 |
| UCS | TF | METAP1 | ZUFSP | 0.802030395 | 1.25E-28 |
| UCS | TF | METAP1 | ELF1 | 0.813635424 | 4.83E-30 |
| UCS | TF | METAP1 | ZNF143 | 0.818443117 | 1.17E-30 |
| UCS | TF | METAP1 | ZNF207 | 0.843827518 | 3.11E-34 |
| UCS | TF | METAP1 | ZNF131 | 0.854117019 | 7.20E-36 |
| UCS | TSG | METAP1 | INTS6 | 0.812267192 | 7.17E-30 |
| UCS | TSG | METAP1 | SUZ12 | 0.831030795 | 2.35E-32 |
| UCS | TSG | METAP1 | LIN9 | 0.856386382 | 3.02E-36 |
| UCS | TSG | METAP1 | CCAR1 | 0.891835206 | 3.70E-43 |
Top |
|
| Protein 3D structure Visit iCn3D. |
Top |
|
| Protein-protein interaction networks * Overlap between up-regulated DEGs (log2FC<-1 and adj.P<0.05) and STRING PPI network (center: Translation factor, node: DEGs, edges: weighted by -log2(adj.P)) |
 |
| Overlap between down-regulated DEGs (log2FC>1 and adj.P<0.05) and STRING PPI network (center: Translation factor, node: DEGs, edges: weighted by -log2(adj.P)) |
 |
 * Edge colors based on TCGA cancer types. |
| * Overlap between DEGs (log2FC>1 and adj.P<0.05) and STRING PPI network per cancer (center: Translation factor, node: DEGs, node color: log2FC, edges: weighted by -log2(adj.P)) |
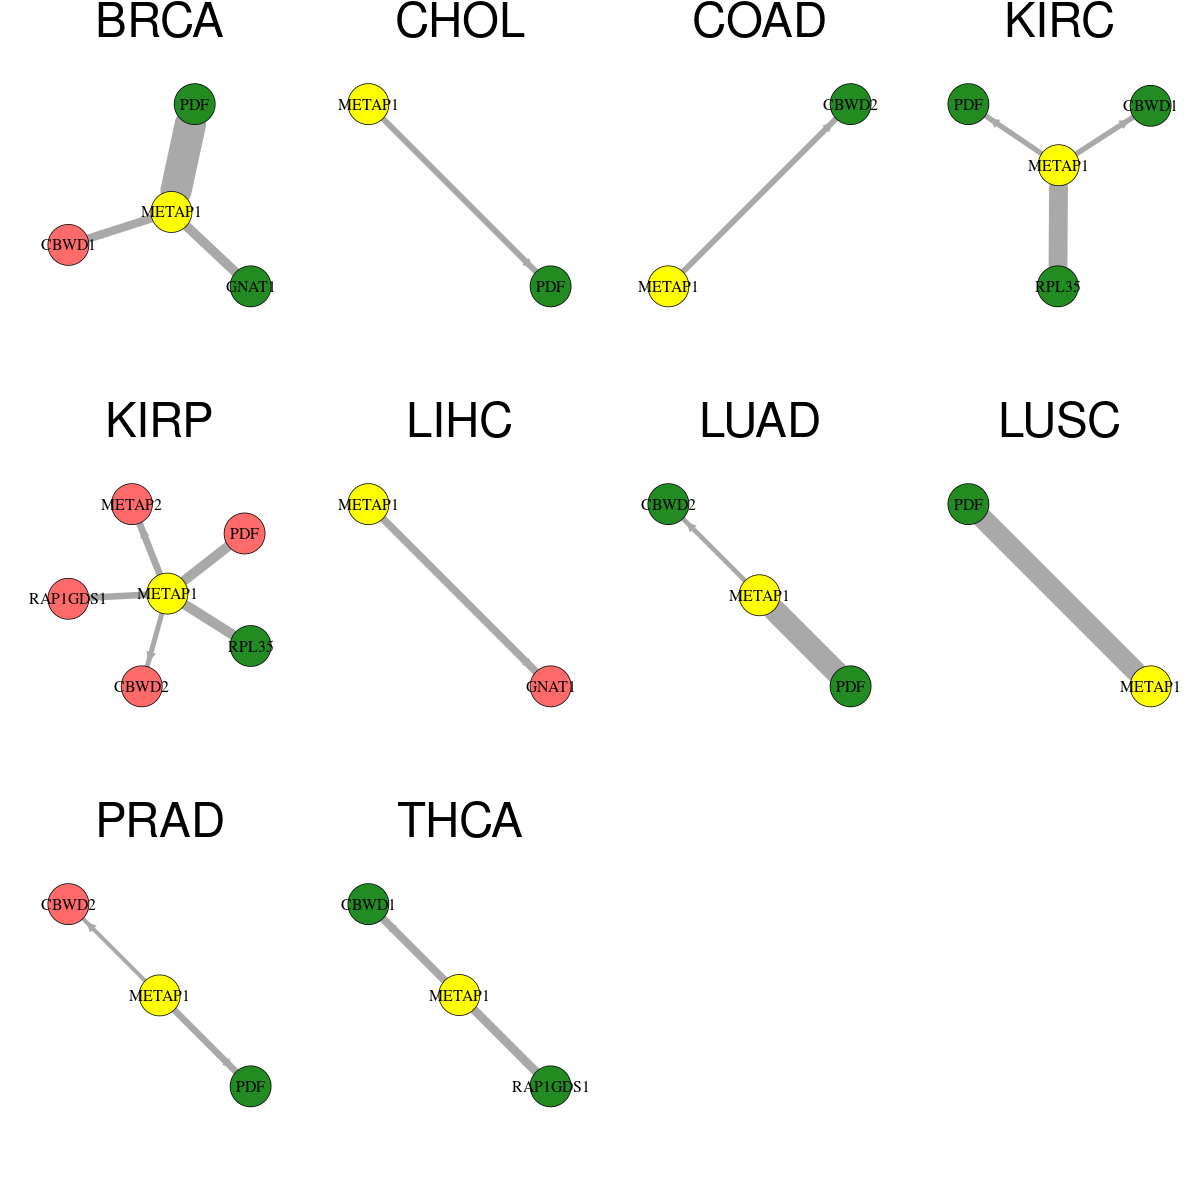 |
| Cancer type | Translation factor | Interacting protein coding gene | FC | adj.pval |
| BRCA | METAP1 | GNAT1 | -1.0348316939997 | 0.000149602949838969 |
| THCA | METAP1 | RAP1GDS1 | -1.10586439664627 | 0.000331869180527397 |
| BRCA | METAP1 | CBWD1 | 1.03561500229833 | 0.000449442253060614 |
| THCA | METAP1 | CBWD1 | -1.50317298135753 | 0.0006917829126832 |
| LIHC | METAP1 | GNAT1 | 1.01655826832652 | 0.000958264675071377 |
| KIRP | METAP1 | METAP2 | 1.2125553034505 | 0.00166679499670863 |
| PRAD | METAP1 | -1.83573074557218 | 0.00211503858224308 | |
| KIRP | METAP1 | RAP1GDS1 | 1.5813279692516 | 0.00239070039242506 |
| CHOL | METAP1 | -2.35440894163977 | 0.00390625 | |
| COAD | METAP1 | CBWD2 | -2.30963913496783 | 0.00468936562538148 |
| KIRC | METAP1 | CBWD1 | -1.07972278959177 | 0.00644033795389533 |
| KIRC | METAP1 | -2.08272493094078 | 0.00724874285490747 | |
| KIRP | METAP1 | CBWD2 | 1.96991067828116 | 0.0093395933508873 |
| LUAD | METAP1 | CBWD2 | -1.06262193861601 | 0.0129444588278098 |
| PRAD | METAP1 | CBWD2 | 1.16658303885594 | 0.0241985658238267 |
| KIRC | METAP1 | RPL35 | -1.06475238059392 | 2.72286325678163e-08 |
| BRCA | METAP1 | -1.85666700432586 | 2.87720383141203e-13 | |
| LUSC | METAP1 | -2.24754662802234 | 5.69044796414887e-09 | |
| LUAD | METAP1 | -2.8456821603014 | 8.2686862267444e-10 | |
| KIRP | METAP1 | RPL35 | -1.52981101975496 | 9.0546440333128e-05 |
| KIRP | METAP1 | 1.28164472282644 | 9.99853946268559e-05 |
| Protein-protein interactors with this translation factor (BIOGRID-3.4.160) |
| PPI interactors with METAP1 |
| SMAD9, HECW2, GH2, CBWD1, LPPR2, CBWD2, EXOC3, RBM42, ZMAT2, HNRNPU, NAA40, NPPA, TRIM25, G3BP1, DCPS, ATG16L1, NR2C2, ZRANB1, MEOX2, GLRX3, NBR1, PLEKHG4, INCA1, SYTL4, ESR1, IMMP2L, KIF14, NUPR1, SMAD4, IBSP, RSL1D1, ITIH3, MRPS12, TCL1A, BTF3L4, CCL3L1, BTF3, TEX19, |
Top |
|
| Clinically associated variants from ClinVar. |
| Gene | Chr | Position | RefSeq | VarSeq | RefSeeq | VarType | Pathogenic | Disease | VarInfo |
| METAP1 | chr4 | 99982441 | A | G | single_nucleotide_variant | Benign | not_provided | SO:0001819|synonymous_variant | SO:0001819|synonymous_variant |
| nsSNVs with sample frequency (size of circle) from TCGA 33 cancers. |
 |
| SNVs and Indels |
| Gene | Cancer type | Chromosome | Start | End | RefSeeq | MutSeq | Mutation type | AAchange | # samples |
| METAP1 | UCEC | chr4 | 99978957 | 99978957 | A | G | Missense_Mutation | p.M329V | 6 |
| METAP1 | LUAD | chr4 | 99982307 | 99982307 | G | A | Missense_Mutation | p.G334R | 6 |
| METAP1 | UCEC | chr4 | 99960603 | 99960603 | G | A | Missense_Mutation | p.R140Q | 4 |
| METAP1 | THYM | chr4 | 99978954 | 99978954 | C | T | Missense_Mutation | p.P328S | 3 |
| METAP1 | COAD | chr4 | 99969962 | 99969962 | G | A | Missense_Mutation | p.R289Q | 3 |
| METAP1 | ESCA | chr4 | 99960579 | 99960579 | C | T | Missense_Mutation | p.S132L | 3 |
| METAP1 | PAAD | chr4 | 99969935 | 99969935 | C | T | Missense_Mutation | p.A280V | 3 |
| METAP1 | PAAD | chr4 | 99982458 | 99982458 | C | T | Missense_Mutation | p.S384F | 3 |
| METAP1 | STAD | chr4 | 99960602 | 99960602 | C | T | Nonsense_Mutation | p.R140* | 2 |
| METAP1 | LUAD | chr4 | 99960598 | 99960598 | G | A | Silent | p.G138G | 2 |
| METAP1 | UCEC | chr4 | 99970013 | 99970013 | T | C | Missense_Mutation | p.V306A | 2 |
| METAP1 | LUAD | chr4 | 99962203 | 99962203 | G | A | Missense_Mutation | p.E148K | 2 |
| METAP1 | BLCA | chr4 | 99982412 | 99982412 | G | C | Missense_Mutation | p.E369Q | 2 |
| METAP1 | HNSC | chr4 | 99982433 | 99982433 | G | C | Missense_Mutation | p.D376H | 2 |
| METAP1 | BRCA | chr4 | 99966365 | 99966365 | G | T | Missense_Mutation | p.D231Y | 2 |
| METAP1 | LIHC | chr4 | 99955478 | 99955478 | A | G | Silent | 2 | |
| METAP1 | UCEC | chr4 | 99916939 | 99916939 | A | G | Missense_Mutation | p.D12G | 2 |
| METAP1 | PAAD | chr4 | 99982458 | 99982458 | C | T | Missense_Mutation | 2 | |
| METAP1 | UCEC | chr4 | 99962203 | 99962203 | G | T | Nonsense_Mutation | p.E148* | 2 |
| METAP1 | PAAD | chr4 | 99969935 | 99969935 | C | T | Missense_Mutation | 2 | |
| METAP1 | UCEC | chr4 | 99962265 | 99962265 | C | T | Silent | p.H168 | 2 |
| METAP1 | ESCA | chr4 | 99960579 | 99960579 | C | T | Missense_Mutation | 2 | |
| METAP1 | STAD | chr4 | 99960602 | 99960602 | C | T | Nonsense_Mutation | p.R140X | 2 |
| METAP1 | UCEC | chr4 | 99966411 | 99966411 | G | A | Missense_Mutation | p.R246Q | 2 |
| METAP1 | STAD | chr4 | 99962266 | 99962266 | G | A | Missense_Mutation | p.A169T | 2 |
| METAP1 | UCEC | chr4 | 99969981 | 99969981 | A | C | Silent | p.G295 | 2 |
| METAP1 | BLCA | chr4 | 99960563 | 99960563 | C | G | Missense_Mutation | 1 | |
| METAP1 | SARC | chr4 | 99955406 | 99955406 | G | T | Silent | 1 | |
| METAP1 | GBM | chr4 | 99960603 | 99960603 | G | A | Missense_Mutation | 1 | |
| METAP1 | BLCA | chr4 | 99982412 | 99982412 | G | C | Missense_Mutation | 1 | |
| METAP1 | SARC | chr4 | 99916908 | 99916908 | G | T | Missense_Mutation | 1 | |
| METAP1 | STAD | chr4 | 99969899 | 99969899 | G | A | Missense_Mutation | p.R268Q | 1 |
| METAP1 | HNSC | chr4 | 99982433 | 99982433 | G | C | Missense_Mutation | 1 | |
| METAP1 | BLCA | chr4 | 99960563 | 99960563 | C | G | Missense_Mutation | p.Q127E | 1 |
| METAP1 | SARC | chr4 | 99969975 | 99969975 | G | T | Silent | 1 | |
| METAP1 | HNSC | chr4 | 99982424 | 99982424 | C | A | Silent | 1 | |
| METAP1 | LUAD | chr4 | 99960603 | 99960603 | G | C | Missense_Mutation | p.R140P | 1 |
| METAP1 | SARC | chr4 | 99964539 | 99964539 | G | T | Splice_Site | 1 | |
| METAP1 | LUSC | chr4 | 99982392 | 99982392 | T | G | Missense_Mutation | p.L362R | 1 |
| METAP1 | SARC | chr4 | 99955406 | 99955406 | G | T | Silent | p.V64V | 1 |
| METAP1 | KIRC | chr4 | 99955422 | 99955422 | G | T | Nonsense_Mutation | p.E70X | 1 |
| METAP1 | UCEC | chr4 | 99966380 | 99966380 | T | - | Frame_Shift_Del | p.F236fs | 1 |
| METAP1 | LUSC | chr4 | 99960601 | 99960601 | G | A | Missense_Mutation | p.M139I | 1 |
| METAP1 | CHOL | chr4 | 99916973 | 99916973 | C | A | Silent | p.P23P | 1 |
| METAP1 | SKCM | chr4 | 99969899 | 99969899 | G | T | Missense_Mutation | p.R268L | 1 |
| METAP1 | MESO | chr4 | 99955477 | 99955477 | G | T | Missense_Mutation | p.R88I | 1 |
| METAP1 | COAD | chr4 | 99964420 | 99964420 | C | T | Silent | p.C179C | 1 |
| METAP1 | SKCM | chr4 | 99969997 | 99969997 | C | T | Missense_Mutation | p.H301Y | 1 |
| METAP1 | LIHC | chr4 | 99960538 | 99960538 | T | C | Silent | 1 | |
| METAP1 | SKCM | chr4 | 99962231 | 99962231 | T | A | Missense_Mutation | p.I157N | 1 |
| METAP1 | LIHC | chr4 | 99982389 | 99982389 | T | C | Missense_Mutation | 1 | |
| METAP1 | SKCM | chr4 | 99966337 | 99966337 | C | T | Silent | p.I221I | 1 |
| METAP1 | LIHC | chr4 | 99966340 | 99966340 | T | C | Silent | 1 | |
| METAP1 | LIHC | chr4 | 99960538 | 99960538 | T | C | Silent | p.S118S | 1 |
| METAP1 | ESCA | chr4 | 99982442 | 99982442 | C | T | Missense_Mutation | p.R379W | 1 |
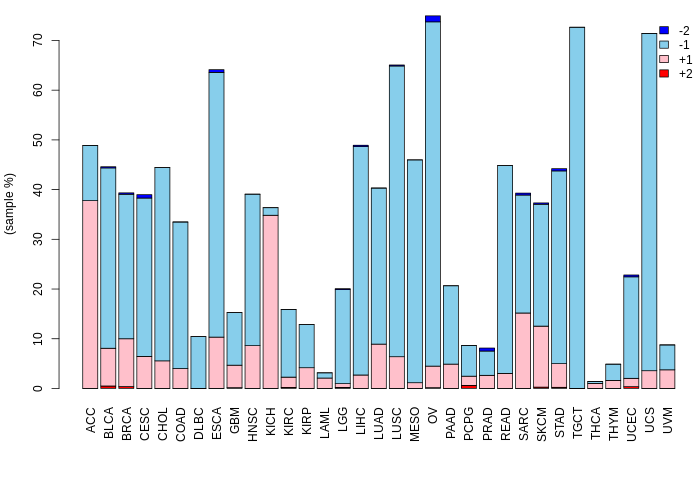
| Copy number variation (CNV) of METAP1 * Click on the image to open the original image in a new window. |
 |
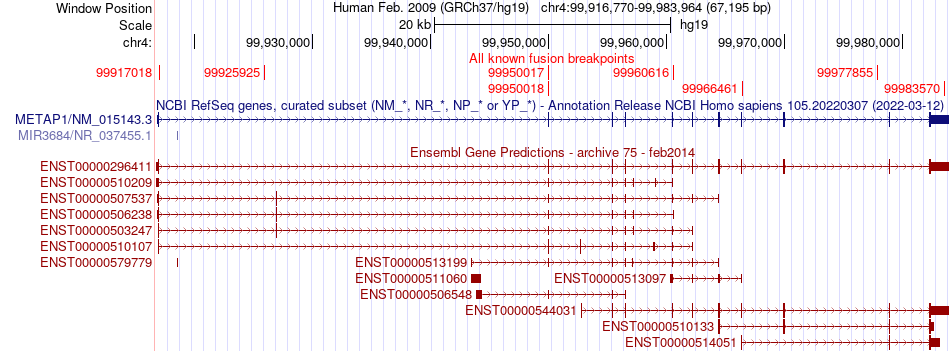
| Fusion gene breakpoints (product of the structural variants (SVs)) across METAP1 * Click on the image to open the UCSC genome browser with custom track showing this image in a new window. |
 |
| Fusion genes with this translation factor from FusionGDB2.0. |
| FusionGDB2 ID | Disease | Sample | Hgene | Hchr | Hbp | Hstrand | Tgene | Tchr | Tbp | Tstrand |
| 94776 | N/A | EC564045 | DLGAP1 | chr18 | 3591669 | - | METAP1 | chr4 | 99977855 | - |
| 53010 | BRCA | TCGA-E2-A1IL-01A | METAP1 | chr4 | 99917018 | + | EIF4E | chr4 | 99823133 | - |
| 99140 | STAD | TCGA-EQ-A4SO-01A | METAP1 | chr4 | 99966461 | + | IQGAP1 | chr15 | 91030186 | + |
| 97630 | N/A | BM149877 | METAP1 | chr4 | 99960616 | + | NDUFA12 | chr12 | 95367548 | - |
| 94776 | N/A | AW352239 | PERP | chr6 | 138412275 | + | METAP1 | chr4 | 99983570 | - |
| 94776 | STAD | TCGA-BR-4292 | PPP3CA | chr4 | 102267895 | - | METAP1 | chr4 | 99950017 | + |
| 94779 | STAD | TCGA-BR-8678-01A | TSPAN5 | chr4 | 99579297 | - | METAP1 | chr4 | 99950018 | + |
Top |
|
| Kaplan-Meier plots with logrank tests of overall survival (OS) |
 |
| Cancer type | Translation factor | Coefficent | Hazard ratio | Wald test pval | Likelihool ratio pval | Logrank test pval | # samples |
Top |
|
| Differential gene expression between female and male. (Wilcoxon test, pval<0.05) |
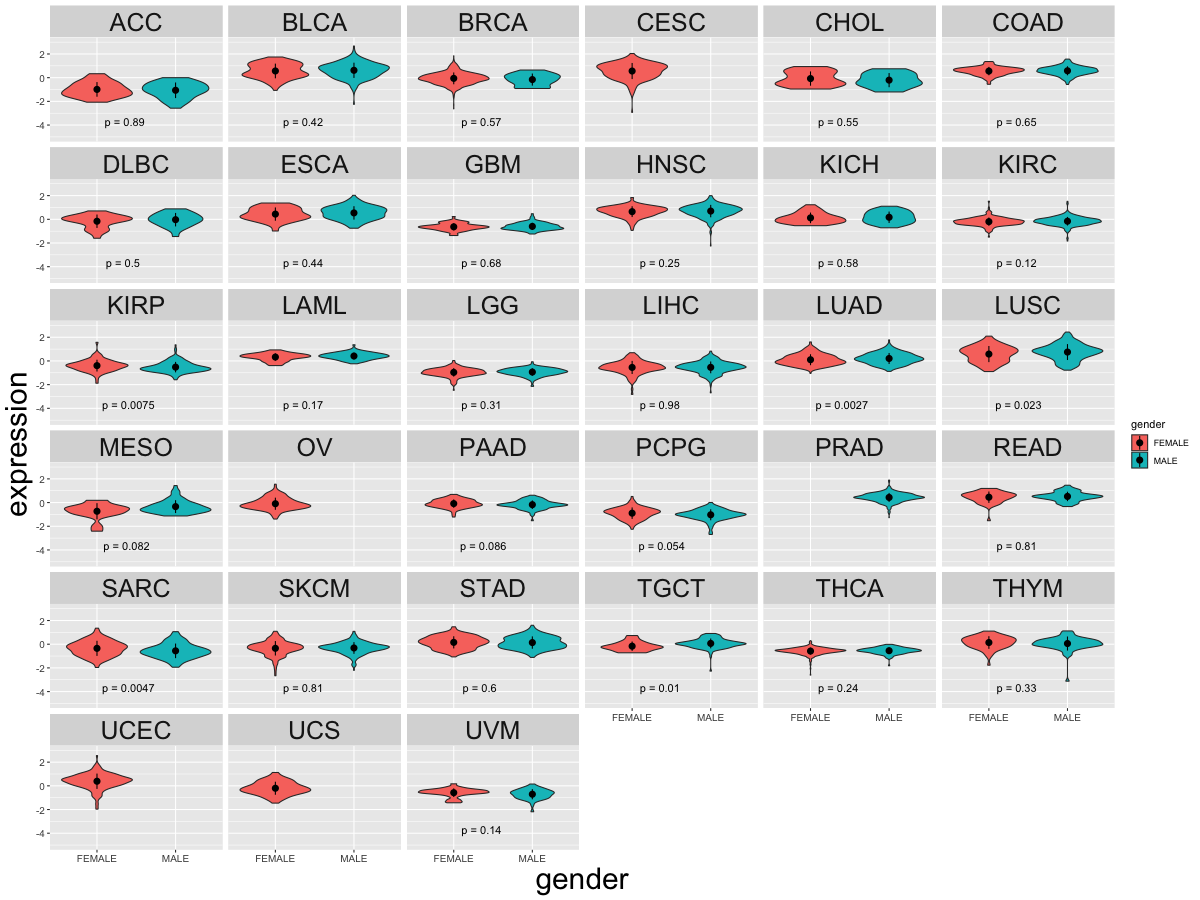 |
| Cancer type | Translation factor | pval | adj.p |
| LUAD | METAP1 | 0.00271553314816925 | 0.076 |
| SARC | METAP1 | 0.00472706526477322 | 0.13 |
| KIRP | METAP1 | 0.00753867458914122 | 0.2 |
| TGCT | METAP1 | 0.0103177921580079 | 0.26 |
| LUSC | METAP1 | 0.022572527290621 | 0.54 |
Top |
|
| Differential gene expression between young and old age groups (Wilcoxon test, pval<0.05) |
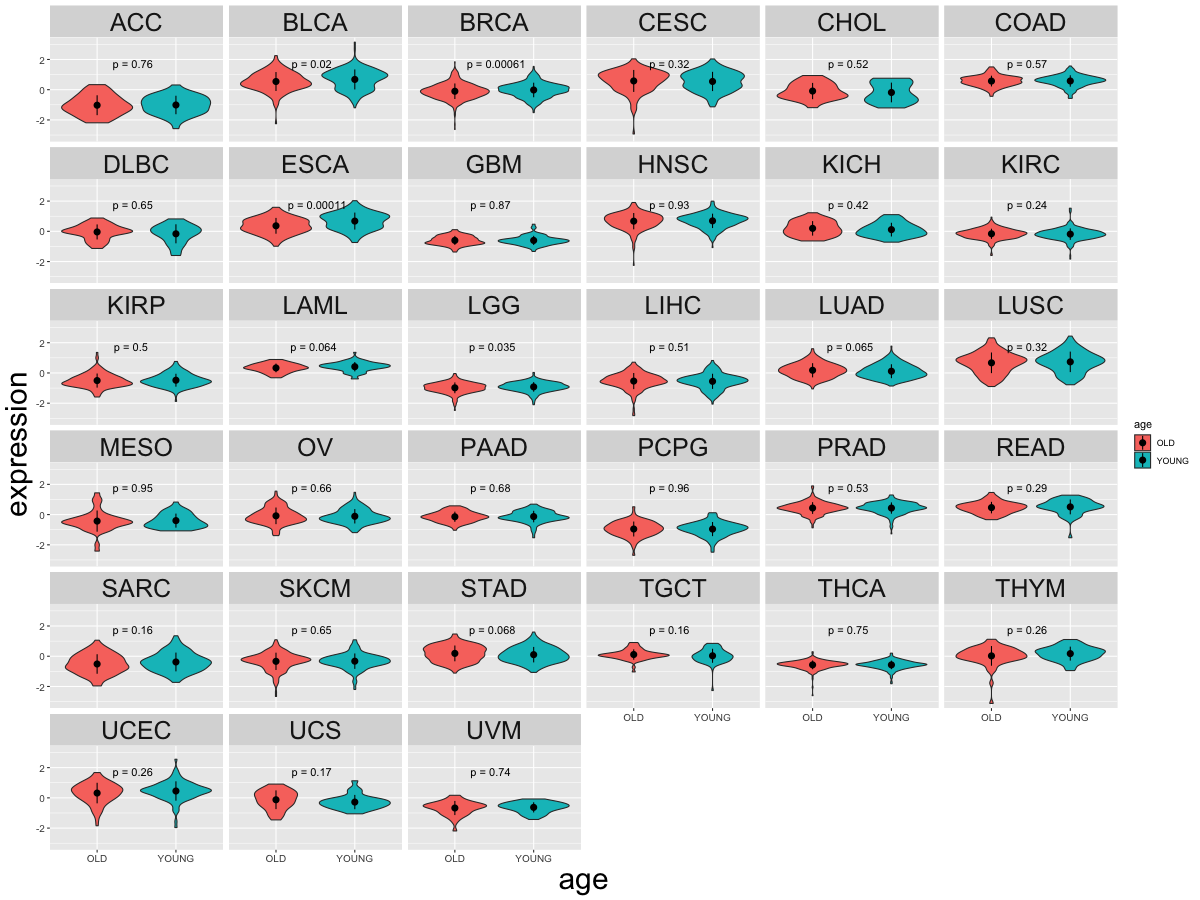 |
| Cancer type | Translation factor | pval | adj.p |
| LGG | METAP1 | 0.0353192950860136 | 1 |
| BRCA | METAP1 | 0.000610443685790466 | 0.02 |
| ESCA | METAP1 | 0.000105342081678447 | 0.0035 |
| BLCA | METAP1 | 0.0197360294170479 | 0.61 |
Top |
|
| Drugs targeting genes involved in this translation factor. (DrugBank Version 5.1.8 2021-05-08) |
| UniProtAcc | DrugBank ID | Drug name | Drug activity | Drug type | Drug status |
| P53582 | DB04324 | Ovalicin | Small molecule | Experimental | |
| P53582 | DB07901 | 5-CHLORO-6-METHYL-N-(2-PHENYLETHYL)-2-PYRIDIN-2-YLPYRIMIDIN-4-AMINE | Small molecule | Experimental | |
| P53582 | DB07902 | TERT-BUTYL {2-[(1,3-THIAZOL-2-YLAMINO)CARBONYL]PYRIDIN-3-YL}CARBAMATE | Small molecule | Experimental | |
| P53582 | DB07903 | 3-[(2,2-DIMETHYLPROPANOYL)AMINO]-N-1,3-THIAZOL-2-YLPYRIDINE-2-CARBOXAMIDE | Small molecule | Experimental | |
| P53582 | DB04324 | Ovalicin | |||
| P53582 | DB07901 | 5-CHLORO-6-METHYL-N-(2-PHENYLETHYL)-2-PYRIDIN-2-YLPYRIMIDIN-4-AMINE | |||
| P53582 | DB07902 | TERT-BUTYL {2-[(1,3-THIAZOL-2-YLAMINO)CARBONYL]PYRIDIN-3-YL}CARBAMATE | |||
| P53582 | DB07903 | 3-[(2,2-DIMETHYLPROPANOYL)AMINO]-N-1,3-THIAZOL-2-YLPYRIDINE-2-CARBOXAMIDE |
Top |
|
| Diseases associated with this translation factor. (DisGeNet 4.0) |
| Disease ID | Disease Name | # PubMeds | Disease source |
(UTHealth)
Web File Viewing | Emergency Information |Campus Carry|Site Policies