
|
||||||
|

Translation Factor: PMPCA (NCBI Gene ID:23203) |
|
 Gene Summary Gene Summary |
| Gene Information | Gene Name: PMPCA | Gene ID: 23203 | Gene Symbol | PMPCA | Gene ID | 23203 |
| Gene Name | peptidase, mitochondrial processing subunit alpha | |
| Synonyms | Alpha-MPP|CLA1|CPD3|INPP5E|P-55|SCAR2 | |
| Cytomap | 9q34.3 | |
| Type of Gene | protein-coding | |
| Description | mitochondrial-processing peptidase subunit alphaCerebellar ataxia-1cerebellar ataxia 1 (autosomal recessive)inositol polyphosphate-5-phosphatase, 72 kDmitochondrial matrix processing protease, alpha subunitpeptidase, mitochondrial processing alpha su | |
| Modification date | 20200313 | |
| UniProtAcc | . | |
| Child GO biological process term(s) under GO:0006412 |
| GO ID | GO term |
| Gene ontology of translaction factor with evidence of Inferred from Direct Assay (IDA) from Entrez |
| Partner | Gene | GO ID | GO term | PubMed ID |
| Hgene | PMPCA | GO:0006627 | protein processing involved in protein targeting to mitochondrion | 22354088 |
| Inferred gene age of translation factor. |
| Gene | Inferred gene age group among (0 - 67.6], (67.6 - 355.7], (355.7 - 733], (733 - 1119.25], >1119.25 |
Top |
|
| We searched PubMed using 'PMPCA[title] AND translation [title] AND human.' |
| Gene | Title | PMID |
Top |
|
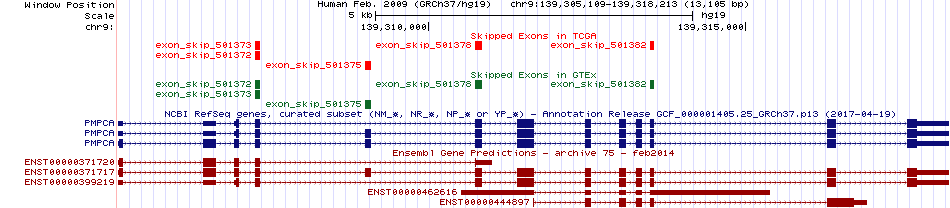
| Skipped exons in TCGA and GTEx based on Ensembl gene isoform structure. * Click on the image to open the UCSC genome browser with custom track showing this image in a new window. For more annotations, please visit our ExonSkipDB. |
 |
| Open reading frame (ORF) analsis of exon skipping events based on Ensembl gene isoform structure. * Click on the break point to see the gene structure around the break point region using the UCSC Genome Browser. |
| ENST | Exon skip start (DNA) | Exon Skip end (DNA) | ORF |
| Exon skipping position in the amino acid sequence. |
| ENST | Exon skip start (DNA) | Exon Skip end (DNA) | Len(transcript seq) | Exon skip start (mRNA) | Exon Skip end (mRNA) | Len(amino acid seq) | Exon skip start (AA) | Exon Skip end (AA) |
| Potentially (partially) lost protein functional features of UniProt. |
| UniProtAcc | Exon skip start (AA) | Exon Skip end (AA) | Function feature start (AA) | Function feature end (AA) | Functional feature type | Functional feature desc. |
Top |
|
| Gene expression level across TCGA pancancer |
| Gene expression level across GTEx pantissue |
| Expression level of gene isoforms across TCGA pancancer |
| Expression level of gene isoforms across GTEx pantissue |
| Cancer(tissue) type-specific expression level of Translation factor using z-score distriution |
| Differential expression between tumor and matched normal (in the cancer types with more than 10 matched samples) |
| Cancer type | Translation factor | FC | adj.pval |
| KICH | PMPCA | 1.0545904606655 | 0.0341737866401672 |
| LIHC | PMPCA | -1.20682140710259 | 2.17397650760512e-07 |
| KIRC | PMPCA | 1.61448859833474 | 4.53616147614095e-08 |
| THCA | PMPCA | -1.77080638784763 | 5.30105418377939e-05 |
| LUSC | PMPCA | -1.39510660145718 | 8.418272520152e-05 |
Top |
|
| Translation factor expression regulation through miRNA binding |
| Cancer type | Gene | miRNA | TargetScan binding score (Context++ score percentile) | Coefficient | Pvalue |
| Translation factor expression regulation through methylation in the promoter of Translation factor |
| Cancer type | Gene | methyl group b | methyl group a | DEG pval | avg methyl in b | avg methyl in a | avg exp in b | avg exp in a |
| Translation factor expression regulation through methylation in the gene body of Translation factor (positive regulation) |
| Cancer type | Gene | methyl group b | methyl group a | DEG pval | avg methyl in b | avg methyl in a | avg exp in b | avg exp in a |
| Translation factor expression regulation through copy number variation of Translation factor |
| Cancer type | Gene | Coefficient | Pvalue |
Top |
|
| Strongly correlated genes belong to cellular important gene groups with PMPCA (coefficient>0.8, pval<0.05, node color based on FC between tumor and matched normal). Significantly associated important genes in the individual cancer types. * Cell metabolism gene: cell metabolism genes from REACTOME (black edge), IUPHAR: drug target genes from IUPHAR (blue edge), Kinase: human kinase genes (brown edge), CGC: cancer gene census genes (orange edge), TSG: tumor suppresor genes (purple edge), Epifactor: epigenetic factors (light blue edge), TF: transcription factors (green) |
| Cancer type | Gene group | Translation factor | Correlated gene | Coefficient | Pvalue |
Top |
|
| Protein 3D structure Visit iCn3D. |
Top |
|
| Protein-protein interaction networks * Overlap between up-regulated DEGs (log2FC<-1 and adj.P<0.05) and STRING PPI network (center: Translation factor, node: DEGs, edges: weighted by -log2(adj.P)) |
| Overlap between down-regulated DEGs (log2FC>1 and adj.P<0.05) and STRING PPI network (center: Translation factor, node: DEGs, edges: weighted by -log2(adj.P)) |
 * Edge colors based on TCGA cancer types. |
| * Overlap between DEGs (log2FC>1 and adj.P<0.05) and STRING PPI network per cancer (center: Translation factor, node: DEGs, node color: log2FC, edges: weighted by -log2(adj.P)) |
| Cancer type | Translation factor | Interacting protein coding gene | FC | adj.pval |
| Protein-protein interactors with this translation factor (BIOGRID-3.4.160) |
| PPI interactors with PMPCA |
Top |
|
| Clinically associated variants from ClinVar. |
| Gene | Chr | Position | RefSeq | VarSeq | RefSeeq | VarType | Pathogenic | Disease | VarInfo |
| nsSNVs with sample frequency (size of circle) from TCGA 33 cancers. |
| SNVs and Indels |
| Gene | Cancer type | Chromosome | Start | End | RefSeeq | MutSeq | Mutation type | AAchange | # samples |
| Copy number variation (CNV) of PMPCA * Click on the image to open the original image in a new window. |
 |
| Fusion gene breakpoints (product of the structural variants (SVs)) across PMPCA * Click on the image to open the UCSC genome browser with custom track showing this image in a new window. |
 |
| Fusion genes with this translation factor from FusionGDB2.0. |
| FusionGDB2 ID | Disease | Sample | Hgene | Hchr | Hbp | Hstrand | Tgene | Tchr | Tbp | Tstrand |
| 82159 | COAD | TCGA-A6-6780 | CCDC47 | chr17 | 61843271 | - | PMPCA | chr9 | 139311402 | + |
| 82159 | STAD | TCGA-CD-8530-01A | CNPY2 | chr12 | 56708635 | - | PMPCA | chr9 | 139311403 | + |
| 82159 | HNSC | TCGA-DQ-7589-01A | HAUS6 | chr9 | 19094315 | - | PMPCA | chr9 | 139306942 | + |
| 82159 | N/A | BE937971 | MAPK3 | chr16 | 30129814 | - | PMPCA | chr9 | 139316289 | + |
| 87413 | N/A | M78956 | PMPCA | chr9 | 139317962 | - | GATAD2A | chr19 | 19619740 | - |
| 92529 | N/A | BF742244 | PMPCA | chr9 | 139317869 | - | RILPL1 | chr12 | 124008060 | - |
| 82159 | STAD | TCGA-R5-A7ZF-01A | PPP2CA | chr5 | 133561451 | - | PMPCA | chr9 | 139316284 | + |
| 82159 | N/A | BF155162 | RILPL1 | chr12 | 123984535 | + | PMPCA | chr9 | 139317869 | + |
| 82161 | STAD | TCGA-R5-A7ZF-01A | SKP1 | chr5 | 133561451 | - | PMPCA | chr9 | 139316284 | + |
Top |
|
| Kaplan-Meier plots with logrank tests of overall survival (OS) |
| Cancer type | Translation factor | Coefficent | Hazard ratio | Wald test pval | Likelihool ratio pval | Logrank test pval | # samples |
Top |
|
| Differential gene expression between female and male. (Wilcoxon test, pval<0.05) |
| Cancer type | Translation factor | pval | adj.p |
Top |
|
| Differential gene expression between young and old age groups (Wilcoxon test, pval<0.05) |
| Cancer type | Translation factor | pval | adj.p |
Top |
|
| Drugs targeting genes involved in this translation factor. (DrugBank Version 5.1.8 2021-05-08) |
| UniProtAcc | DrugBank ID | Drug name | Drug activity | Drug type | Drug status |
Top |
|
| Diseases associated with this translation factor. (DisGeNet 4.0) |
| Disease ID | Disease Name | # PubMeds | Disease source |
(UTHealth)
Web File Viewing | Emergency Information |Campus Carry|Site Policies