
|
||||||
|

Translation Factor: CNOT7 (NCBI Gene ID:29883) |
|
 Gene Summary Gene Summary |
| Gene Information | Gene Name: CNOT7 | Gene ID: 29883 | Gene Symbol | CNOT7 | Gene ID | 29883 |
| Gene Name | CCR4-NOT transcription complex subunit 7 | |
| Synonyms | CAF-1|CAF1|Caf1a|hCAF-1 | |
| Cytomap | 8p22 | |
| Type of Gene | protein-coding | |
| Description | CCR4-NOT transcription complex subunit 7BTG1-binding factor 1CCR4-associated factor 1carbon catabolite repressor protein (CCR4)-associative factor 1 | |
| Modification date | 20200313 | |
| UniProtAcc | Q9UIV1 | |
| Child GO biological process term(s) under GO:0006412 |
| GO ID | GO term |
| GO:0017148 | Negative regulation of translation |
| GO:0006417 | Regulation of translation |
| GO:0006412 | Translation |
| Gene ontology of translaction factor with evidence of Inferred from Direct Assay (IDA) from Entrez |
| Partner | Gene | GO ID | GO term | PubMed ID |
| Hgene | CNOT7 | GO:0008285 | negative regulation of cell proliferation | 19276069 |
| Hgene | CNOT7 | GO:0043928 | exonucleolytic nuclear-transcribed mRNA catabolic process involved in deadenylation-dependent decay | 20065043|21336257 |
| Inferred gene age of translation factor. |
| Gene | Inferred gene age group among (0 - 67.6], (67.6 - 355.7], (355.7 - 733], (733 - 1119.25], >1119.25 |
| CNOT7 | (67.6 - 355.7] |
Top |
|
| We searched PubMed using 'CNOT7[title] AND translation [title] AND human.' |
| Gene | Title | PMID |
| CNOT7 | . | . |
Top |
|
| Skipped exons in TCGA and GTEx based on Ensembl gene isoform structure. * Click on the image to open the UCSC genome browser with custom track showing this image in a new window. For more annotations, please visit our ExonSkipDB. |
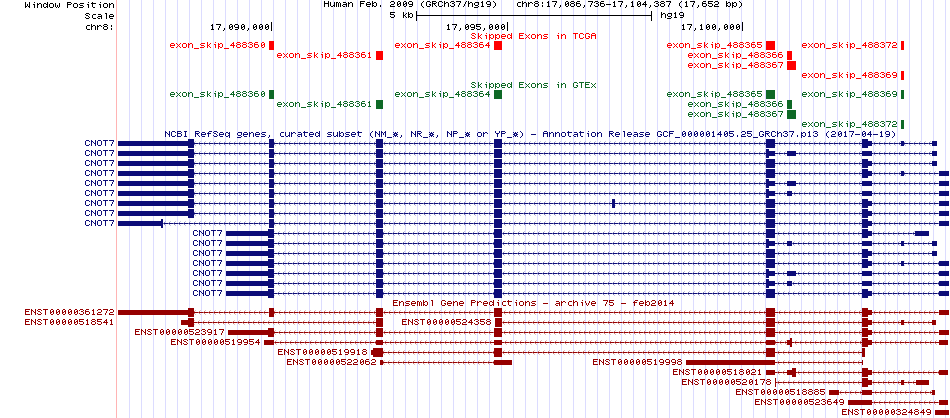 |
| Open reading frame (ORF) analsis of exon skipping events based on Ensembl gene isoform structure. * Click on the break point to see the gene structure around the break point region using the UCSC Genome Browser. |
| ENST | Exon skip start (DNA) | Exon Skip end (DNA) | ORF |
| ENST00000361272 | 17089935 | 17090046 | In-frame |
| ENST00000361272 | 17092224 | 17092369 | Frame-shift |
| ENST00000361272 | 17094720 | 17094882 | In-frame |
| ENST00000361272 | 17100500 | 17100694 | Frame-shift |
| Exon skipping position in the amino acid sequence. |
| ENST | Exon skip start (DNA) | Exon Skip end (DNA) | Len(transcript seq) | Exon skip start (mRNA) | Exon Skip end (mRNA) | Len(amino acid seq) | Exon skip start (AA) | Exon Skip end (AA) |
| ENST00000361272 | 17089935 | 17090046 | 2666 | 918 | 1028 | 285 | 206 | 243 |
| ENST00000361272 | 17094720 | 17094882 | 2666 | 611 | 772 | 285 | 104 | 157 |
| Potentially (partially) lost protein functional features of UniProt. |
| UniProtAcc | Exon skip start (AA) | Exon Skip end (AA) | Function feature start (AA) | Function feature end (AA) | Functional feature type | Functional feature desc. |
| Q9UIV1 | 206 | 243 | 1 | 285 | Chain | ID=PRO_0000212844;Note=CCR4-NOT transcription complex subunit 7 |
| Q9UIV1 | 104 | 157 | 1 | 285 | Chain | ID=PRO_0000212844;Note=CCR4-NOT transcription complex subunit 7 |
| Q9UIV1 | 206 | 243 | 230 | 230 | Metal binding | Note=Divalent metal cation 2%3B catalytic;Ontology_term=ECO:0000305;evidence=ECO:0000305 |
| Q9UIV1 | 104 | 157 | 138 | 138 | Mutagenesis | Note=Abolishes interaction with CNOT1%3B when associated with Y-142 and K-149. E->K;Ontology_term=ECO:0000269;evidence=ECO:0000269|PubMed:22977175;Dbxref=PMID:22977175 |
| Q9UIV1 | 104 | 157 | 141 | 141 | Mutagenesis | Note=Abolishes interaction with CNOT1. M->R;Ontology_term=ECO:0000269;evidence=ECO:0000269|PubMed:22977175;Dbxref=PMID:22977175 |
| Q9UIV1 | 104 | 157 | 142 | 142 | Mutagenesis | Note=Abolishes interaction with CNOT1%3B when associated with K-138 and K-149. T->Y;Ontology_term=ECO:0000269;evidence=ECO:0000269|PubMed:22977175;Dbxref=PMID:22977175 |
| Q9UIV1 | 104 | 157 | 149 | 149 | Mutagenesis | Note=Abolishes interaction with CNOT1%3B when associated with K-138 and Y-142. E->K;Ontology_term=ECO:0000269;evidence=ECO:0000269|PubMed:22977175;Dbxref=PMID:22977175 |
| Q9UIV1 | 206 | 243 | 225 | 225 | Mutagenesis | Note=Abolishes RNA deadenylase activity. H->A;Ontology_term=ECO:0000269;evidence=ECO:0000269|PubMed:19276069;Dbxref=PMID:19276069 |
| Q9UIV1 | 206 | 243 | 230 | 230 | Mutagenesis | Note=Abolishes RNA deadenylase activity. D->N;Ontology_term=ECO:0000269;evidence=ECO:0000269|PubMed:19276069;Dbxref=PMID:19276069 |
| Q9UIV1 | 206 | 243 | 241 | 241 | Sequence conflict | Note=M->V;Ontology_term=ECO:0000305;evidence=ECO:0000305 |
| Q9UIV1 | 104 | 157 | 103 | 105 | Turn | Ontology_term=ECO:0000244;evidence=ECO:0000244|PDB:2D5R |
| Q9UIV1 | 104 | 157 | 110 | 119 | Helix | Ontology_term=ECO:0000244;evidence=ECO:0000244|PDB:2D5R |
| Q9UIV1 | 104 | 157 | 123 | 129 | Helix | Ontology_term=ECO:0000244;evidence=ECO:0000244|PDB:2D5R |
| Q9UIV1 | 104 | 157 | 133 | 141 | Helix | Ontology_term=ECO:0000244;evidence=ECO:0000244|PDB:2D5R |
| Q9UIV1 | 104 | 157 | 142 | 144 | Turn | Ontology_term=ECO:0000244;evidence=ECO:0000244|PDB:2D5R |
| Q9UIV1 | 104 | 157 | 145 | 150 | Beta strand | Ontology_term=ECO:0000244;evidence=ECO:0000244|PDB:2D5R |
| Q9UIV1 | 104 | 157 | 152 | 157 | Beta strand | Ontology_term=ECO:0000244;evidence=ECO:0000244|PDB:2D5R |
| Q9UIV1 | 206 | 243 | 209 | 216 | Helix | Ontology_term=ECO:0000244;evidence=ECO:0000244|PDB:2D5R |
| Q9UIV1 | 206 | 243 | 227 | 244 | Helix | Ontology_term=ECO:0000244;evidence=ECO:0000244|PDB:2D5R |
Top |
|
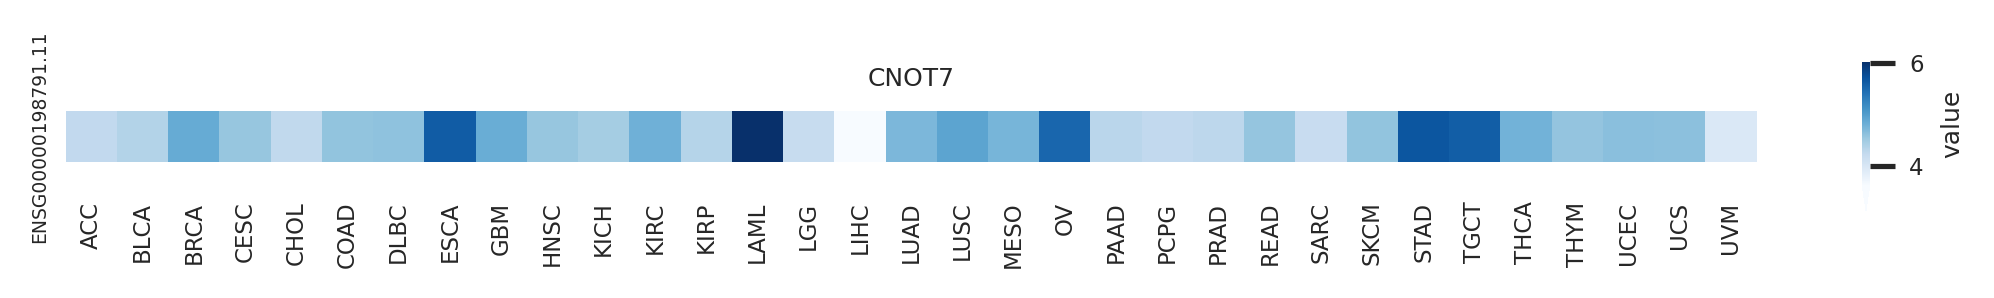
| Gene expression level across TCGA pancancer |
 |
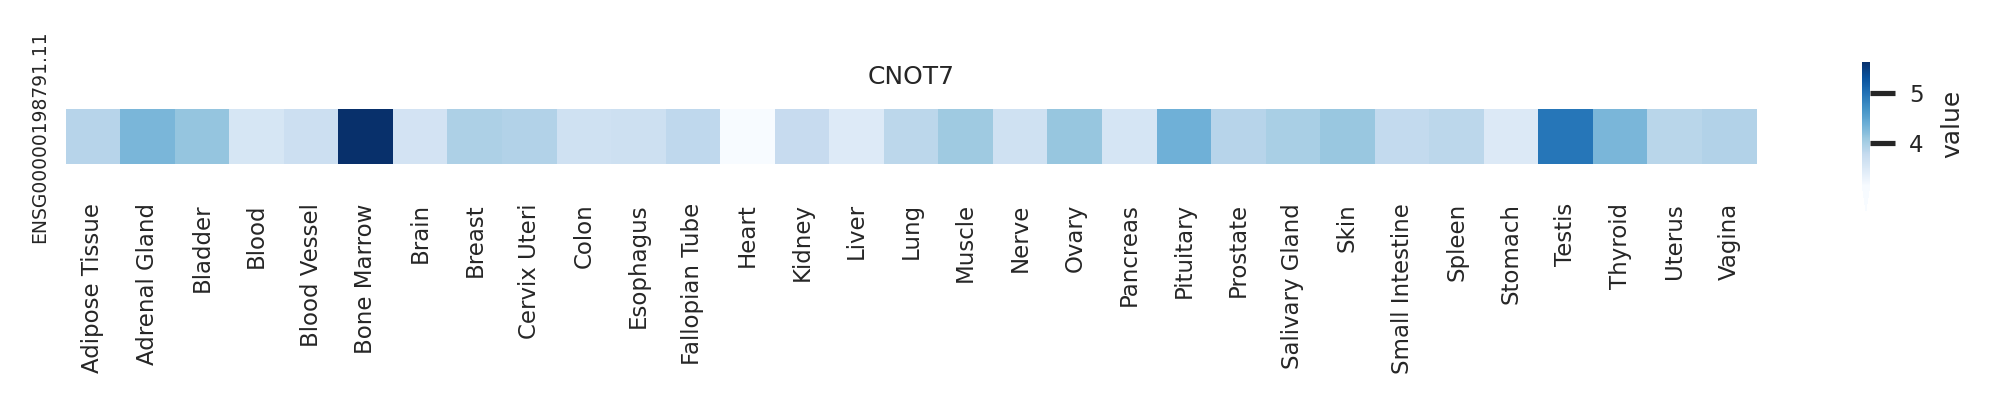
| Gene expression level across GTEx pantissue |
 |
| Expression level of gene isoforms across TCGA pancancer |
 |
| Expression level of gene isoforms across GTEx pantissue |
 |
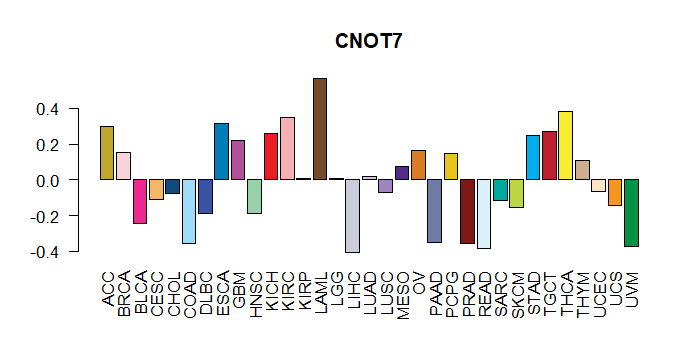
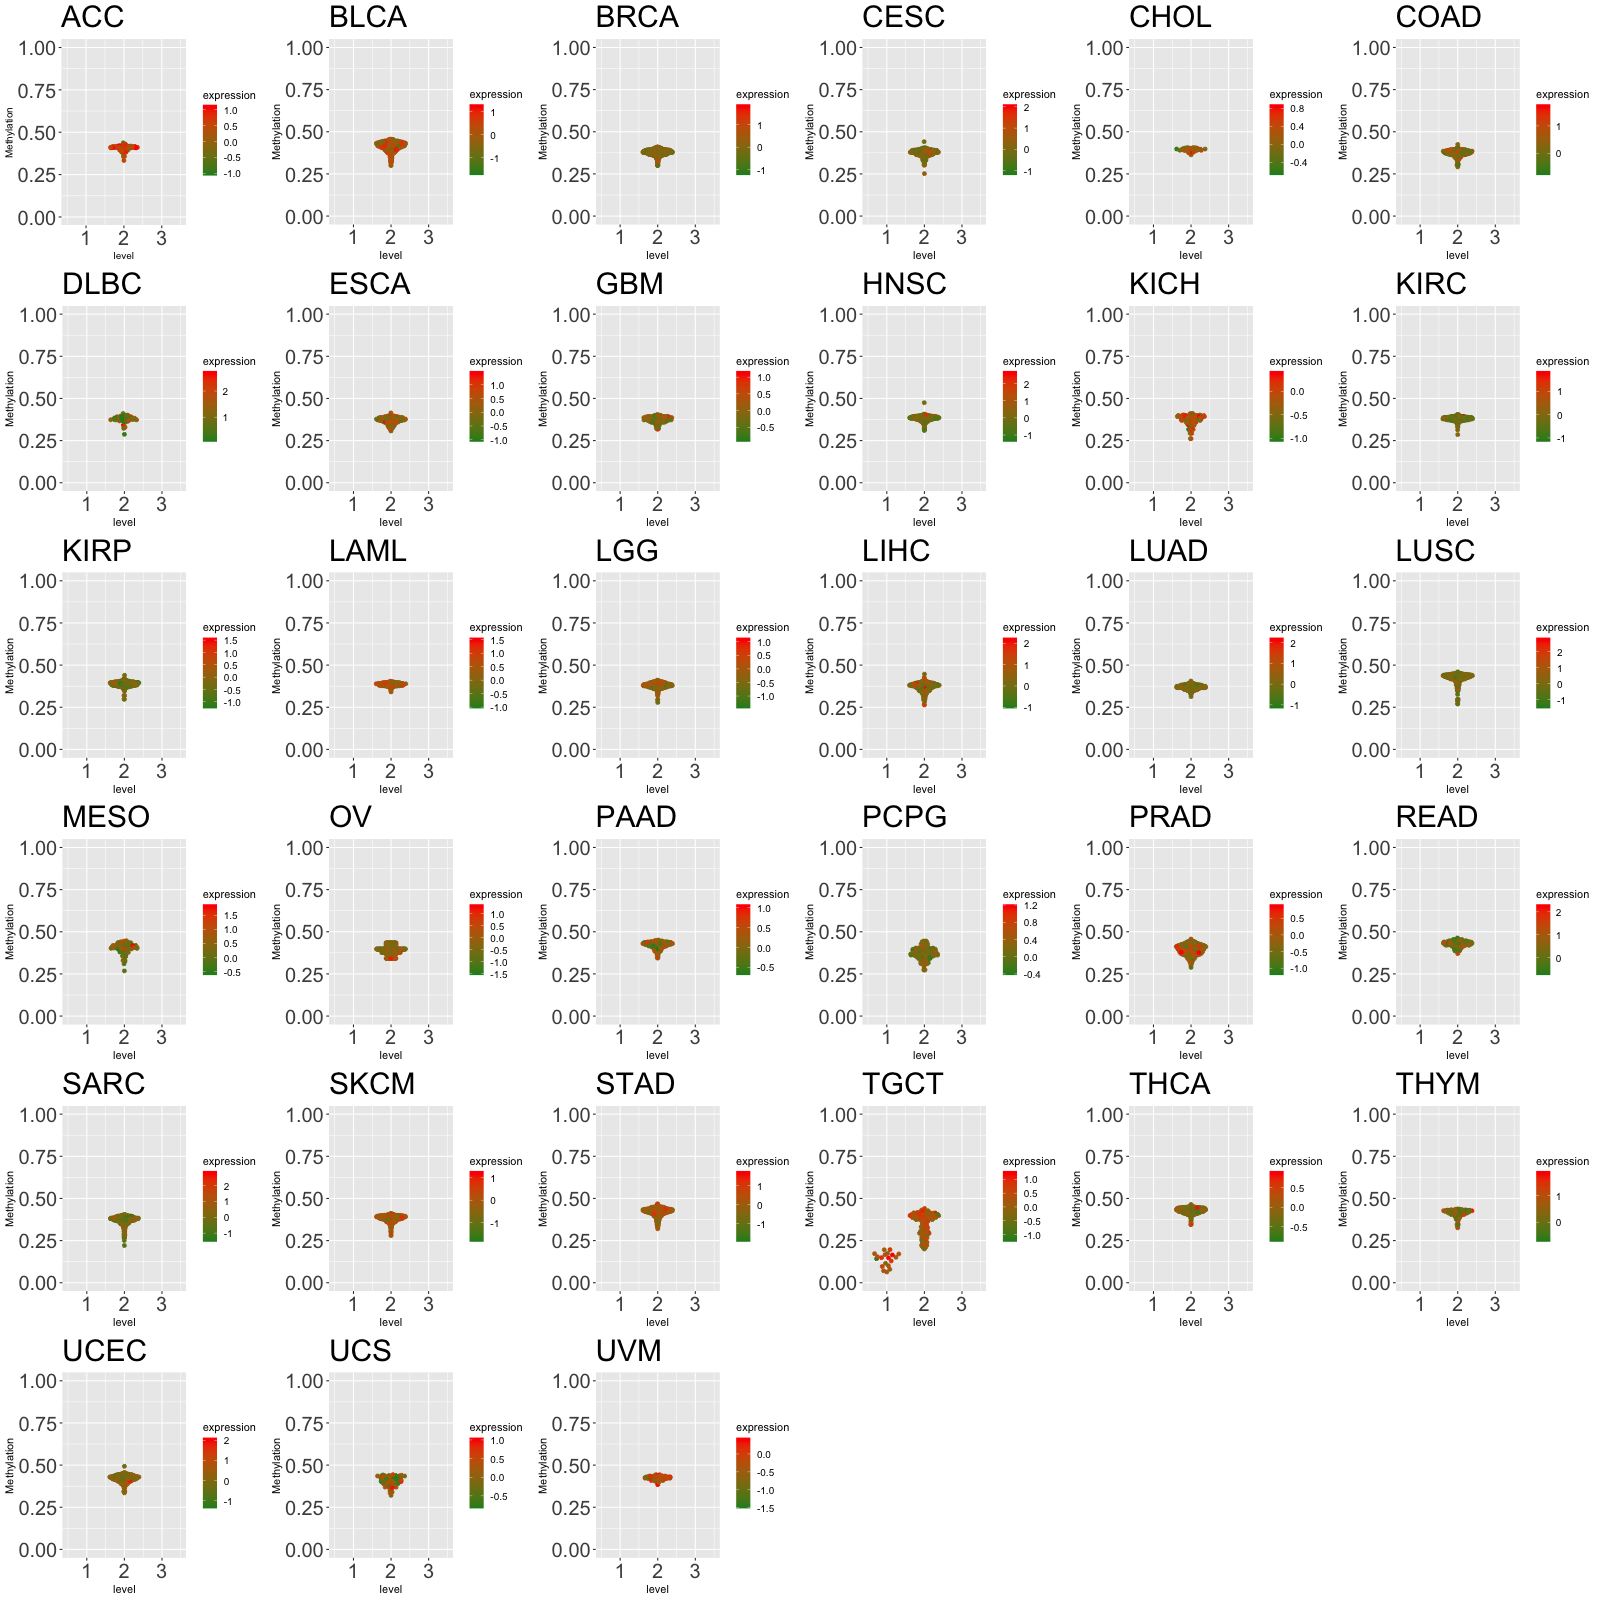
| Cancer(tissue) type-specific expression level of Translation factor using z-score distriution |
 |
| Differential expression between tumor and matched normal (in the cancer types with more than 10 matched samples) |
 |
| Cancer type | Translation factor | FC | adj.pval |
| THCA | CNOT7 | -1.0100272557073 | 2.28966131184287e-07 |
Top |
|
| Translation factor expression regulation through miRNA binding |
| Cancer type | Gene | miRNA | TargetScan binding score (Context++ score percentile) | Coefficient | Pvalue |
| UCEC | CNOT7 | hsa-miR-381-3p | 98 | 0.387624140565317 | 0.0242104146698383 |
| Translation factor expression regulation through methylation in the promoter of Translation factor |
 |
| Cancer type | Gene | methyl group b | methyl group a | DEG pval | avg methyl in b | avg methyl in a | avg exp in b | avg exp in a |
| Translation factor expression regulation through methylation in the gene body of Translation factor (positive regulation) |
 |
| Cancer type | Gene | methyl group b | methyl group a | DEG pval | avg methyl in b | avg methyl in a | avg exp in b | avg exp in a |
| Translation factor expression regulation through copy number variation of Translation factor |
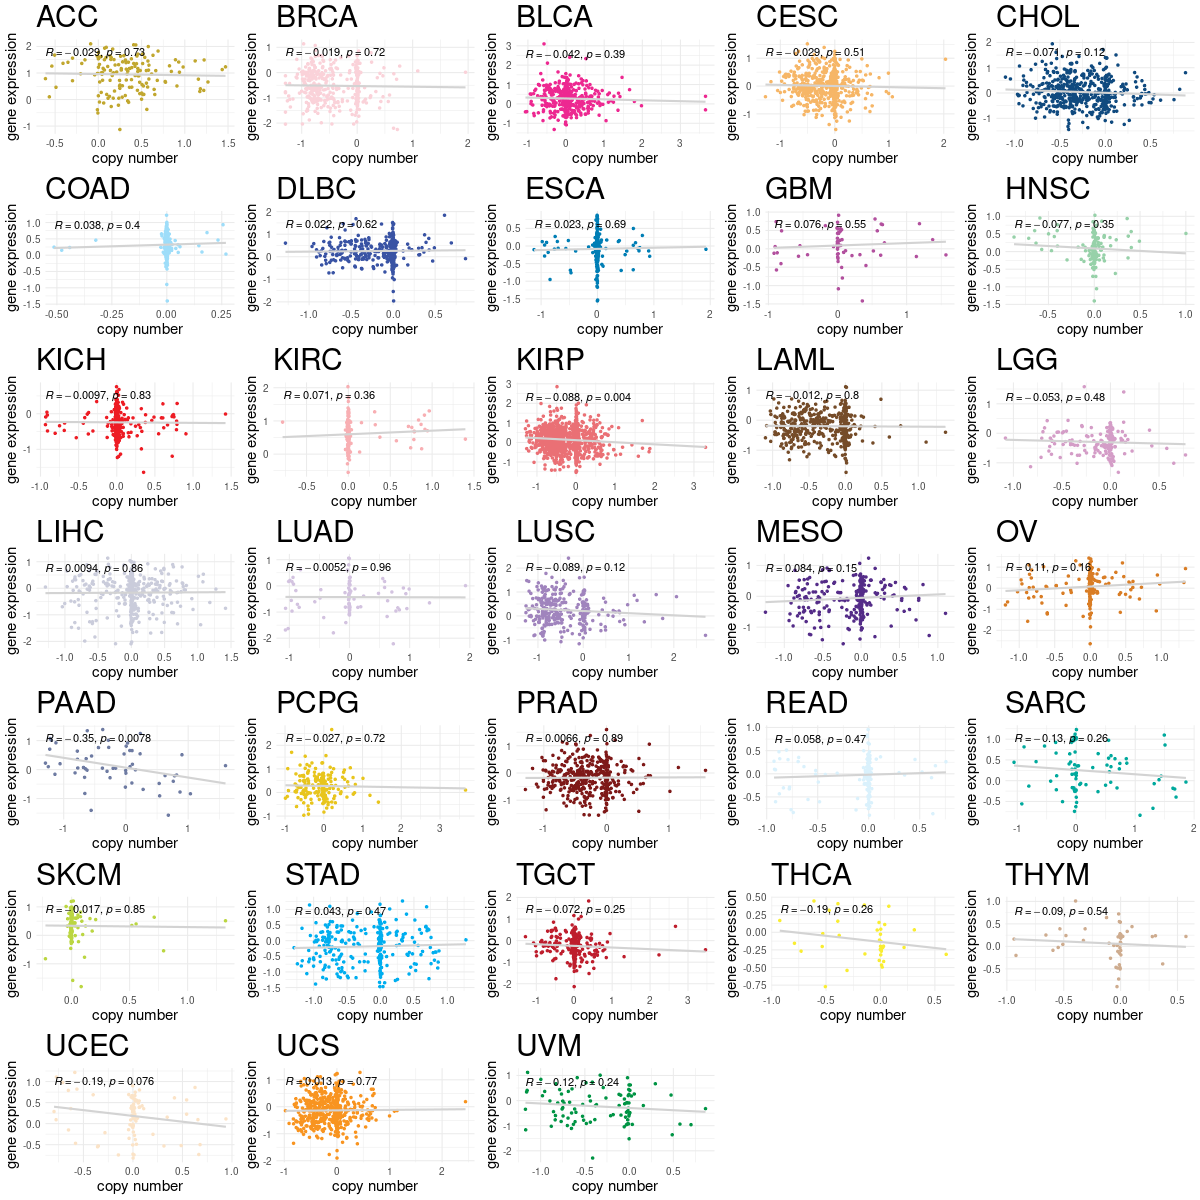 |
| Cancer type | Gene | Coefficient | Pvalue |
| KIRP | CNOT7 | -0.072354898 | 0.003964663 |
| PAAD | CNOT7 | -0.364297314 | 0.007807236 |
Top |
|
| Strongly correlated genes belong to cellular important gene groups with CNOT7 (coefficient>0.8, pval<0.05, node color based on FC between tumor and matched normal). Significantly associated important genes in the individual cancer types. * Cell metabolism gene: cell metabolism genes from REACTOME (black edge), IUPHAR: drug target genes from IUPHAR (blue edge), Kinase: human kinase genes (brown edge), CGC: cancer gene census genes (orange edge), TSG: tumor suppresor genes (purple edge), Epifactor: epigenetic factors (light blue edge), TF: transcription factors (green) |
 |
| Cancer type | Gene group | Translation factor | Correlated gene | Coefficient | Pvalue |
| ACC | Cell metabolism gene | CNOT7 | PPP2CB | 0.800871176 | 8.01E-19 |
| ACC | TSG | CNOT7 | PPP2CB | 0.800871176 | 8.01E-19 |
| COAD | Epifactor | CNOT7 | ELP3 | 0.802135844 | 3.29E-75 |
| COAD | IUPHAR | CNOT7 | ELP3 | 0.802135844 | 3.29E-75 |
| LAML | CGC | CNOT7 | TCEA1 | 0.809181291 | 2.42E-41 |
| READ | Cell metabolism gene | CNOT7 | PPP2R2A | 0.811763714 | 8.36E-26 |
| READ | Cell metabolism gene | CNOT7 | AGPAT5 | 0.874904498 | 3.29E-34 |
| READ | CGC | CNOT7 | LEPROTL1 | 0.806592193 | 2.93E-25 |
| READ | CGC | CNOT7 | PCM1 | 0.843029679 | 1.68E-29 |
| READ | Epifactor | CNOT7 | ELP3 | 0.815731839 | 3.11E-26 |
| READ | IUPHAR | CNOT7 | TNKS | 0.80021573 | 1.31E-24 |
| READ | IUPHAR | CNOT7 | ELP3 | 0.815731839 | 3.11E-26 |
| READ | TSG | CNOT7 | MCPH1 | 0.859043388 | 1.01E-31 |
| SKCM | Cell metabolism gene | CNOT7 | PPP2R2A | 0.822934363 | 5.63E-118 |
| SKCM | TSG | CNOT7 | MCPH1 | 0.82399977 | 1.55E-118 |
| TGCT | Cell metabolism gene | CNOT7 | AZIN1 | 0.820222935 | 3.44E-39 |
| TGCT | CGC | CNOT7 | WRN | 0.807091781 | 4.56E-37 |
| TGCT | Epifactor | CNOT7 | ZNF217 | 0.837689883 | 2.68E-42 |
| TGCT | IUPHAR | CNOT7 | FNTA | 0.801769016 | 2.97E-36 |
| TGCT | TF | CNOT7 | THAP1 | 0.809924134 | 1.64E-37 |
| TGCT | TF | CNOT7 | NFXL1 | 0.811988462 | 7.70E-38 |
| TGCT | TF | CNOT7 | ZNF217 | 0.837689883 | 2.68E-42 |
| TGCT | TF | CNOT7 | ZBTB39 | 0.85211085 | 3.73E-45 |
| THYM | Cell metabolism gene | CNOT7 | NUP205 | 0.802626302 | 1.06E-28 |
| THYM | Cell metabolism gene | CNOT7 | NUPL1 | 0.806067637 | 4.13E-29 |
| THYM | Cell metabolism gene | CNOT7 | MTMR6 | 0.815848022 | 2.53E-30 |
| THYM | Cell metabolism gene | CNOT7 | NUP54 | 0.825172734 | 1.51E-31 |
| THYM | Cell metabolism gene | CNOT7 | UPRT | 0.826602252 | 9.63E-32 |
| THYM | Cell metabolism gene | CNOT7 | NUP107 | 0.828849242 | 4.73E-32 |
| THYM | Cell metabolism gene | CNOT7 | POLR2B | 0.838009466 | 2.33E-33 |
| THYM | Cell metabolism gene | CNOT7 | MED17 | 0.839912015 | 1.22E-33 |
| THYM | Cell metabolism gene | CNOT7 | TGS1 | 0.852477012 | 1.34E-35 |
| THYM | CGC | CNOT7 | BRCA2 | 0.805400819 | 4.97E-29 |
| THYM | CGC | CNOT7 | CREB1 | 0.810081301 | 1.34E-29 |
| THYM | CGC | CNOT7 | FUBP1 | 0.810584674 | 1.16E-29 |
| THYM | CGC | CNOT7 | SUZ12 | 0.812269123 | 7.17E-30 |
| THYM | CGC | CNOT7 | ATF1 | 0.815548145 | 2.76E-30 |
| THYM | CGC | CNOT7 | RB1 | 0.815878869 | 2.51E-30 |
| THYM | CGC | CNOT7 | MSH2 | 0.831979102 | 1.73E-32 |
| THYM | CGC | CNOT7 | TRRAP | 0.836565792 | 3.79E-33 |
| THYM | CGC | CNOT7 | TCEA1 | 0.85093093 | 2.38E-35 |
| THYM | CGC | CNOT7 | RAD21 | 0.86092485 | 5.06E-37 |
| THYM | CGC | CNOT7 | TOP1 | 0.884450431 | 1.55E-41 |
| THYM | Epifactor | CNOT7 | MAP3K7 | 0.800835458 | 1.73E-28 |
| THYM | Epifactor | CNOT7 | NIPBL | 0.801524178 | 1.43E-28 |
| THYM | Epifactor | CNOT7 | ATAD2B | 0.801905998 | 1.29E-28 |
| THYM | Epifactor | CNOT7 | BRCA2 | 0.805400819 | 4.97E-29 |
| THYM | Epifactor | CNOT7 | TAF2 | 0.806357533 | 3.81E-29 |
| THYM | Epifactor | CNOT7 | SUZ12 | 0.812269123 | 7.17E-30 |
| THYM | Epifactor | CNOT7 | UCHL5 | 0.813158862 | 5.55E-30 |
| THYM | Epifactor | CNOT7 | RB1 | 0.815878869 | 2.51E-30 |
| THYM | Epifactor | CNOT7 | ACTL6A | 0.821684961 | 4.41E-31 |
| THYM | Epifactor | CNOT7 | SMARCAD1 | 0.822431084 | 3.51E-31 |
| THYM | Epifactor | CNOT7 | ANKRD32 | 0.830203529 | 3.06E-32 |
| THYM | Epifactor | CNOT7 | RCOR1 | 0.833683743 | 9.87E-33 |
| THYM | Epifactor | CNOT7 | TRRAP | 0.836565792 | 3.79E-33 |
| THYM | Epifactor | CNOT7 | CTR9 | 0.843815736 | 3.13E-34 |
| THYM | Epifactor | CNOT7 | ING3 | 0.854773449 | 5.60E-36 |
| THYM | Epifactor | CNOT7 | RBBP4 | 0.862471454 | 2.71E-37 |
| THYM | Epifactor | CNOT7 | PHF20L1 | 0.862626009 | 2.55E-37 |
| THYM | Epifactor | CNOT7 | YY1 | 0.863727956 | 1.63E-37 |
| THYM | Epifactor | CNOT7 | DR1 | 0.89260816 | 2.46E-43 |
| THYM | IUPHAR | CNOT7 | MAP3K7 | 0.800835458 | 1.73E-28 |
| THYM | IUPHAR | CNOT7 | ATAD2B | 0.801905998 | 1.29E-28 |
| THYM | IUPHAR | CNOT7 | OXSR1 | 0.81305704 | 5.71E-30 |
| THYM | IUPHAR | CNOT7 | HIPK1 | 0.825391168 | 1.41E-31 |
| THYM | IUPHAR | CNOT7 | SRPK2 | 0.833363967 | 1.10E-32 |
| THYM | IUPHAR | CNOT7 | TRRAP | 0.836565792 | 3.79E-33 |
| THYM | IUPHAR | CNOT7 | SLC35A3 | 0.841358597 | 7.38E-34 |
| THYM | IUPHAR | CNOT7 | DYRK1A | 0.863590511 | 1.72E-37 |
| THYM | IUPHAR | CNOT7 | TOP1 | 0.884450431 | 1.55E-41 |
| THYM | Kinase | CNOT7 | MAP3K7 | 0.800835458 | 1.73E-28 |
| THYM | Kinase | CNOT7 | OXSR1 | 0.81305704 | 5.71E-30 |
| THYM | Kinase | CNOT7 | HIPK1 | 0.825391168 | 1.41E-31 |
| THYM | Kinase | CNOT7 | SRPK2 | 0.833363967 | 1.10E-32 |
| THYM | Kinase | CNOT7 | TRRAP | 0.836565792 | 3.79E-33 |
| THYM | Kinase | CNOT7 | DYRK1A | 0.863590511 | 1.72E-37 |
| THYM | TF | CNOT7 | ZNF92 | 0.800928525 | 1.68E-28 |
| THYM | TF | CNOT7 | ZNF207 | 0.802049406 | 1.24E-28 |
| THYM | TF | CNOT7 | ATF6B | 0.802229385 | 1.18E-28 |
| THYM | TF | CNOT7 | HSF2 | 0.803409043 | 8.59E-29 |
| THYM | TF | CNOT7 | ZNF131 | 0.803426908 | 8.55E-29 |
| THYM | TF | CNOT7 | ZNF765 | 0.803536908 | 8.30E-29 |
| THYM | TF | CNOT7 | ZKSCAN4 | 0.805044423 | 5.48E-29 |
| THYM | TF | CNOT7 | ZNF675 | 0.806446266 | 3.72E-29 |
| THYM | TF | CNOT7 | ZNF235 | 0.809927966 | 1.40E-29 |
| THYM | TF | CNOT7 | CREB1 | 0.810081301 | 1.34E-29 |
| THYM | TF | CNOT7 | ZNF230 | 0.810527375 | 1.18E-29 |
| THYM | TF | CNOT7 | ATF1 | 0.815548145 | 2.76E-30 |
| THYM | TF | CNOT7 | SP4 | 0.826301096 | 1.06E-31 |
| THYM | TF | CNOT7 | RLF | 0.827917072 | 6.36E-32 |
| THYM | TF | CNOT7 | ZUFSP | 0.830868219 | 2.47E-32 |
| THYM | TF | CNOT7 | ZNF227 | 0.83505081 | 6.28E-33 |
| THYM | TF | CNOT7 | ZNF776 | 0.835732178 | 5.01E-33 |
| THYM | TF | CNOT7 | SP3 | 0.837853355 | 2.45E-33 |
| THYM | TF | CNOT7 | THAP1 | 0.850186123 | 3.14E-35 |
| THYM | TF | CNOT7 | YY1 | 0.863727956 | 1.63E-37 |
| THYM | TF | CNOT7 | ZNF143 | 0.868967476 | 1.82E-38 |
| THYM | TF | CNOT7 | ZNF184 | 0.87226465 | 4.37E-39 |
| THYM | TF | CNOT7 | CDC5L | 0.87538973 | 1.09E-39 |
| THYM | TF | CNOT7 | ELF1 | 0.891770469 | 3.83E-43 |
| THYM | TF | CNOT7 | DR1 | 0.89260816 | 2.46E-43 |
| THYM | TSG | CNOT7 | IGF2R | 0.803378768 | 8.66E-29 |
| THYM | TSG | CNOT7 | INTS6 | 0.803430909 | 8.54E-29 |
| THYM | TSG | CNOT7 | BRCA2 | 0.805400819 | 4.97E-29 |
| THYM | TSG | CNOT7 | SUZ12 | 0.812269123 | 7.17E-30 |
| THYM | TSG | CNOT7 | CCAR1 | 0.812390198 | 6.92E-30 |
| THYM | TSG | CNOT7 | RB1 | 0.815878869 | 2.51E-30 |
| THYM | TSG | CNOT7 | HACE1 | 0.819118432 | 9.59E-31 |
| THYM | TSG | CNOT7 | MSH2 | 0.831979102 | 1.73E-32 |
| THYM | TSG | CNOT7 | RANBP9 | 0.850986155 | 2.33E-35 |
| THYM | TSG | CNOT7 | ING3 | 0.854773449 | 5.60E-36 |
| THYM | TSG | CNOT7 | LIN9 | 0.873544711 | 2.48E-39 |
| UCEC | Cell metabolism gene | CNOT7 | AGPAT5 | 0.824287133 | 4.69E-51 |
| UCS | Cell metabolism gene | CNOT7 | NUP205 | 0.802626302 | 1.06E-28 |
| UCS | Cell metabolism gene | CNOT7 | NUPL1 | 0.806067637 | 4.13E-29 |
| UCS | Cell metabolism gene | CNOT7 | MTMR6 | 0.815848022 | 2.53E-30 |
| UCS | Cell metabolism gene | CNOT7 | NUP54 | 0.825172734 | 1.51E-31 |
| UCS | Cell metabolism gene | CNOT7 | UPRT | 0.826602252 | 9.63E-32 |
| UCS | Cell metabolism gene | CNOT7 | NUP107 | 0.828849242 | 4.73E-32 |
| UCS | Cell metabolism gene | CNOT7 | POLR2B | 0.838009466 | 2.33E-33 |
| UCS | Cell metabolism gene | CNOT7 | MED17 | 0.839912015 | 1.22E-33 |
| UCS | Cell metabolism gene | CNOT7 | TGS1 | 0.852477012 | 1.34E-35 |
| UCS | CGC | CNOT7 | BRCA2 | 0.805400819 | 4.97E-29 |
| UCS | CGC | CNOT7 | CREB1 | 0.810081301 | 1.34E-29 |
| UCS | CGC | CNOT7 | FUBP1 | 0.810584674 | 1.16E-29 |
| UCS | CGC | CNOT7 | SUZ12 | 0.812269123 | 7.17E-30 |
| UCS | CGC | CNOT7 | ATF1 | 0.815548145 | 2.76E-30 |
| UCS | CGC | CNOT7 | RB1 | 0.815878869 | 2.51E-30 |
| UCS | CGC | CNOT7 | MSH2 | 0.831979102 | 1.73E-32 |
| UCS | CGC | CNOT7 | TRRAP | 0.836565792 | 3.79E-33 |
| UCS | CGC | CNOT7 | TCEA1 | 0.85093093 | 2.38E-35 |
| UCS | CGC | CNOT7 | RAD21 | 0.86092485 | 5.06E-37 |
| UCS | CGC | CNOT7 | TOP1 | 0.884450431 | 1.55E-41 |
| UCS | Epifactor | CNOT7 | MAP3K7 | 0.800835458 | 1.73E-28 |
| UCS | Epifactor | CNOT7 | NIPBL | 0.801524178 | 1.43E-28 |
| UCS | Epifactor | CNOT7 | ATAD2B | 0.801905998 | 1.29E-28 |
| UCS | Epifactor | CNOT7 | BRCA2 | 0.805400819 | 4.97E-29 |
| UCS | Epifactor | CNOT7 | TAF2 | 0.806357533 | 3.81E-29 |
| UCS | Epifactor | CNOT7 | SUZ12 | 0.812269123 | 7.17E-30 |
| UCS | Epifactor | CNOT7 | UCHL5 | 0.813158862 | 5.55E-30 |
| UCS | Epifactor | CNOT7 | RB1 | 0.815878869 | 2.51E-30 |
| UCS | Epifactor | CNOT7 | ACTL6A | 0.821684961 | 4.41E-31 |
| UCS | Epifactor | CNOT7 | SMARCAD1 | 0.822431084 | 3.51E-31 |
| UCS | Epifactor | CNOT7 | ANKRD32 | 0.830203529 | 3.06E-32 |
| UCS | Epifactor | CNOT7 | RCOR1 | 0.833683743 | 9.87E-33 |
| UCS | Epifactor | CNOT7 | TRRAP | 0.836565792 | 3.79E-33 |
| UCS | Epifactor | CNOT7 | CTR9 | 0.843815736 | 3.13E-34 |
| UCS | Epifactor | CNOT7 | ING3 | 0.854773449 | 5.60E-36 |
| UCS | Epifactor | CNOT7 | RBBP4 | 0.862471454 | 2.71E-37 |
| UCS | Epifactor | CNOT7 | PHF20L1 | 0.862626009 | 2.55E-37 |
| UCS | Epifactor | CNOT7 | YY1 | 0.863727956 | 1.63E-37 |
| UCS | Epifactor | CNOT7 | DR1 | 0.89260816 | 2.46E-43 |
| UCS | IUPHAR | CNOT7 | MAP3K7 | 0.800835458 | 1.73E-28 |
| UCS | IUPHAR | CNOT7 | ATAD2B | 0.801905998 | 1.29E-28 |
| UCS | IUPHAR | CNOT7 | OXSR1 | 0.81305704 | 5.71E-30 |
| UCS | IUPHAR | CNOT7 | HIPK1 | 0.825391168 | 1.41E-31 |
| UCS | IUPHAR | CNOT7 | SRPK2 | 0.833363967 | 1.10E-32 |
| UCS | IUPHAR | CNOT7 | TRRAP | 0.836565792 | 3.79E-33 |
| UCS | IUPHAR | CNOT7 | SLC35A3 | 0.841358597 | 7.38E-34 |
| UCS | IUPHAR | CNOT7 | DYRK1A | 0.863590511 | 1.72E-37 |
| UCS | IUPHAR | CNOT7 | TOP1 | 0.884450431 | 1.55E-41 |
| UCS | Kinase | CNOT7 | MAP3K7 | 0.800835458 | 1.73E-28 |
| UCS | Kinase | CNOT7 | OXSR1 | 0.81305704 | 5.71E-30 |
| UCS | Kinase | CNOT7 | HIPK1 | 0.825391168 | 1.41E-31 |
| UCS | Kinase | CNOT7 | SRPK2 | 0.833363967 | 1.10E-32 |
| UCS | Kinase | CNOT7 | TRRAP | 0.836565792 | 3.79E-33 |
| UCS | Kinase | CNOT7 | DYRK1A | 0.863590511 | 1.72E-37 |
| UCS | TF | CNOT7 | ZNF92 | 0.800928525 | 1.68E-28 |
| UCS | TF | CNOT7 | ZNF207 | 0.802049406 | 1.24E-28 |
| UCS | TF | CNOT7 | ATF6B | 0.802229385 | 1.18E-28 |
| UCS | TF | CNOT7 | HSF2 | 0.803409043 | 8.59E-29 |
| UCS | TF | CNOT7 | ZNF131 | 0.803426908 | 8.55E-29 |
| UCS | TF | CNOT7 | ZNF765 | 0.803536908 | 8.30E-29 |
| UCS | TF | CNOT7 | ZKSCAN4 | 0.805044423 | 5.48E-29 |
| UCS | TF | CNOT7 | ZNF675 | 0.806446266 | 3.72E-29 |
| UCS | TF | CNOT7 | ZNF235 | 0.809927966 | 1.40E-29 |
| UCS | TF | CNOT7 | CREB1 | 0.810081301 | 1.34E-29 |
| UCS | TF | CNOT7 | ZNF230 | 0.810527375 | 1.18E-29 |
| UCS | TF | CNOT7 | ATF1 | 0.815548145 | 2.76E-30 |
| UCS | TF | CNOT7 | SP4 | 0.826301096 | 1.06E-31 |
| UCS | TF | CNOT7 | RLF | 0.827917072 | 6.36E-32 |
| UCS | TF | CNOT7 | ZUFSP | 0.830868219 | 2.47E-32 |
| UCS | TF | CNOT7 | ZNF227 | 0.83505081 | 6.28E-33 |
| UCS | TF | CNOT7 | ZNF776 | 0.835732178 | 5.01E-33 |
| UCS | TF | CNOT7 | SP3 | 0.837853355 | 2.45E-33 |
| UCS | TF | CNOT7 | THAP1 | 0.850186123 | 3.14E-35 |
| UCS | TF | CNOT7 | YY1 | 0.863727956 | 1.63E-37 |
| UCS | TF | CNOT7 | ZNF143 | 0.868967476 | 1.82E-38 |
| UCS | TF | CNOT7 | ZNF184 | 0.87226465 | 4.37E-39 |
| UCS | TF | CNOT7 | CDC5L | 0.87538973 | 1.09E-39 |
| UCS | TF | CNOT7 | ELF1 | 0.891770469 | 3.83E-43 |
| UCS | TF | CNOT7 | DR1 | 0.89260816 | 2.46E-43 |
| UCS | TSG | CNOT7 | IGF2R | 0.803378768 | 8.66E-29 |
| UCS | TSG | CNOT7 | INTS6 | 0.803430909 | 8.54E-29 |
| UCS | TSG | CNOT7 | BRCA2 | 0.805400819 | 4.97E-29 |
| UCS | TSG | CNOT7 | SUZ12 | 0.812269123 | 7.17E-30 |
| UCS | TSG | CNOT7 | CCAR1 | 0.812390198 | 6.92E-30 |
| UCS | TSG | CNOT7 | RB1 | 0.815878869 | 2.51E-30 |
| UCS | TSG | CNOT7 | HACE1 | 0.819118432 | 9.59E-31 |
| UCS | TSG | CNOT7 | MSH2 | 0.831979102 | 1.73E-32 |
| UCS | TSG | CNOT7 | RANBP9 | 0.850986155 | 2.33E-35 |
| UCS | TSG | CNOT7 | ING3 | 0.854773449 | 5.60E-36 |
| UCS | TSG | CNOT7 | LIN9 | 0.873544711 | 2.48E-39 |
| UVM | Cell metabolism gene | CNOT7 | PPP2R2A | 0.80663074 | 1.71E-19 |
| UVM | IUPHAR | CNOT7 | TNKS | 0.80478622 | 2.38E-19 |
| UVM | IUPHAR | CNOT7 | FNTA | 0.911829865 | 6.88E-32 |
| UVM | TSG | CNOT7 | MCPH1 | 0.841834405 | 1.37E-22 |
Top |
|
| Protein 3D structure Visit iCn3D. |
Top |
|
| Protein-protein interaction networks * Overlap between up-regulated DEGs (log2FC<-1 and adj.P<0.05) and STRING PPI network (center: Translation factor, node: DEGs, edges: weighted by -log2(adj.P)) |
 |
| Overlap between down-regulated DEGs (log2FC>1 and adj.P<0.05) and STRING PPI network (center: Translation factor, node: DEGs, edges: weighted by -log2(adj.P)) |
 |
 * Edge colors based on TCGA cancer types. |
| * Overlap between DEGs (log2FC>1 and adj.P<0.05) and STRING PPI network per cancer (center: Translation factor, node: DEGs, node color: log2FC, edges: weighted by -log2(adj.P)) |
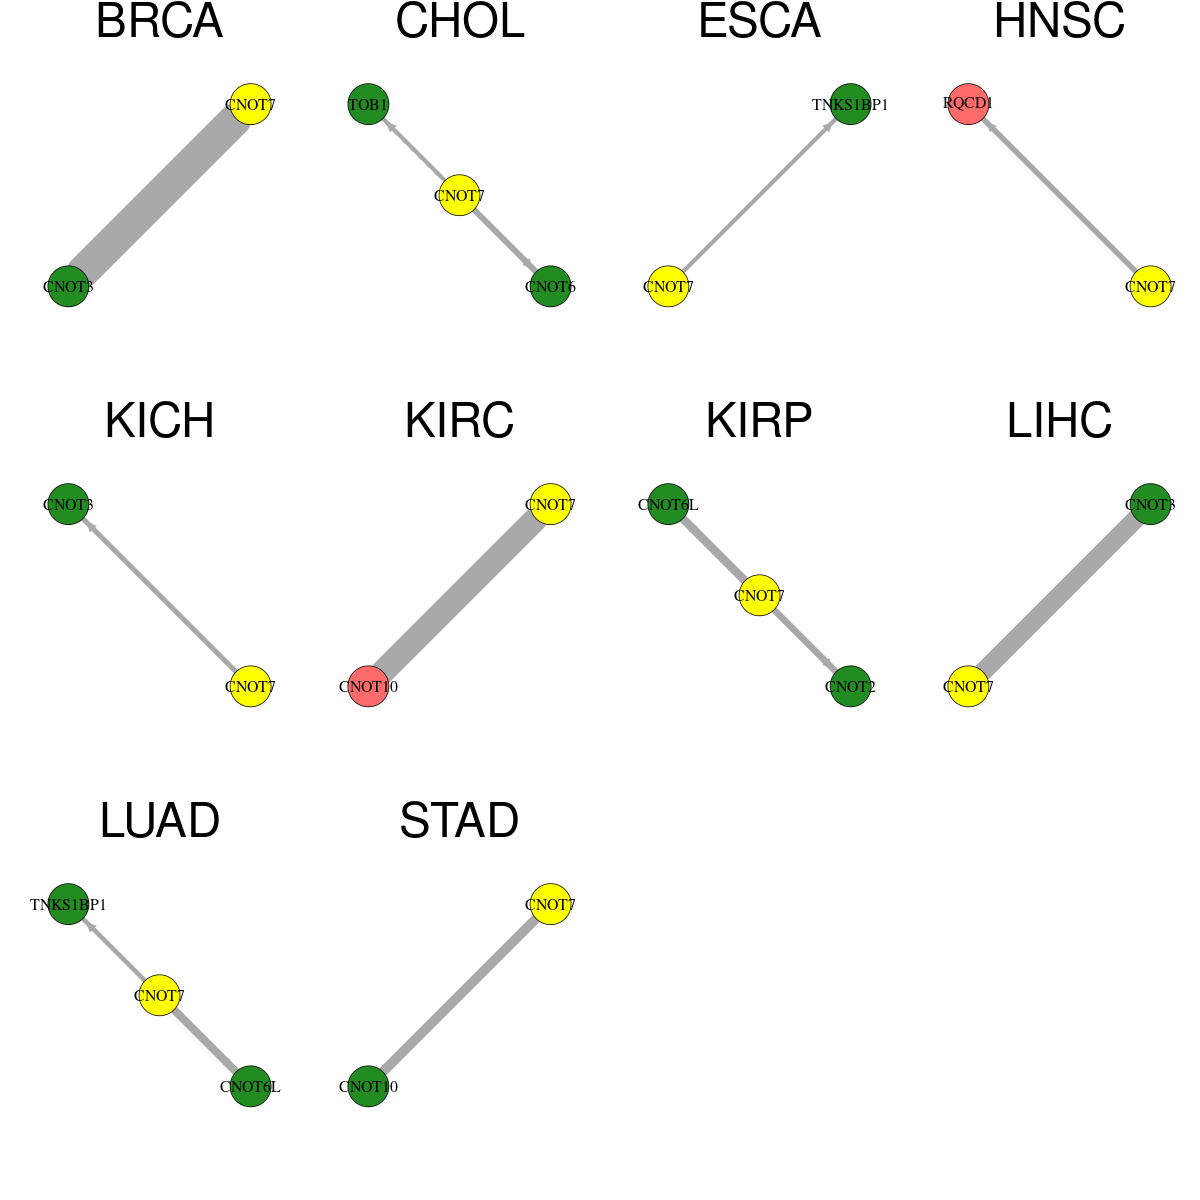 |
| Cancer type | Translation factor | Interacting protein coding gene | FC | adj.pval |
| STAD | CNOT7 | CNOT10 | -2.1943232806481 | 0.000121572986245155 |
| KIRP | CNOT7 | CNOT6L | -3.87663737407518 | 0.000364991836249828 |
| LUAD | CNOT7 | CNOT6L | -2.1633182779043 | 0.00060389239279426 |
| KIRP | CNOT7 | CNOT2 | -1.10448855710506 | 0.00222697434946895 |
| CHOL | CNOT7 | CNOT6 | -4.83321533739418 | 0.00390625 |
| HNSC | CNOT7 | RQCD1 | 1.97297540658491 | 0.00585215220849023 |
| KICH | CNOT7 | CNOT3 | -1.1461250404339 | 0.00882232189178467 |
| LUAD | CNOT7 | TNKS1BP1 | -1.41031433007162 | 0.0138138989413052 |
| ESCA | CNOT7 | TNKS1BP1 | -2.3202441985139 | 0.0185546875 |
| CHOL | CNOT7 | TOB1 | -1.86894127400263 | 0.01953125 |
| KIRC | CNOT7 | CNOT10 | 1.29182504470331 | 2.23846498739956e-10 |
| LIHC | CNOT7 | CNOT3 | -1.23300348731276 | 3.17814170396599e-08 |
| BRCA | CNOT7 | CNOT3 | -2.12666858749727 | 9.14937084127887e-14 |
| Protein-protein interactors with this translation factor (BIOGRID-3.4.160) |
| PPI interactors with CNOT7 |
| PABPC1, TOB1, TOB2, CDK4, CDK2, CDK1, BTG1, BTG2, IKBKG, HOXD4, Cnot3, ELAVL1, APP, EPAS1, AGO1, AGO2, CNOT6, BAG3, FBXW11, FOXC2, TNRC6A, MMP7, CAPZA2, RQCD1, CNOT1, CNOT3, TNKS1BP1, CNOT10, RAVER1, CNOT2, CNOT6L, CNOT11, BTG3, RAD54L2, PURB, AURKA, TNRC6C, TNRC6B, APEH, DDX6, B9D2, CNTROB, SCARA3, XPO1, Rpl35, Cnot2, MEX3C, RC3H1, ZFP36, Zfp36, NANOS2, TEX13A, RIBC1, GADD45B, NFKB1, ORF49, CCR4, FBXO7, EGLN3, LSM3, NMI, TSG101, SH3GLB2, PSMC1, MRFAP1L1, PSMC2, TEX11, PIAS1, FHL3, ESR2, RC3H2, ZC3H7A, BMH2, BMH1, DYRK1A, ANXA2R, HTT, PSEN1, TCP11L1, ESR1, ANKRD17, CEP85, AGO3, BBS2, CNOT4, CPEB4, DVL3, EIF4ENIF1, FAM193A, GPBP1, GPBP1L1, HCFC2, HELZ, KIAA0355, N4BP2, PARP14, PRRC2B, PUM1, RNF219, SMG5, SMG7, TDRD3, TMEM57, USP47, YTHDF2, MEX3B, PATL1, PRRC2A, UNK, YTHDF3, TOP3B, RBMS1, YTHDF1, R3HDM2, SAMD4B, MKI67, FHL2, NANOS1, CAPZA1, MAGEA9, TMEM131, CAPZB, PABPN1L, FANCD2OS, FPR1, SULT1C4, MINK1, C12orf57, SCGN, CPEB1, |
Top |
|
| Clinically associated variants from ClinVar. |
| Gene | Chr | Position | RefSeq | VarSeq | RefSeeq | VarType | Pathogenic | Disease | VarInfo |
| CNOT7 | chr8 | 17104142 | C | G | single_nucleotide_variant | Likely_benign | not_provided | SO:0001627|intron_variant | SO:0001627|intron_variant |
| CNOT7 | chr8 | 17104188 | G | A | single_nucleotide_variant | Benign | not_provided | SO:0001623|5_prime_UTR_variant | SO:0001623|5_prime_UTR_variant |
| nsSNVs with sample frequency (size of circle) from TCGA 33 cancers. |
 |
| SNVs and Indels |
| Gene | Cancer type | Chromosome | Start | End | RefSeeq | MutSeq | Mutation type | AAchange | # samples |
| CNOT7 | SKCM | chr8 | 17102580 | 17102580 | G | A | Missense_Mutation | p.R28C | 4 |
| CNOT7 | COAD | chr8 | 17092286 | 17092286 | C | T | Missense_Mutation | p.R186Q | 3 |
| CNOT7 | ESCA | chr8 | 17092319 | 17092319 | G | A | Missense_Mutation | p.P175L | 3 |
| CNOT7 | LUAD | chr8 | 17090038 | 17090038 | T | A | Missense_Mutation | p.L209F | 2 |
| CNOT7 | STAD | chr8 | 17102642 | 17102642 | T | C | Missense_Mutation | p.D7G | 2 |
| CNOT7 | ESCA | chr8 | 17092319 | 17092319 | G | A | Missense_Mutation | 2 | |
| CNOT7 | STAD | chr8 | 17100550 | 17100550 | A | G | Missense_Mutation | p.Y88H | 2 |
| CNOT7 | STAD | chr8 | 17092325 | 17092325 | T | C | Missense_Mutation | p.N173S | 2 |
| CNOT7 | STAD | chr8 | 17094768 | 17094768 | A | C | Silent | p.T142T | 2 |
| CNOT7 | KIRC | chr8 | 17102635 | 17102635 | G | T | Missense_Mutation | p.S9R | 2 |
| CNOT7 | PRAD | chr8 | 17102627 | 17102627 | A | C | Missense_Mutation | p.I12S | 2 |
| CNOT7 | THCA | chr8 | 17092255 | 17092255 | C | G | Missense_Mutation | p.K196N | 2 |
| CNOT7 | SKCM | chr8 | 17094725 | 17094725 | G | A | Missense_Mutation | p.H157Y | 2 |
| CNOT7 | UCEC | chr8 | 17088235 | 17088235 | C | A | Missense_Mutation | p.Q284H | 2 |
| CNOT7 | LIHC | chr8 | 17094743 | 17094743 | C | - | Frame_Shift_Del | p.V151fs | 2 |
| CNOT7 | UCEC | chr8 | 17088265 | 17088265 | C | T | Silent | p.G274 | 2 |
| CNOT7 | LUAD | chr8 | 17090042 | 17090042 | C | A | Missense_Mutation | p.G208V | 2 |
| CNOT7 | STAD | chr8 | 17102642 | 17102642 | T | C | Missense_Mutation | 2 | |
| CNOT7 | UCEC | chr8 | 17100639 | 17100639 | G | A | Missense_Mutation | p.A58V | 2 |
| CNOT7 | LUAD | chr8 | 17092352 | 17092352 | T | C | Missense_Mutation | p.Y164C | 1 |
| CNOT7 | BLCA | chr8 | 17094804 | 17094804 | T | G | Silent | 1 | |
| CNOT7 | HNSC | chr8 | 17088314 | 17088314 | T | C | Missense_Mutation | 1 | |
| CNOT7 | LUAD | chr8 | 17102606 | 17102606 | T | A | Missense_Mutation | p.N19I | 1 |
| CNOT7 | BLCA | chr8 | 17094804 | 17094804 | T | G | Silent | p.G130G | 1 |
| CNOT7 | HNSC | chr8 | 17088314 | 17088314 | T | C | Missense_Mutation | p.H258R | 1 |
| CNOT7 | LUSC | chr8 | 17090016 | 17090016 | C | G | Missense_Mutation | p.E217Q | 1 |
| CNOT7 | CESC | chr8 | 17100547 | 17100547 | G | G | Missense_Mutation | 1 | |
| CNOT7 | COAD | chr8 | 17089982 | 17089982 | C | T | Missense_Mutation | p.G228E | 1 |
| CNOT7 | STAD | chr8 | 17088329 | 17088329 | G | A | Missense_Mutation | p.A253V | 1 |
| CNOT7 | LGG | chr8 | 17089983 | 17089983 | C | A | Nonsense_Mutation | p.G228* | 1 |
| CNOT7 | PRAD | chr8 | 17089971 | 17089971 | A | G | Silent | p.L232L | 1 |
| CNOT7 | COAD | chr8 | 17092275 | 17092276 | - | A | Frame_Shift_Ins | p.P190fs | 1 |
| CNOT7 | THCA | chr8 | 17092255 | 17092255 | C | G | Missense_Mutation | 1 | |
| CNOT7 | LGG | chr8 | 17102653 | 17102653 | C | T | Silent | p.A3A | 1 |
| CNOT7 | READ | chr8 | 17102567 | 17102567 | C | T | Missense_Mutation | p.R32Q | 1 |
| CNOT7 | LGG | chr8 | 17089983 | 17089983 | C | A | Missense_Mutation | 1 | |
| CNOT7 | COAD | chr8 | 17092330 | 17092330 | G | A | Silent | p.N171N | 1 |
| CNOT7 | UCEC | chr8 | 17094735 | 17094735 | C | G | Missense_Mutation | p.W153C | 1 |
| CNOT7 | LGG | chr8 | 17102653 | 17102653 | C | T | Silent | 1 | |
| CNOT7 | COAD | chr8 | 17092331 | 17092331 | T | G | Missense_Mutation | p.N171T | 1 |
| CNOT7 | SKCM | chr8 | 17090013 | 17090013 | G | A | Silent | p.L218L | 1 |
| CNOT7 | COAD | chr8 | 17094735 | 17094735 | C | T | Nonsense_Mutation | p.W153X | 1 |
| Copy number variation (CNV) of CNOT7 * Click on the image to open the original image in a new window. |
 |
| Fusion gene breakpoints (product of the structural variants (SVs)) across CNOT7 * Click on the image to open the UCSC genome browser with custom track showing this image in a new window. |
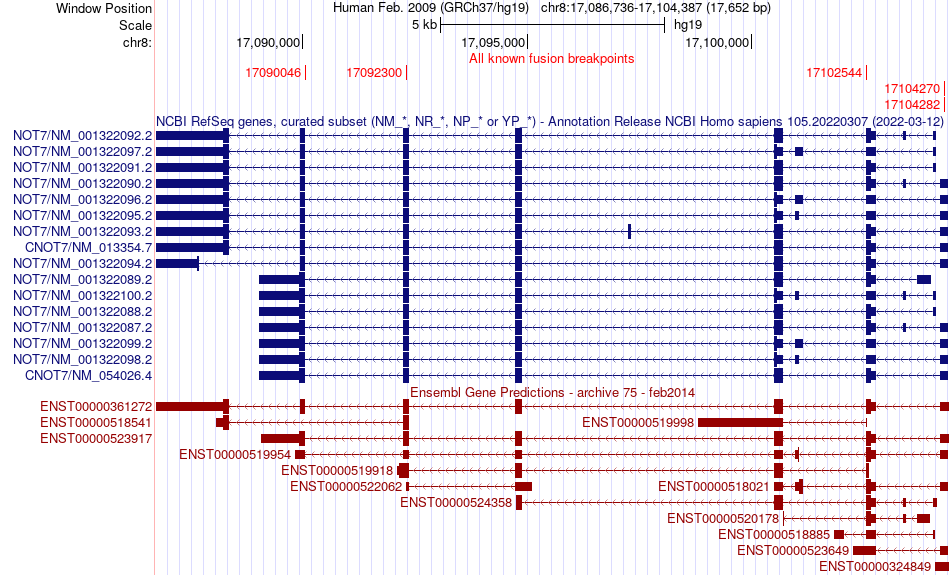 |
| Fusion genes with this translation factor from FusionGDB2.0. |
| FusionGDB2 ID | Disease | Sample | Hgene | Hchr | Hbp | Hstrand | Tgene | Tchr | Tbp | Tstrand |
| 51865 | N/A | AA173648 | CNOT7 | chr8 | 17092300 | + | CNOT7 | chr8 | 17090046 | - |
| 51865 | N/A | AA173958 | CNOT7 | chr8 | 17090046 | + | CNOT7 | chr8 | 17092300 | - |
| 63339 | STAD | TCGA-BR-A4CR | CNOT7 | chr8 | 17102544 | - | PCM1 | chr8 | 17871472 | + |
| 51872 | N/A | BM749134 | MAT2A | chr2 | 85766396 | + | CNOT7 | chr8 | 17104270 | - |
Top |
|
| Kaplan-Meier plots with logrank tests of overall survival (OS) |
 |
| Cancer type | Translation factor | Coefficent | Hazard ratio | Wald test pval | Likelihool ratio pval | Logrank test pval | # samples |
Top |
|
| Differential gene expression between female and male. (Wilcoxon test, pval<0.05) |
 |
| Cancer type | Translation factor | pval | adj.p |
| TGCT | CNOT7 | 0.000218358507325036 | 0.0061 |
| STAD | CNOT7 | 0.000461190936118332 | 0.012 |
| SARC | CNOT7 | 0.0156886283586539 | 0.41 |
| LUAD | CNOT7 | 0.0157347697383842 | 0.41 |
| KIRP | CNOT7 | 0.0198285642243618 | 0.48 |
| LAML | CNOT7 | 0.0352619444973157 | 0.81 |
| PAAD | CNOT7 | 0.0475736089583631 | 1 |
Top |
|
| Differential gene expression between young and old age groups (Wilcoxon test, pval<0.05) |
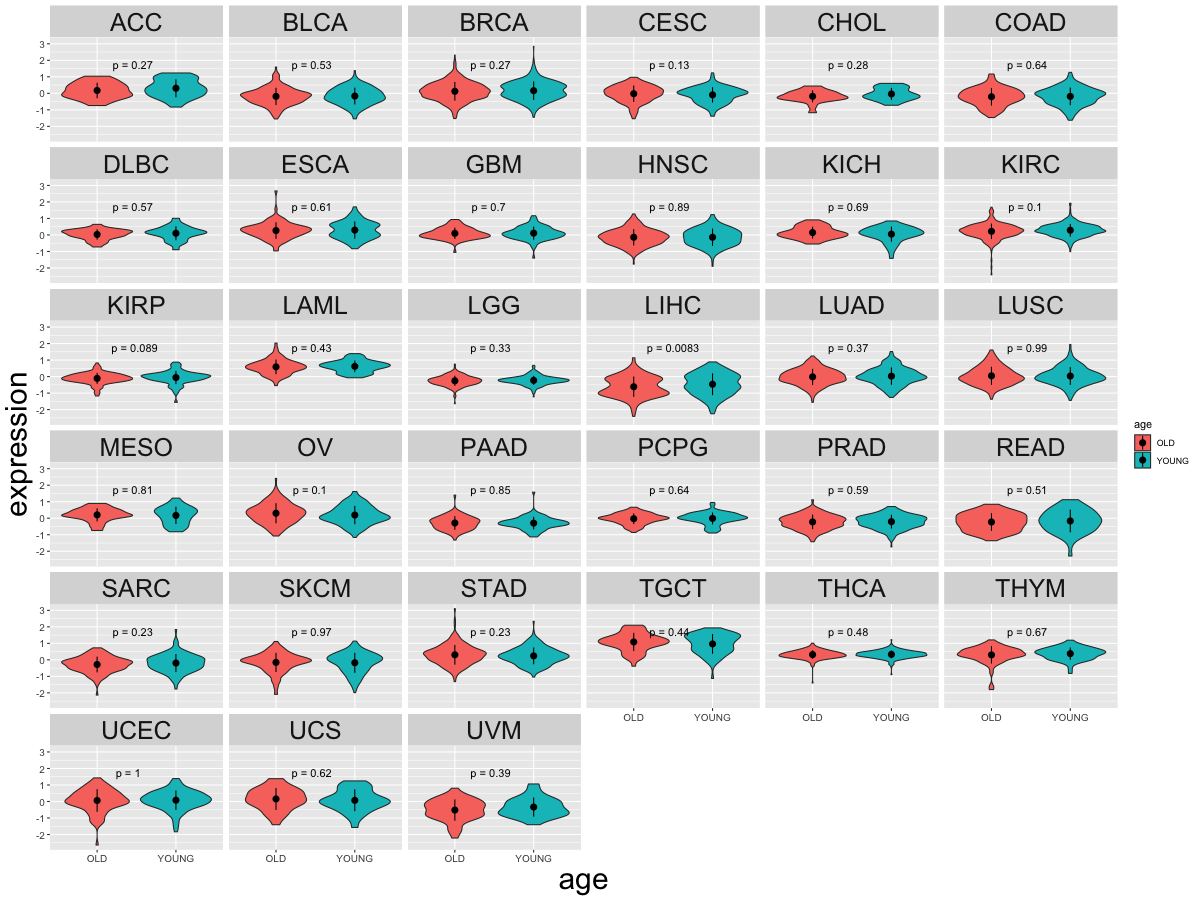 |
| Cancer type | Translation factor | pval | adj.p |
| LIHC | CNOT7 | 0.00828535016007337 | 0.27 |
Top |
|
| Drugs targeting genes involved in this translation factor. (DrugBank Version 5.1.8 2021-05-08) |
| UniProtAcc | DrugBank ID | Drug name | Drug activity | Drug type | Drug status |
Top |
|
| Diseases associated with this translation factor. (DisGeNet 4.0) |
| Disease ID | Disease Name | # PubMeds | Disease source |
(UTHealth)
Web File Viewing | Emergency Information |Campus Carry|Site Policies