
|
||||||
|

Translation Factor: NANOS3 (NCBI Gene ID:342977) |
|
 Gene Summary Gene Summary |
| Gene Information | Gene Name: NANOS3 | Gene ID: 342977 | Gene Symbol | NANOS3 | Gene ID | 342977 |
| Gene Name | nanos C2HC-type zinc finger 3 | |
| Synonyms | NANOS1L|NOS3|ZC2HC12C | |
| Cytomap | 19p13.12 | |
| Type of Gene | protein-coding | |
| Description | nanos homolog 3 | |
| Modification date | 20200313 | |
| UniProtAcc | P60323 | |
| Child GO biological process term(s) under GO:0006412 |
| GO ID | GO term |
| GO:0017148 | Negative regulation of translation |
| GO:0006417 | Regulation of translation |
| GO:0006412 | Translation |
| Gene ontology of translaction factor with evidence of Inferred from Direct Assay (IDA) from Entrez |
| Partner | Gene | GO ID | GO term | PubMed ID |
| Hgene | NANOS3 | GO:0017148 | negative regulation of translation | 24736845 |
| Hgene | NANOS3 | GO:1900153 | positive regulation of nuclear-transcribed mRNA catabolic process, deadenylation-dependent decay | 24736845 |
| Inferred gene age of translation factor. |
| Gene | Inferred gene age group among (0 - 67.6], (67.6 - 355.7], (355.7 - 733], (733 - 1119.25], >1119.25 |
| NANOS3 | (355.7 - 733] |
Top |
|
| We searched PubMed using 'NANOS3[title] AND translation [title] AND human.' |
| Gene | Title | PMID |
| NANOS3 | . | . |
Top |
|
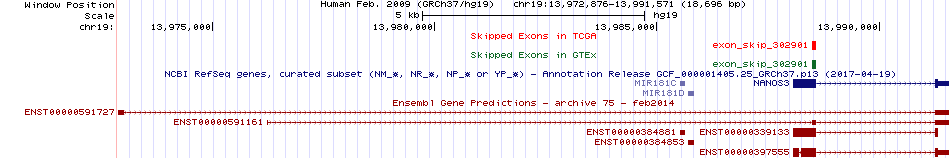
| Skipped exons in TCGA and GTEx based on Ensembl gene isoform structure. * Click on the image to open the UCSC genome browser with custom track showing this image in a new window. For more annotations, please visit our ExonSkipDB. |
 |
| Open reading frame (ORF) analsis of exon skipping events based on Ensembl gene isoform structure. * Click on the break point to see the gene structure around the break point region using the UCSC Genome Browser. |
| ENST | Exon skip start (DNA) | Exon Skip end (DNA) | ORF |
| Exon skipping position in the amino acid sequence. |
| ENST | Exon skip start (DNA) | Exon Skip end (DNA) | Len(transcript seq) | Exon skip start (mRNA) | Exon Skip end (mRNA) | Len(amino acid seq) | Exon skip start (AA) | Exon Skip end (AA) |
| Potentially (partially) lost protein functional features of UniProt. |
| UniProtAcc | Exon skip start (AA) | Exon Skip end (AA) | Function feature start (AA) | Function feature end (AA) | Functional feature type | Functional feature desc. |
Top |
|
| Gene expression level across TCGA pancancer |
 |
| Gene expression level across GTEx pantissue |
 |
| Expression level of gene isoforms across TCGA pancancer |
 |
| Expression level of gene isoforms across GTEx pantissue |
 |
| Cancer(tissue) type-specific expression level of Translation factor using z-score distriution |
 |
| Differential expression between tumor and matched normal (in the cancer types with more than 10 matched samples) |
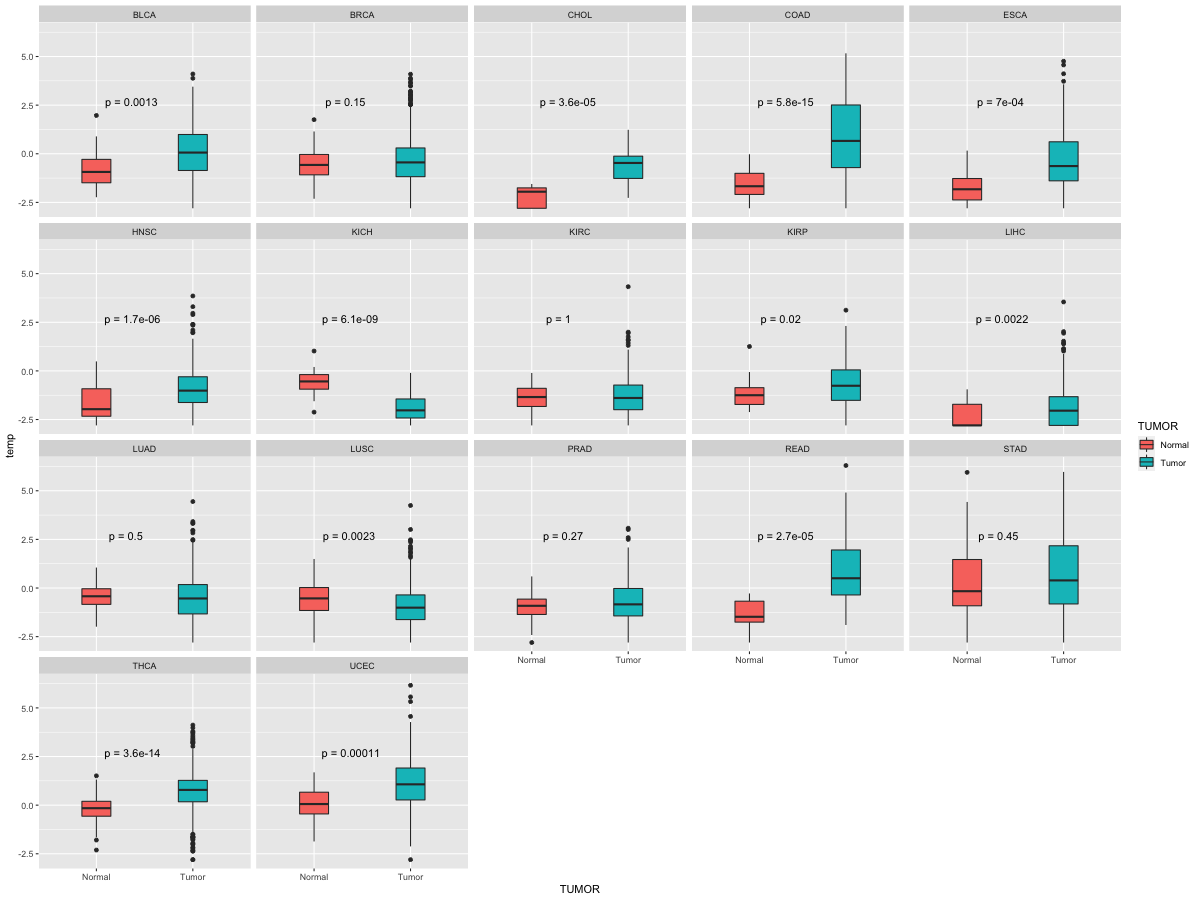 |
| Cancer type | Translation factor | FC | adj.pval |
| CHOL | NANOS3 | -3.55083213833258 | 0.00390625 |
| KICH | NANOS3 | 1.8074576054954 | 2.5629997253418e-06 |
Top |
|
| Translation factor expression regulation through miRNA binding |
| Cancer type | Gene | miRNA | TargetScan binding score (Context++ score percentile) | Coefficient | Pvalue |
| Translation factor expression regulation through methylation in the promoter of Translation factor |
 |
| Cancer type | Gene | methyl group b | methyl group a | DEG pval | avg methyl in b | avg methyl in a | avg exp in b | avg exp in a |
| Translation factor expression regulation through methylation in the gene body of Translation factor (positive regulation) |
 |
| Cancer type | Gene | methyl group b | methyl group a | DEG pval | avg methyl in b | avg methyl in a | avg exp in b | avg exp in a |
| Translation factor expression regulation through copy number variation of Translation factor |
 |
| Cancer type | Gene | Coefficient | Pvalue |
| ESCA | NANOS3 | 0.020082773 | 0.00027435 |
Top |
|
| Strongly correlated genes belong to cellular important gene groups with NANOS3 (coefficient>0.8, pval<0.05, node color based on FC between tumor and matched normal). Significantly associated important genes in the individual cancer types. * Cell metabolism gene: cell metabolism genes from REACTOME (black edge), IUPHAR: drug target genes from IUPHAR (blue edge), Kinase: human kinase genes (brown edge), CGC: cancer gene census genes (orange edge), TSG: tumor suppresor genes (purple edge), Epifactor: epigenetic factors (light blue edge), TF: transcription factors (green) |
 |
| Cancer type | Gene group | Translation factor | Correlated gene | Coefficient | Pvalue |
| TGCT | Cell metabolism gene | NANOS3 | GCAT | 0.810525974 | 1.32E-37 |
| TGCT | Cell metabolism gene | NANOS3 | AWAT2 | 0.819696586 | 4.21E-39 |
| TGCT | Cell metabolism gene | NANOS3 | MUC21 | 0.830111138 | 6.62E-41 |
| TGCT | Cell metabolism gene | NANOS3 | AGPAT6 | 0.839754811 | 1.09E-42 |
| TGCT | Cell metabolism gene | NANOS3 | GIP | 0.852857112 | 2.60E-45 |
| TGCT | Cell metabolism gene | NANOS3 | GMPR | 0.85448947 | 1.18E-45 |
| TGCT | Cell metabolism gene | NANOS3 | ELOVL3 | 0.907794101 | 5.45E-60 |
| TGCT | CGC | NANOS3 | PRDM1 | 0.800804038 | 4.15E-36 |
| TGCT | CGC | NANOS3 | ELL | 0.869391538 | 5.22E-49 |
| TGCT | CGC | NANOS3 | TCL1A | 0.883647016 | 1.26E-52 |
| TGCT | Epifactor | NANOS3 | PRDM1 | 0.800804038 | 4.15E-36 |
| TGCT | Epifactor | NANOS3 | BMI1 | 0.806146908 | 6.38E-37 |
| TGCT | Epifactor | NANOS3 | GATAD2A | 0.818701809 | 6.18E-39 |
| TGCT | IUPHAR | NANOS3 | IFI16 | 0.808904677 | 2.37E-37 |
| TGCT | IUPHAR | NANOS3 | TRPC5 | 0.813159223 | 5.00E-38 |
| TGCT | IUPHAR | NANOS3 | KCNK13 | 0.819329219 | 4.86E-39 |
| TGCT | IUPHAR | NANOS3 | ABCC12 | 0.833318633 | 1.74E-41 |
| TGCT | IUPHAR | NANOS3 | NLRP9 | 0.839383838 | 1.28E-42 |
| TGCT | IUPHAR | NANOS3 | KCNA2 | 0.856058269 | 5.44E-46 |
| TGCT | IUPHAR | NANOS3 | AQP6 | 0.859830677 | 8.20E-47 |
| TGCT | IUPHAR | NANOS3 | HCN4 | 0.865226197 | 4.96E-48 |
| TGCT | IUPHAR | NANOS3 | SLC5A7 | 0.906634605 | 1.36E-59 |
| TGCT | IUPHAR | NANOS3 | SLC43A1 | 0.934148695 | 8.43E-71 |
| TGCT | TF | NANOS3 | PRDM1 | 0.800804038 | 4.15E-36 |
| TGCT | TF | NANOS3 | ZNF341 | 0.801444358 | 3.33E-36 |
| TGCT | TF | NANOS3 | ZNF571 | 0.803222626 | 1.79E-36 |
| TGCT | TF | NANOS3 | ZNF781 | 0.803324799 | 1.73E-36 |
| TGCT | TF | NANOS3 | ZNF569 | 0.815788824 | 1.87E-38 |
| TGCT | TF | NANOS3 | ZNF428 | 0.816174417 | 1.62E-38 |
| TGCT | TF | NANOS3 | ZNF610 | 0.81726711 | 1.07E-38 |
| TGCT | TF | NANOS3 | ZNF14 | 0.8183058 | 7.19E-39 |
| TGCT | TF | NANOS3 | GATAD2A | 0.818701809 | 6.18E-39 |
| TGCT | TF | NANOS3 | ZNF547 | 0.820446854 | 3.15E-39 |
| TGCT | TF | NANOS3 | THAP8 | 0.834206751 | 1.19E-41 |
| TGCT | TF | NANOS3 | ZNF526 | 0.853892401 | 1.58E-45 |
| TGCT | TF | NANOS3 | ZNF766 | 0.858184371 | 1.89E-46 |
| TGCT | TF | NANOS3 | DMRT1 | 0.878799764 | 2.41E-51 |
| TGCT | TF | NANOS3 | BNC1 | 0.887388482 | 1.18E-53 |
| TGCT | TSG | NANOS3 | PRDM1 | 0.800804038 | 4.15E-36 |
| TGCT | TSG | NANOS3 | IFI16 | 0.808904677 | 2.37E-37 |
| TGCT | TSG | NANOS3 | CDK2AP1 | 0.809837952 | 1.69E-37 |
| TGCT | TSG | NANOS3 | LZTS1 | 0.814148117 | 3.46E-38 |
| TGCT | TSG | NANOS3 | CSMD1 | 0.84728527 | 3.63E-44 |
Top |
|
| Protein 3D structure Visit iCn3D. |
Top |
|
| Protein-protein interaction networks * Overlap between up-regulated DEGs (log2FC<-1 and adj.P<0.05) and STRING PPI network (center: Translation factor, node: DEGs, edges: weighted by -log2(adj.P)) |
 |
| Overlap between down-regulated DEGs (log2FC>1 and adj.P<0.05) and STRING PPI network (center: Translation factor, node: DEGs, edges: weighted by -log2(adj.P)) |
 |
 * Edge colors based on TCGA cancer types. |
| * Overlap between DEGs (log2FC>1 and adj.P<0.05) and STRING PPI network per cancer (center: Translation factor, node: DEGs, node color: log2FC, edges: weighted by -log2(adj.P)) |
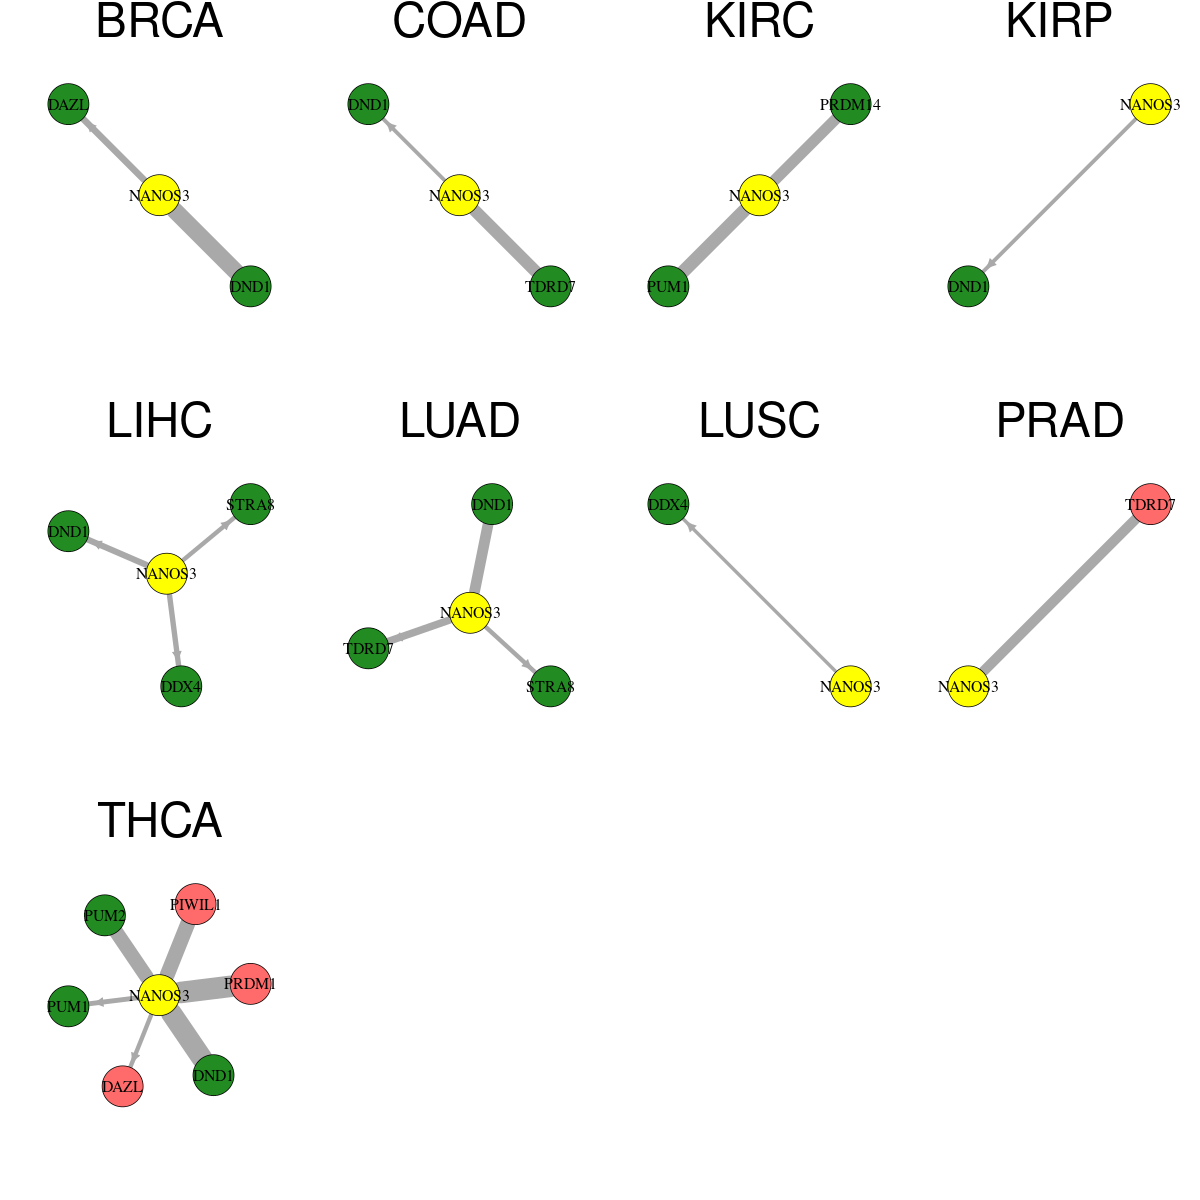 |
| Cancer type | Translation factor | Interacting protein coding gene | FC | adj.pval |
| LUAD | NANOS3 | TDRD7 | -5.32549817757915 | 0.00100010249745768 |
| BRCA | NANOS3 | DAZL | -2.20715286337894 | 0.00225146058865309 |
| LIHC | NANOS3 | DND1 | -3.89179043999306 | 0.0033398145023608 |
| LIHC | NANOS3 | DDX4 | -1.38709810298453 | 0.00693140429335888 |
| THCA | NANOS3 | PUM1 | -1.96241697156045 | 0.0106190889115253 |
| LUAD | NANOS3 | STRA8 | -1.41754146083021 | 0.0167287003897047 |
| LIHC | NANOS3 | STRA8 | -3.87887257303094 | 0.0170556294065931 |
| THCA | NANOS3 | DAZL | 1.75658759829506 | 0.0178581180286603 |
| KIRP | NANOS3 | DND1 | -2.49943289242313 | 0.0279771662317216 |
| COAD | NANOS3 | DND1 | -1.48588602291338 | 0.0291509032249451 |
| LUSC | NANOS3 | DDX4 | -1.95443502746625 | 0.0421700405387188 |
| THCA | NANOS3 | PIWIL1 | 1.03261884319603 | 1.02220761620756e-06 |
| COAD | NANOS3 | TDRD7 | -1.15983938529281 | 1.33216381072998e-05 |
| BRCA | NANOS3 | DND1 | -1.16039496976923 | 1.73769696617764e-07 |
| THCA | NANOS3 | PUM2 | -1.39880758764172 | 1.87410187143234e-06 |
| THCA | NANOS3 | PRDM1 | 1.56256807667019 | 2.20724500943986e-09 |
| KIRC | NANOS3 | PRDM14 | -3.53697173732648 | 3.60241778081952e-05 |
| LUAD | NANOS3 | DND1 | -2.01712494132399 | 4.57458841817018e-05 |
| THCA | NANOS3 | DND1 | -1.6376184969496 | 4.60078709441939e-09 |
| KIRC | NANOS3 | PUM1 | -2.76249172813289 | 5.12753234766593e-06 |
| PRAD | NANOS3 | TDRD7 | 1.20035553038449 | 8.50750576591638e-05 |
| Protein-protein interactors with this translation factor (BIOGRID-3.4.160) |
| PPI interactors with NANOS3 |
| PUM2, CNOT1, CNOT3, DMRT1, SIAH1, PSMB1, MLH1, CIB3, TEKT4, IMP3, CIT, AURKB, CHMP4B, KIF14, KIF20A, PRC1, |
Top |
|
| Clinically associated variants from ClinVar. |
| Gene | Chr | Position | RefSeq | VarSeq | RefSeeq | VarType | Pathogenic | Disease | VarInfo |
| NANOS3 | chr19 | 13988181 | T | TGGAGCCGGTGTCAGCGCC | Insertion | Benign | not_provided | SO:0001821|inframe_insertion | SO:0001821|inframe_insertion |
| NANOS3 | chr19 | 13988558 | C | CGAG | Microsatellite | Benign | not_provided | SO:0001619|non-coding_transcript_variant,SO:0001821|inframe_insertion | SO:0001619|non-coding_transcript_variant,SO:0001821|inframe_insertion |
| nsSNVs with sample frequency (size of circle) from TCGA 33 cancers. |
 |
| SNVs and Indels |
| Gene | Cancer type | Chromosome | Start | End | RefSeeq | MutSeq | Mutation type | AAchange | # samples |
| NANOS3 | HNSC | chr19 | 13988559 | 13988561 | GAG | - | In_Frame_Del | p.RG147del | 5 |
| NANOS3 | SKCM | chr19 | 13988138 | 13988138 | C | T | Missense_Mutation | p.P26S | 3 |
| NANOS3 | BLCA | chr19 | 13991286 | 13991286 | C | T | Missense_Mutation | 2 | |
| NANOS3 | PAAD | chr19 | 13988311 | 13988311 | C | T | Silent | 2 | |
| NANOS3 | UCEC | chr19 | 13988256 | 13988256 | G | A | Missense_Mutation | p.R65H | 2 |
| NANOS3 | LIHC | chr19 | 13988465 | 13988465 | T | A | Missense_Mutation | 2 | |
| NANOS3 | UCEC | chr19 | 13988362 | 13988362 | C | T | Silent | p.G100 | 2 |
| NANOS3 | PAAD | chr19 | 13988311 | 13988311 | C | T | Silent | p.N64N | 2 |
| NANOS3 | ESCA | chr19 | 13988559 | 13988559 | G | T | Missense_Mutation | p.R166L | 2 |
| NANOS3 | BLCA | chr19 | 13991286 | 13991286 | C | T | Missense_Mutation | p.S164L | 2 |
| NANOS3 | SKCM | chr19 | 13988108 | 13988108 | C | T | Silent | p.L16L | 2 |
| NANOS3 | SKCM | chr19 | 13988354 | 13988354 | G | A | Missense_Mutation | p.E79K | 2 |
| NANOS3 | STAD | chr19 | 13988423 | 13988423 | C | T | Missense_Mutation | p.R121C | 2 |
| NANOS3 | KIRP | chr19 | 13988558 | 13988559 | - | GAG | In_Frame_Ins | p.146_147insE | 2 |
| NANOS3 | STAD | chr19 | 13988417 | 13988417 | C | T | Missense_Mutation | p.R119C | 2 |
| NANOS3 | KIRP | chr19 | 13988494 | 13988494 | A | G | Silent | p.R144R | 2 |
| NANOS3 | STAD | chr19 | 13988458 | 13988458 | C | T | Silent | p.G132G | 2 |
| NANOS3 | BRCA | chr19 | 13988416 | 13988416 | A | G | Silent | p.T118 | 1 |
| NANOS3 | SKCM | chr19 | 13988377 | 13988377 | C | T | Silent | p.P86P | 1 |
| NANOS3 | KIRP | chr19 | 13988558 | 13988559 | - | GAG | In_Frame_Ins | p.171_172insG | 1 |
| NANOS3 | THCA | chr19 | 13991282 | 13991282 | C | T | Missense_Mutation | p.P163S | 1 |
| NANOS3 | COAD | chr19 | 13988181 | 13988182 | - | GGAGCCGGTGTCAGCGCC | In_Frame_Ins | p.L40delinsLEPVSAP | 1 |
| NANOS3 | SKCM | chr19 | 13988141 | 13988141 | G | A | Missense_Mutation | p.E27K | 1 |
| NANOS3 | KIRP | chr19 | 13988364 | 13988364 | G | T | Missense_Mutation | 1 | |
| NANOS3 | PAAD | chr19 | 13988311 | 13988311 | C | T | Silent | p.N83N | 1 |
| NANOS3 | BLCA | chr19 | 13988525 | 13988525 | G | A | Missense_Mutation | p.D136N | 1 |
| NANOS3 | COAD | chr19 | 13988322 | 13988322 | G | T | Missense_Mutation | p.R87L | 1 |
| NANOS3 | SKCM | chr19 | 13988320 | 13988320 | C | T | Silent | p.S67S | 1 |
| NANOS3 | BLCA | chr19 | 13988426 | 13988426 | G | A | Missense_Mutation | p.A103T | 1 |
| NANOS3 | COAD | chr19 | 13988558 | 13988559 | - | GAGGAG | In_Frame_Ins | p.R166delinsRGG | 1 |
| NANOS3 | SKCM | chr19 | 13988295 | 13988295 | C | T | Missense_Mutation | p.S59F | 1 |
| NANOS3 | LIHC | chr19 | 13988407 | 13988407 | C | T | Silent | p.C115C | 1 |
| NANOS3 | BLCA | chr19 | 13988556 | 13988556 | G | T | Missense_Mutation | p.R146L | 1 |
| NANOS3 | SARC | chr19 | 13991267 | 13991267 | G | T | Missense_Mutation | 1 | |
| NANOS3 | SKCM | chr19 | 13988435 | 13988435 | C | T | Nonsense_Mutation | p.R106* | 1 |
| NANOS3 | LIHC | chr19 | 13988465 | 13988465 | T | A | Missense_Mutation | p.Y135N | 1 |
| NANOS3 | BLCA | chr19 | 13988397 | 13988397 | G | A | Missense_Mutation | p.C93Y | 1 |
| NANOS3 | SKCM | chr19 | 13988290 | 13988290 | G | T | Silent | p.L76L | 1 |
| NANOS3 | SKCM | chr19 | 13988159 | 13988159 | C | A | Missense_Mutation | p.Q33K | 1 |
| NANOS3 | LIHC | chr19 | 13988410 | 13988410 | C | A | Silent | p.G116G | 1 |
| NANOS3 | BLCA | chr19 | 13988429 | 13988429 | C | T | Missense_Mutation | p.H104Y | 1 |
| NANOS3 | SKCM | chr19 | 13988320 | 13988320 | C | T | Silent | p.S86S | 1 |
| NANOS3 | HNSC | chr19 | 13991286 | 13991286 | C | T | Missense_Mutation | p.S183L | 1 |
| NANOS3 | SKCM | chr19 | 13988290 | 13988290 | G | T | Silent | p.L57L | 1 |
| NANOS3 | LIHC | chr19 | 13988465 | 13988465 | T | A | Missense_Mutation | p.Y116N | 1 |
| NANOS3 | HNSC | chr19 | 13988559 | 13988561 | GAG | - | In_Frame_Del | p.G171del | 1 |
| NANOS3 | LUAD | chr19 | 13991269 | 13991269 | C | T | Silent | p.A158A | 1 |
| NANOS3 | BLCA | chr19 | 13988556 | 13988556 | G | T | Missense_Mutation | p.R165L | 1 |
| NANOS3 | KIRP | chr19 | 13988494 | 13988494 | A | G | Silent | p.R125R | 1 |
| NANOS3 | LUAD | chr19 | 13988558 | 13988558 | C | T | Nonsense_Mutation | p.R147* | 1 |
| NANOS3 | BLCA | chr19 | 13988397 | 13988397 | G | A | Missense_Mutation | p.C112Y | 1 |
| NANOS3 | SKCM | chr19 | 13988354 | 13988354 | G | A | Missense_Mutation | p.E98K | 1 |
| NANOS3 | BLCA | chr19 | 13988556 | 13988556 | G | T | Missense_Mutation | 1 | |
| NANOS3 | LUSC | chr19 | 13985806 | 13985806 | G | T | RNA | 1 | |
| NANOS3 | BLCA | chr19 | 13988429 | 13988429 | C | T | Missense_Mutation | p.H123Y | 1 |
| NANOS3 | SKCM | chr19 | 13988132 | 13988132 | G | A | Missense_Mutation | p.E24K | 1 |
| NANOS3 | BLCA | chr19 | 13988397 | 13988397 | G | A | Missense_Mutation | 1 | |
| NANOS3 | LUSC | chr19 | 13988533 | 13988533 | G | A | Silent | p.A157A | 1 |
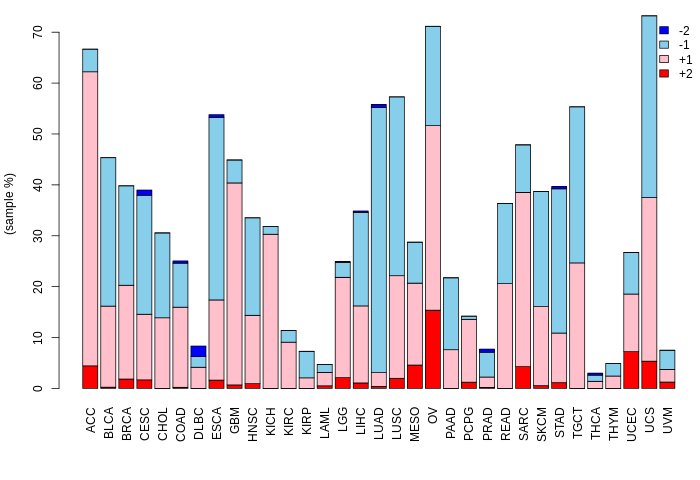
| Copy number variation (CNV) of NANOS3 * Click on the image to open the original image in a new window. |
 |
| Fusion gene breakpoints (product of the structural variants (SVs)) across NANOS3 * Click on the image to open the UCSC genome browser with custom track showing this image in a new window. |
 |
| Fusion genes with this translation factor from FusionGDB2.0. |
| FusionGDB2 ID | Disease | Sample | Hgene | Hchr | Hbp | Hstrand | Tgene | Tchr | Tbp | Tstrand |
| 69616 | STAD | TCGA-BR-8058-01A | NANOS3 | chr19 | 13973008 | + | SAMD1 | chr19 | 14200174 | - |
| 103106 | THYM | TCGA-XU-A92V-01A | SBNO2 | chr19 | 1147308 | - | NANOS3 | chr19 | 13991256 | + |
| 103106 | BLCA | TCGA-FD-A3SR-01A | ZNF254 | chr19 | 24229081 | + | NANOS3 | chr19 | 13991256 | + |
| 103106 | SKCM | TCGA-DA-A1I0-06A | ZNF57 | chr19 | 2901046 | + | NANOS3 | chr19 | 13991256 | + |
| 103109 | LGG | TCGA-S9-A7IZ-01A | ZNF91 | chr19 | 23578127 | - | NANOS3 | chr19 | 13991256 | + |
Top |
|
| Kaplan-Meier plots with logrank tests of overall survival (OS) |
 |
| Cancer type | Translation factor | Coefficent | Hazard ratio | Wald test pval | Likelihool ratio pval | Logrank test pval | # samples |
Top |
|
| Differential gene expression between female and male. (Wilcoxon test, pval<0.05) |
 |
| Cancer type | Translation factor | pval | adj.p |
| MESO | NANOS3 | 0.00897369329233724 | 0.25 |
| TGCT | NANOS3 | 0.0121376998711203 | 0.33 |
| HNSC | NANOS3 | 0.0205438429569787 | 0.53 |
| BLCA | NANOS3 | 0.024802693666011 | 0.62 |
| LUSC | NANOS3 | 0.0364793012180875 | 0.88 |
Top |
|
| Differential gene expression between young and old age groups (Wilcoxon test, pval<0.05) |
| Cancer type | Translation factor | pval | adj.p |
| LUAD | NANOS3 | 0.00465489392443551 | 0.15 |
| BRCA | NANOS3 | 0.00742047800277233 | 0.23 |
| CESC | NANOS3 | 0.000310981290427067 | 0.01 |
| PCPG | NANOS3 | 0.0268128183462912 | 0.8 |
| THYM | NANOS3 | 0.0403341594774081 | 1 |
Top |
|
| Drugs targeting genes involved in this translation factor. (DrugBank Version 5.1.8 2021-05-08) |
| UniProtAcc | DrugBank ID | Drug name | Drug activity | Drug type | Drug status |
Top |
|
| Diseases associated with this translation factor. (DisGeNet 4.0) |
| Disease ID | Disease Name | # PubMeds | Disease source |
| C0085215 | Ovarian Failure, Premature | 1 | GENOMICS_ENGLAND |
(UTHealth)
Web File Viewing | Emergency Information |Campus Carry|Site Policies