
|
||||||
|

Translation Factor: DND1 (NCBI Gene ID:373863) |
|
 Gene Summary Gene Summary |
| Gene Information | Gene Name: DND1 | Gene ID: 373863 | Gene Symbol | DND1 | Gene ID | 373863 |
| Gene Name | DND microRNA-mediated repression inhibitor 1 | |
| Synonyms | RBMS4 | |
| Cytomap | 5q31.3 | |
| Type of Gene | protein-coding | |
| Description | dead end protein homolog 1RNA-binding motif, single-stranded-interacting protein 4dead end homolog 1 | |
| Modification date | 20200313 | |
| UniProtAcc | Q8IYX4 | |
| Child GO biological process term(s) under GO:0006412 |
| GO ID | GO term |
| GO:0017148 | Negative regulation of translation |
| GO:0006417 | Regulation of translation |
| GO:0006412 | Translation |
| Gene ontology of translaction factor with evidence of Inferred from Direct Assay (IDA) from Entrez |
| Partner | Gene | GO ID | GO term | PubMed ID |
| Hgene | DND1 | GO:0060965 | negative regulation of gene silencing by miRNA | 18155131 |
| Hgene | DND1 | GO:0061158 | 3'-UTR-mediated mRNA destabilization | 28297718 |
| Inferred gene age of translation factor. |
| Gene | Inferred gene age group among (0 - 67.6], (67.6 - 355.7], (355.7 - 733], (733 - 1119.25], >1119.25 |
| DND1 | (355.7 - 733] |
Top |
|
| We searched PubMed using 'DND1[title] AND translation [title] AND human.' |
| Gene | Title | PMID |
| DND1 | . | . |
Top |
|
| Skipped exons in TCGA and GTEx based on Ensembl gene isoform structure. * Click on the image to open the UCSC genome browser with custom track showing this image in a new window. For more annotations, please visit our ExonSkipDB. |
 |
| Open reading frame (ORF) analsis of exon skipping events based on Ensembl gene isoform structure. * Click on the break point to see the gene structure around the break point region using the UCSC Genome Browser. |
| ENST | Exon skip start (DNA) | Exon Skip end (DNA) | ORF |
| Exon skipping position in the amino acid sequence. |
| ENST | Exon skip start (DNA) | Exon Skip end (DNA) | Len(transcript seq) | Exon skip start (mRNA) | Exon Skip end (mRNA) | Len(amino acid seq) | Exon skip start (AA) | Exon Skip end (AA) |
| Potentially (partially) lost protein functional features of UniProt. |
| UniProtAcc | Exon skip start (AA) | Exon Skip end (AA) | Function feature start (AA) | Function feature end (AA) | Functional feature type | Functional feature desc. |
Top |
|
| Gene expression level across TCGA pancancer |
 |
| Gene expression level across GTEx pantissue |
 |
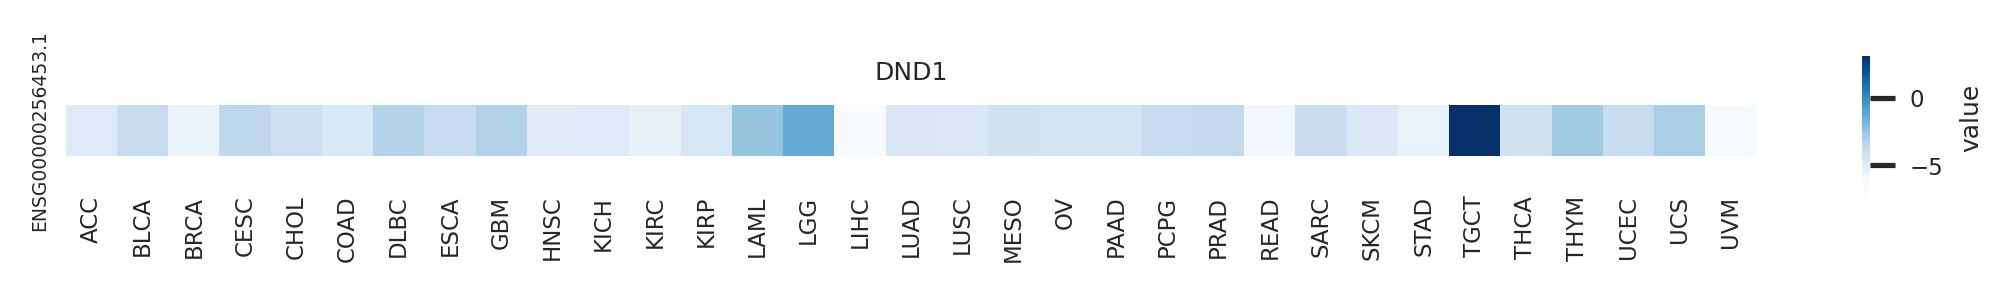
| Expression level of gene isoforms across TCGA pancancer |
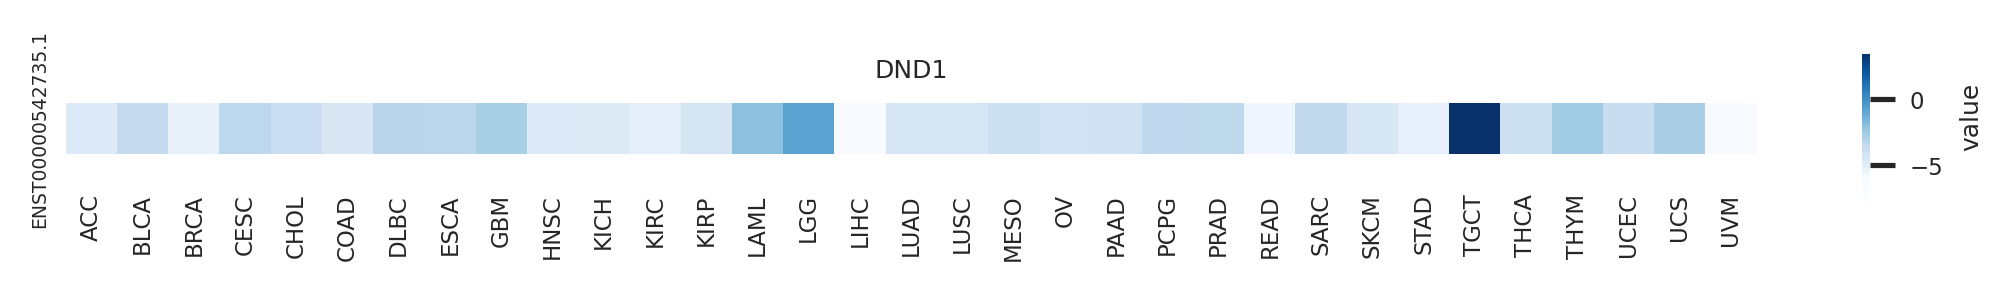 |
| Expression level of gene isoforms across GTEx pantissue |
 |
| Cancer(tissue) type-specific expression level of Translation factor using z-score distriution |
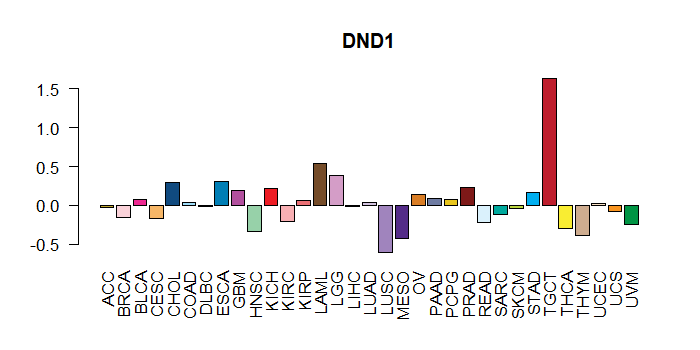 |
| Differential expression between tumor and matched normal (in the cancer types with more than 10 matched samples) |
 |
| Cancer type | Translation factor | FC | adj.pval |
| LIHC | DND1 | -3.89179043999306 | 0.0033398145023608 |
| KIRP | DND1 | -2.49943289242313 | 0.0279771662317216 |
| COAD | DND1 | -1.48588602291338 | 0.0291509032249451 |
| BRCA | DND1 | -1.16039496976923 | 1.73769696617764e-07 |
| LUAD | DND1 | -2.01712494132399 | 4.57458841817018e-05 |
| THCA | DND1 | -1.6376184969496 | 4.60078709441939e-09 |
Top |
|
| Translation factor expression regulation through miRNA binding |
| Cancer type | Gene | miRNA | TargetScan binding score (Context++ score percentile) | Coefficient | Pvalue |
| Translation factor expression regulation through methylation in the promoter of Translation factor |
 |
| Cancer type | Gene | methyl group b | methyl group a | DEG pval | avg methyl in b | avg methyl in a | avg exp in b | avg exp in a |
| Translation factor expression regulation through methylation in the gene body of Translation factor (positive regulation) |
 |
| Cancer type | Gene | methyl group b | methyl group a | DEG pval | avg methyl in b | avg methyl in a | avg exp in b | avg exp in a |
| Translation factor expression regulation through copy number variation of Translation factor |
 |
| Cancer type | Gene | Coefficient | Pvalue |
Top |
|
| Strongly correlated genes belong to cellular important gene groups with DND1 (coefficient>0.8, pval<0.05, node color based on FC between tumor and matched normal). Significantly associated important genes in the individual cancer types. * Cell metabolism gene: cell metabolism genes from REACTOME (black edge), IUPHAR: drug target genes from IUPHAR (blue edge), Kinase: human kinase genes (brown edge), CGC: cancer gene census genes (orange edge), TSG: tumor suppresor genes (purple edge), Epifactor: epigenetic factors (light blue edge), TF: transcription factors (green) |
 |
| Cancer type | Gene group | Translation factor | Correlated gene | Coefficient | Pvalue |
| TGCT | Cell metabolism gene | DND1 | PDE6G | 0.804792955 | 1.03E-36 |
| TGCT | Cell metabolism gene | DND1 | CCT5 | 0.808310467 | 2.94E-37 |
| TGCT | Cell metabolism gene | DND1 | SLC25A16 | 0.812079671 | 7.45E-38 |
| TGCT | Cell metabolism gene | DND1 | PSMD12 | 0.813202437 | 4.92E-38 |
| TGCT | Cell metabolism gene | DND1 | TUBA1C | 0.834300367 | 1.15E-41 |
| TGCT | Cell metabolism gene | DND1 | HSPA9 | 0.857437455 | 2.74E-46 |
| TGCT | Cell metabolism gene | DND1 | TEAD4 | 0.86987334 | 4.01E-49 |
| TGCT | Cell metabolism gene | DND1 | POLR3G | 0.901282097 | 8.07E-58 |
| TGCT | Cell metabolism gene | DND1 | UPP1 | 0.918850847 | 4.50E-64 |
| TGCT | CGC | DND1 | FOXR1 | 0.818271681 | 7.29E-39 |
| TGCT | CGC | DND1 | POU5F1 | 0.8453151 | 9.00E-44 |
| TGCT | CGC | DND1 | ETV4 | 0.866948421 | 1.97E-48 |
| TGCT | Epifactor | DND1 | ASH2L | 0.800554565 | 4.52E-36 |
| TGCT | Epifactor | DND1 | PRDM14 | 0.862523187 | 2.05E-47 |
| TGCT | IUPHAR | DND1 | KCNG3 | 0.80454182 | 1.13E-36 |
| TGCT | IUPHAR | DND1 | PDE6G | 0.804792955 | 1.03E-36 |
| TGCT | IUPHAR | DND1 | NLRP2 | 0.809741792 | 1.75E-37 |
| TGCT | IUPHAR | DND1 | MMP24 | 0.810147758 | 1.51E-37 |
| TGCT | IUPHAR | DND1 | SLC25A16 | 0.812079671 | 7.45E-38 |
| TGCT | IUPHAR | DND1 | GJA10 | 0.818040356 | 7.96E-39 |
| TGCT | IUPHAR | DND1 | HCN2 | 0.819178735 | 5.14E-39 |
| TGCT | IUPHAR | DND1 | SLC45A4 | 0.874037776 | 3.87E-50 |
| TGCT | IUPHAR | DND1 | NLRP7 | 0.87428714 | 3.35E-50 |
| TGCT | TF | DND1 | NFE2L3 | 0.811115839 | 1.06E-37 |
| TGCT | TF | DND1 | FOXR1 | 0.818271681 | 7.29E-39 |
| TGCT | TF | DND1 | VENTX | 0.828562994 | 1.25E-40 |
| TGCT | TF | DND1 | ZNF90 | 0.831556162 | 3.64E-41 |
| TGCT | TF | DND1 | MYBL2 | 0.832499892 | 2.45E-41 |
| TGCT | TF | DND1 | POU5F1 | 0.8453151 | 9.00E-44 |
| TGCT | TF | DND1 | POU5F1B | 0.859381487 | 1.03E-46 |
| TGCT | TF | DND1 | NANOG | 0.859482 | 9.79E-47 |
| TGCT | TF | DND1 | PRDM14 | 0.862523187 | 2.05E-47 |
| TGCT | TF | DND1 | ETV4 | 0.866948421 | 1.97E-48 |
| TGCT | TF | DND1 | ZNF589 | 0.868204243 | 1.00E-48 |
| TGCT | TF | DND1 | TEAD4 | 0.86987334 | 4.01E-49 |
| TGCT | TF | DND1 | ZNF296 | 0.871849217 | 1.34E-49 |
Top |
|
| Protein 3D structure Visit iCn3D. |
Top |
|
| Protein-protein interaction networks * Overlap between up-regulated DEGs (log2FC<-1 and adj.P<0.05) and STRING PPI network (center: Translation factor, node: DEGs, edges: weighted by -log2(adj.P)) |
 |
| Overlap between down-regulated DEGs (log2FC>1 and adj.P<0.05) and STRING PPI network (center: Translation factor, node: DEGs, edges: weighted by -log2(adj.P)) |
 |
 * Edge colors based on TCGA cancer types. |
| * Overlap between DEGs (log2FC>1 and adj.P<0.05) and STRING PPI network per cancer (center: Translation factor, node: DEGs, node color: log2FC, edges: weighted by -log2(adj.P)) |
 |
| Cancer type | Translation factor | Interacting protein coding gene | FC | adj.pval |
| LUAD | DND1 | TDRD7 | -5.32549817757915 | 0.00100010249745768 |
| BRCA | DND1 | DAZL | -2.20715286337894 | 0.00225146058865309 |
| CHOL | DND1 | NANOS3 | -3.55083213833258 | 0.00390625 |
| CHOL | DND1 | TRIM36 | -2.92419777749776 | 0.00390625 |
| LUAD | DND1 | NANOS1 | -1.26823330280835 | 0.00598625106474388 |
| LIHC | DND1 | DDX4 | -1.38709810298453 | 0.00693140429335888 |
| THCA | DND1 | DAZL | 1.75658759829506 | 0.0178581180286603 |
| LUSC | DND1 | DDX4 | -1.95443502746625 | 0.0421700405387188 |
| THCA | DND1 | PIWIL1 | 1.03261884319603 | 1.02220761620756e-06 |
| BLCA | DND1 | RBPMS2 | -9.19886836304731 | 1.1444091796875e-05 |
| COAD | DND1 | TDRD7 | -1.15983938529281 | 1.33216381072998e-05 |
| STAD | DND1 | RBPMS2 | -2.4464031312502 | 1.49570405483246e-06 |
| KIRP | DND1 | RBPMS2 | -2.35527114075536 | 1.60322524607182e-05 |
| BRCA | DND1 | NANOS1 | -1.41685984384344 | 2.51697598290495e-14 |
| KICH | DND1 | NANOS3 | 1.8074576054954 | 2.5629997253418e-06 |
| HNSC | DND1 | TRIM36 | -1.6287009728057 | 2.97245203455532e-05 |
| COAD | DND1 | TRIM36 | -1.08457255405967 | 3.18586826324463e-05 |
| THCA | DND1 | TRIM36 | -3.35165741825221 | 4.51575817117494e-07 |
| KIRP | DND1 | TRIM36 | -1.20520106680586 | 4.5965425670147e-06 |
| KIRC | DND1 | TRIM36 | -1.96642661116514 | 5.71432193876037e-10 |
| PRAD | DND1 | TDRD7 | 1.20035553038449 | 8.50750576591638e-05 |
| Protein-protein interactors with this translation factor (BIOGRID-3.4.160) |
| PPI interactors with DND1 |
| HSPA1L, TRAP1, PAIP2B, RALGAPB, ATXN3, PAIP1, EMB, VCPIP1, APOBEC1, ACTR3C, LATS2, RBPMS2, FLNA, HSP90AA4P, APOBEC3F, EIF2AK3, HNRNPCL1, LCMT1, |
Top |
|
| Clinically associated variants from ClinVar. |
| Gene | Chr | Position | RefSeq | VarSeq | RefSeeq | VarType | Pathogenic | Disease | VarInfo |
| nsSNVs with sample frequency (size of circle) from TCGA 33 cancers. |
 |
| SNVs and Indels |
| Gene | Cancer type | Chromosome | Start | End | RefSeeq | MutSeq | Mutation type | AAchange | # samples |
| DND1 | BLCA | chr5 | 140052285 | 140052285 | T | - | Frame_Shift_Del | p.T117fs | 35 |
| DND1 | BLCA | chr5 | 140050940 | 140050940 | C | T | Missense_Mutation | 14 | |
| DND1 | KIRP | chr5 | 140052469 | 140052469 | T | C | Silent | p.P55P | 7 |
| DND1 | BRCA | chr5 | 140050940 | 140050940 | C | T | Missense_Mutation | p.E334K | 6 |
| DND1 | BLCA | chr5 | 140050926 | 140050926 | G | A | Silent | 5 | |
| DND1 | PCPG | chr5 | 140052407 | 140052407 | G | A | Missense_Mutation | p.P76L | 4 |
| DND1 | SKCM | chr5 | 140052887 | 140052887 | G | A | Silent | p.N37N | 3 |
| DND1 | COAD | chr5 | 140052271 | 140052271 | A | G | Silent | p.H121H | 3 |
| DND1 | BLCA | chr5 | 140050907 | 140050907 | C | T | Missense_Mutation | 3 | |
| DND1 | COAD | chr5 | 140052430 | 140052430 | G | T | Missense_Mutation | p.D68E | 3 |
| DND1 | PAAD | chr5 | 140052939 | 140052939 | G | A | Missense_Mutation | p.A20V | 3 |
| DND1 | UCEC | chr5 | 140051176 | 140051176 | G | A | Missense_Mutation | p.A255V | 2 |
| DND1 | UCEC | chr5 | 140051267 | 140051267 | G | A | Missense_Mutation | p.R225C | 2 |
| DND1 | COAD | chr5 | 140052424 | 140052424 | G | A | Silent | p.Y70Y | 2 |
| DND1 | TGCT | chr5 | 140052912 | 140052912 | G | T | Missense_Mutation | p.T29K | 2 |
| DND1 | BLCA | chr5 | 140052881 | 140052881 | C | T | Silent | p.Q39Q | 2 |
| DND1 | BLCA | chr5 | 140052115 | 140052115 | G | A | Silent | p.S173S | 1 |
| DND1 | HNSC | chr5 | 140052314 | 140052314 | G | A | Missense_Mutation | p.S107L | 1 |
| DND1 | KIRC | chr5 | 140052863 | 140052863 | T | G | Silent | p.P45P | 1 |
| DND1 | READ | chr5 | 140051127 | 140051128 | AG | - | Frame_Shift_Del | p.271_272del | 1 |
| DND1 | READ | chr5 | 140051174 | 140051174 | G | A | Missense_Mutation | p.R256W | 1 |
| DND1 | COAD | chr5 | 140052126 | 140052126 | G | A | Silent | p.L170L | 1 |
| DND1 | KIRP | chr5 | 140051086 | 140051086 | C | T | Nonsense_Mutation | p.W285X | 1 |
| DND1 | COAD | chr5 | 140052244 | 140052244 | G | A | Silent | p.L130L | 1 |
| DND1 | LIHC | chr5 | 140052972 | 140052972 | A | G | Missense_Mutation | 1 | |
| DND1 | ACC | chr5 | 140052320 | 140052320 | T | C | Missense_Mutation | p.Y105C | 1 |
| DND1 | STAD | chr5 | 140052333 | 140052333 | C | T | Missense_Mutation | p.A101T | 1 |
| DND1 | LIHC | chr5 | 140052972 | 140052972 | A | G | Missense_Mutation | p.L9P | 1 |
| DND1 | STAD | chr5 | 140052406 | 140052406 | C | T | Silent | p.P76P | 1 |
| DND1 | LIHC | chr5 | 140052948 | 140052948 | T | C | Missense_Mutation | p.E17G | 1 |
| DND1 | TGCT | chr5 | 140052912 | 140052912 | G | T | Missense_Mutation | 1 | |
| DND1 | LUAD | chr5 | 140051034 | 140051034 | G | A | Silent | p.S302S | 1 |
| DND1 | DLBC | chr5 | 140051009 | 140051009 | G | A | Silent | p.L311L | 1 |
| DND1 | PAAD | chr5 | 140052939 | 140052939 | G | A | Missense_Mutation | 1 | |
| DND1 | BLCA | chr5 | 140052881 | 140052881 | C | T | Silent | 1 | |
| DND1 | THYM | chr5 | 140050938 | 140050938 | C | A | Missense_Mutation | 1 | |
| DND1 | DLBC | chr5 | 140050907 | 140050907 | C | T | Missense_Mutation | p.A345T | 1 |
| DND1 | PAAD | chr5 | 140052407 | 140052407 | G | A | Missense_Mutation | 1 | |
| DND1 | THYM | chr5 | 140050938 | 140050938 | C | A | Missense_Mutation | p.E334D | 1 |
| DND1 | GBM | chr5 | 140052370 | 140052370 | G | A | Silent | p.R88R | 1 |
| Copy number variation (CNV) of DND1 * Click on the image to open the original image in a new window. |
 |
| Fusion gene breakpoints (product of the structural variants (SVs)) across DND1 * Click on the image to open the UCSC genome browser with custom track showing this image in a new window. |
 |
| Fusion genes with this translation factor from FusionGDB2.0. |
| FusionGDB2 ID | Disease | Sample | Hgene | Hchr | Hbp | Hstrand | Tgene | Tchr | Tbp | Tstrand |
Top |
|
| Kaplan-Meier plots with logrank tests of overall survival (OS) |
 |
| Cancer type | Translation factor | Coefficent | Hazard ratio | Wald test pval | Likelihool ratio pval | Logrank test pval | # samples |
Top |
|
| Differential gene expression between female and male. (Wilcoxon test, pval<0.05) |
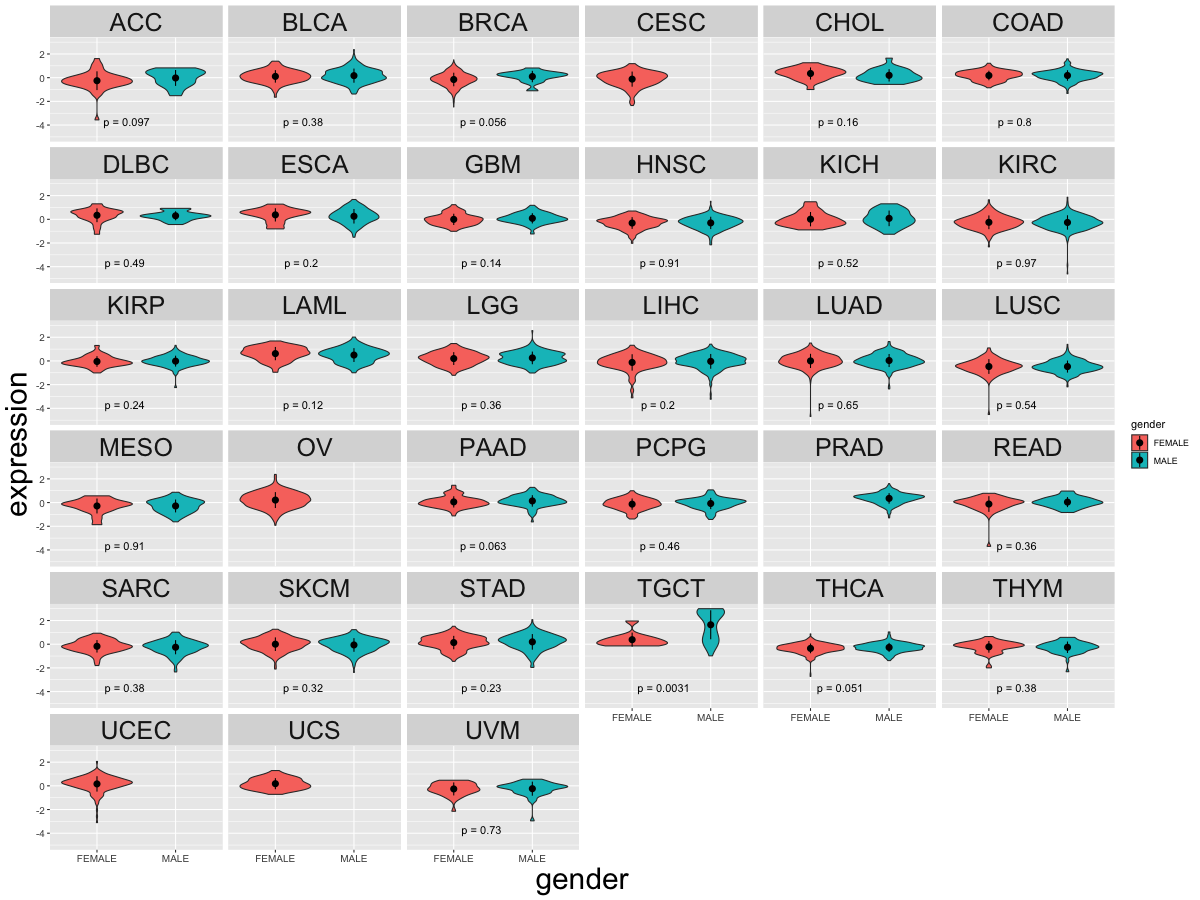 |
| Cancer type | Translation factor | pval | adj.p |
| TGCT | DND1 | 0.000808578770052524 | 0.023 |
Top |
|
| Differential gene expression between young and old age groups (Wilcoxon test, pval<0.05) |
 |
| Cancer type | Translation factor | pval | adj.p |
| THCA | DND1 | 0.000124624316985073 | 0.0041 |
| BRCA | DND1 | 0.00203150501077175 | 0.063 |
| PRAD | DND1 | 0.0452215842091107 | 1 |
| SKCM | DND1 | 0.0232487906603245 | 0.67 |
| OV | DND1 | 0.000684136118697333 | 0.022 |
| ESCA | DND1 | 0.015382592640622 | 0.46 |
Top |
|
| Drugs targeting genes involved in this translation factor. (DrugBank Version 5.1.8 2021-05-08) |
| UniProtAcc | DrugBank ID | Drug name | Drug activity | Drug type | Drug status |
Top |
|
| Diseases associated with this translation factor. (DisGeNet 4.0) |
| Disease ID | Disease Name | # PubMeds | Disease source |
(UTHealth)
Web File Viewing | Emergency Information |Campus Carry|Site Policies