
|
||||||
|

Translation Factor: ZCCHC13 (NCBI Gene ID:389874) |
|
 Gene Summary Gene Summary |
| Gene Information | Gene Name: ZCCHC13 | Gene ID: 389874 | Gene Symbol | ZCCHC13 | Gene ID | 389874 |
| Gene Name | zinc finger CCHC-type containing 13 | |
| Synonyms | CNBP2|ZNF9L | |
| Cytomap | Xq13.2 | |
| Type of Gene | protein-coding | |
| Description | zinc finger CCHC domain-containing protein 13zinc finger, CCHC domain containing 13 | |
| Modification date | 20200313 | |
| UniProtAcc | Q8WW36 | |
| Child GO biological process term(s) under GO:0006412 |
| GO ID | GO term |
| GO:0006417 | Regulation of translation |
| GO:0045727 | Positive regulation of translation |
| GO:0002181 | Cytoplasmic translation |
| GO:0006412 | Translation |
| Gene ontology of translaction factor with evidence of Inferred from Direct Assay (IDA) from Entrez |
| Partner | Gene | GO ID | GO term | PubMed ID |
| Inferred gene age of translation factor. |
| Gene | Inferred gene age group among (0 - 67.6], (67.6 - 355.7], (355.7 - 733], (733 - 1119.25], >1119.25 |
Top |
|
| We searched PubMed using 'ZCCHC13[title] AND translation [title] AND human.' |
| Gene | Title | PMID |
| ZCCHC13 | . | . |
Top |
|
| Skipped exons in TCGA and GTEx based on Ensembl gene isoform structure. * Click on the image to open the UCSC genome browser with custom track showing this image in a new window. For more annotations, please visit our ExonSkipDB. |
 |
| Open reading frame (ORF) analsis of exon skipping events based on Ensembl gene isoform structure. * Click on the break point to see the gene structure around the break point region using the UCSC Genome Browser. |
| ENST | Exon skip start (DNA) | Exon Skip end (DNA) | ORF |
| Exon skipping position in the amino acid sequence. |
| ENST | Exon skip start (DNA) | Exon Skip end (DNA) | Len(transcript seq) | Exon skip start (mRNA) | Exon Skip end (mRNA) | Len(amino acid seq) | Exon skip start (AA) | Exon Skip end (AA) |
| Potentially (partially) lost protein functional features of UniProt. |
| UniProtAcc | Exon skip start (AA) | Exon Skip end (AA) | Function feature start (AA) | Function feature end (AA) | Functional feature type | Functional feature desc. |
Top |
|
| Gene expression level across TCGA pancancer |
 |
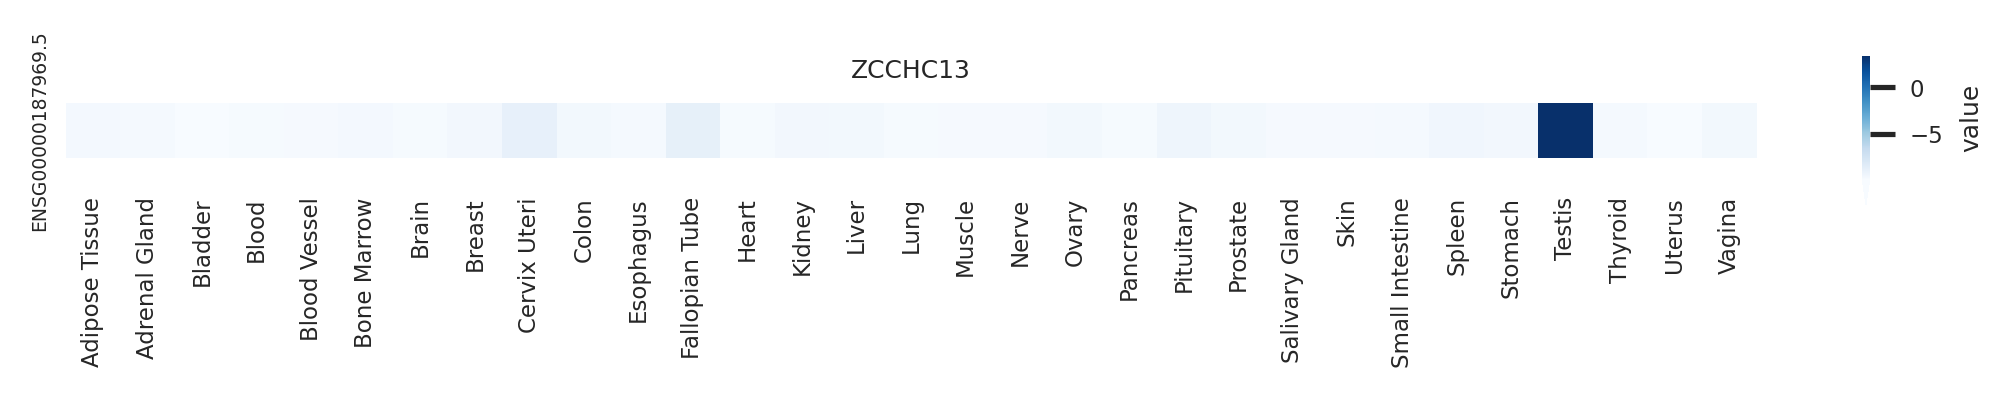
| Gene expression level across GTEx pantissue |
 |
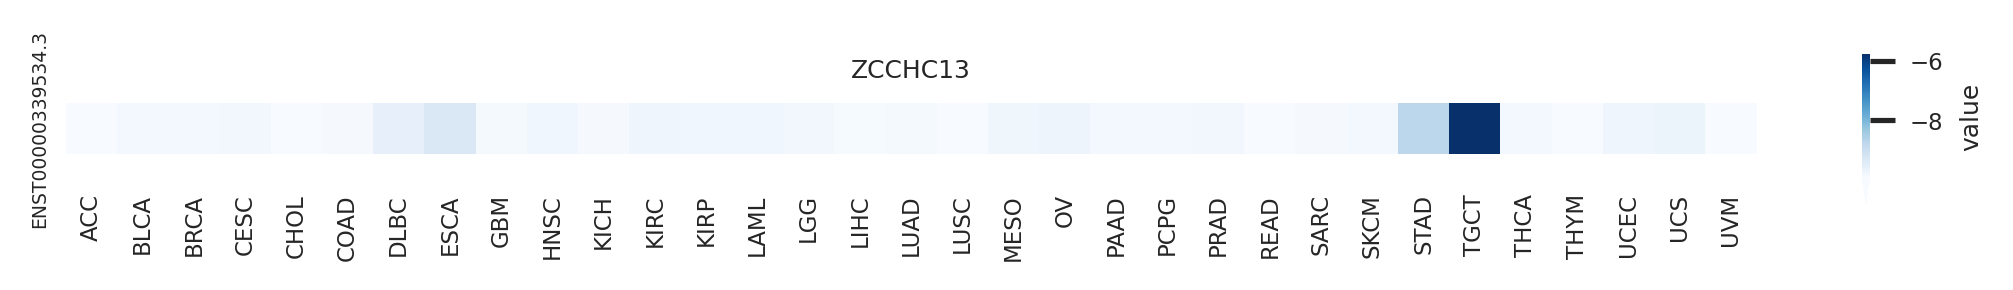
| Expression level of gene isoforms across TCGA pancancer |
 |
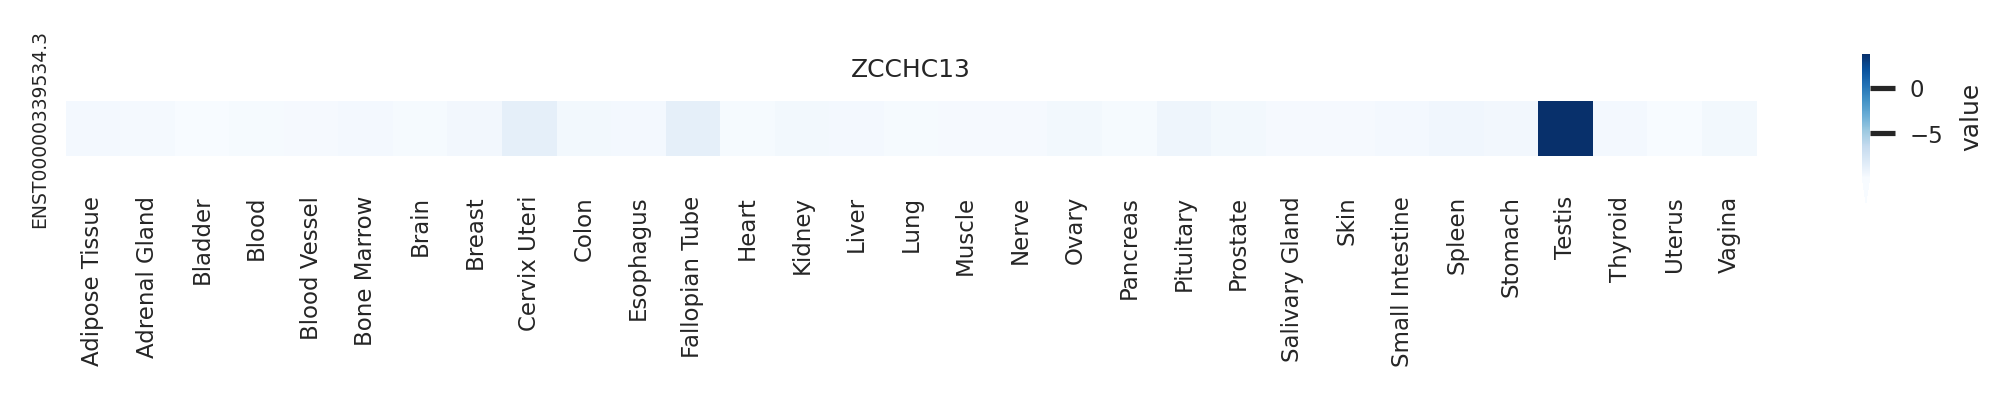
| Expression level of gene isoforms across GTEx pantissue |
 |
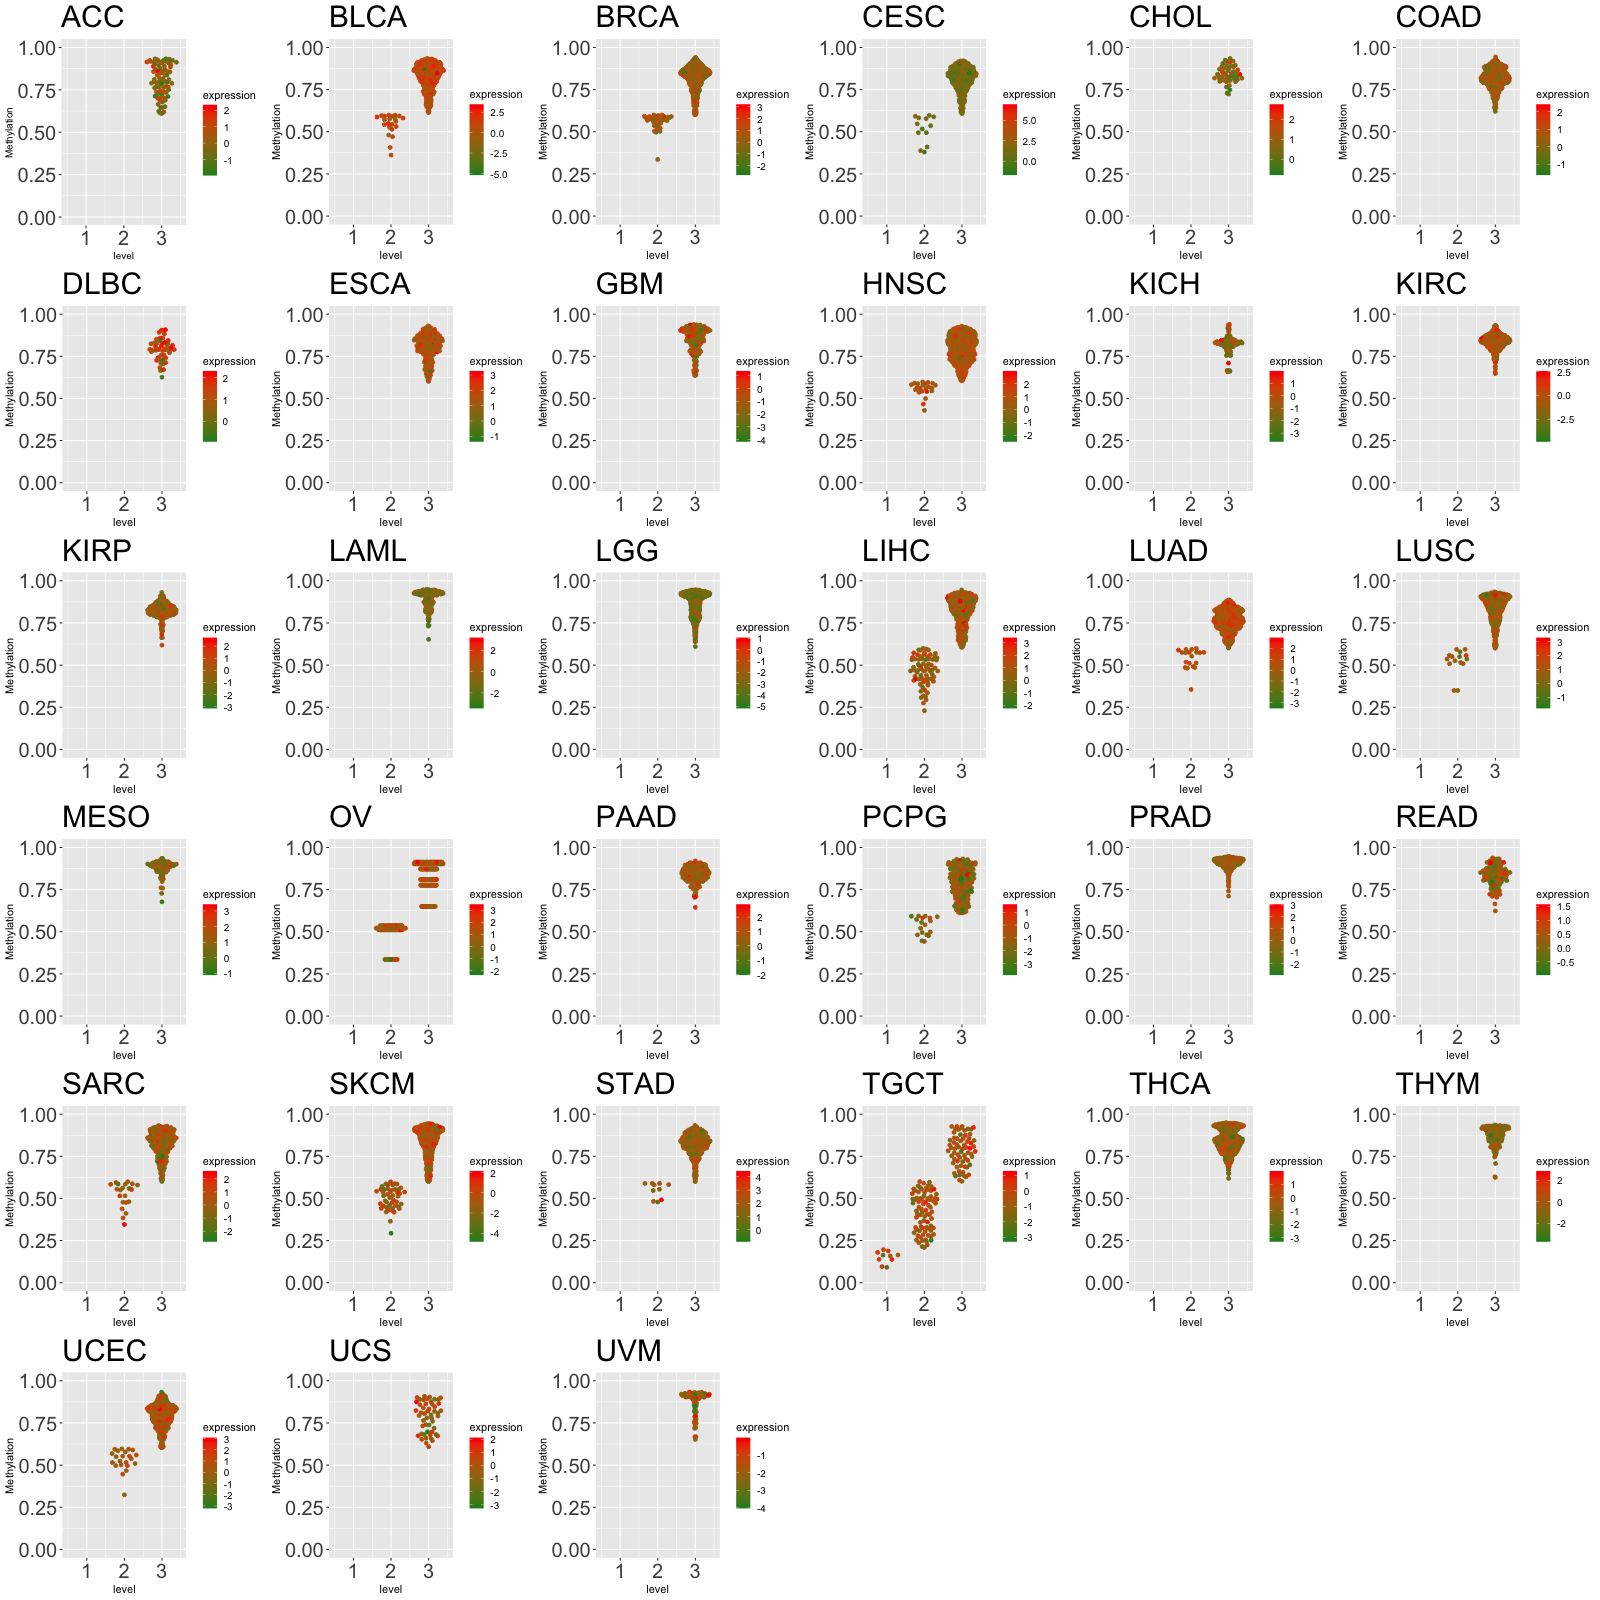
| Cancer(tissue) type-specific expression level of Translation factor using z-score distriution |
 |
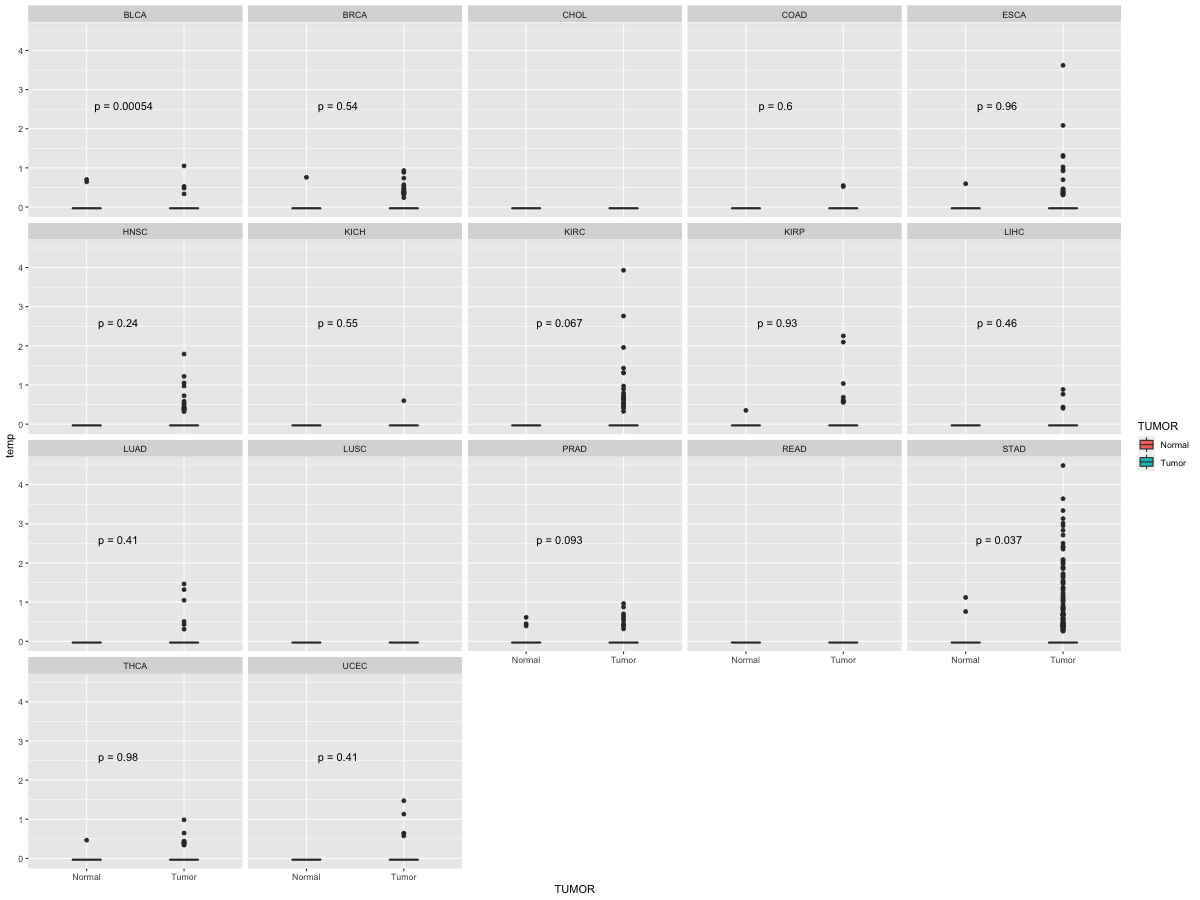
| Differential expression between tumor and matched normal (in the cancer types with more than 10 matched samples) |
 |
| Cancer type | Translation factor | FC | adj.pval |
Top |
|
| Translation factor expression regulation through miRNA binding |
| Cancer type | Gene | miRNA | TargetScan binding score (Context++ score percentile) | Coefficient | Pvalue |
| Translation factor expression regulation through methylation in the promoter of Translation factor |
 |
| Cancer type | Gene | methyl group b | methyl group a | DEG pval | avg methyl in b | avg methyl in a | avg exp in b | avg exp in a |
| Translation factor expression regulation through methylation in the gene body of Translation factor (positive regulation) |
 |
| Cancer type | Gene | methyl group b | methyl group a | DEG pval | avg methyl in b | avg methyl in a | avg exp in b | avg exp in a |
| Translation factor expression regulation through copy number variation of Translation factor |
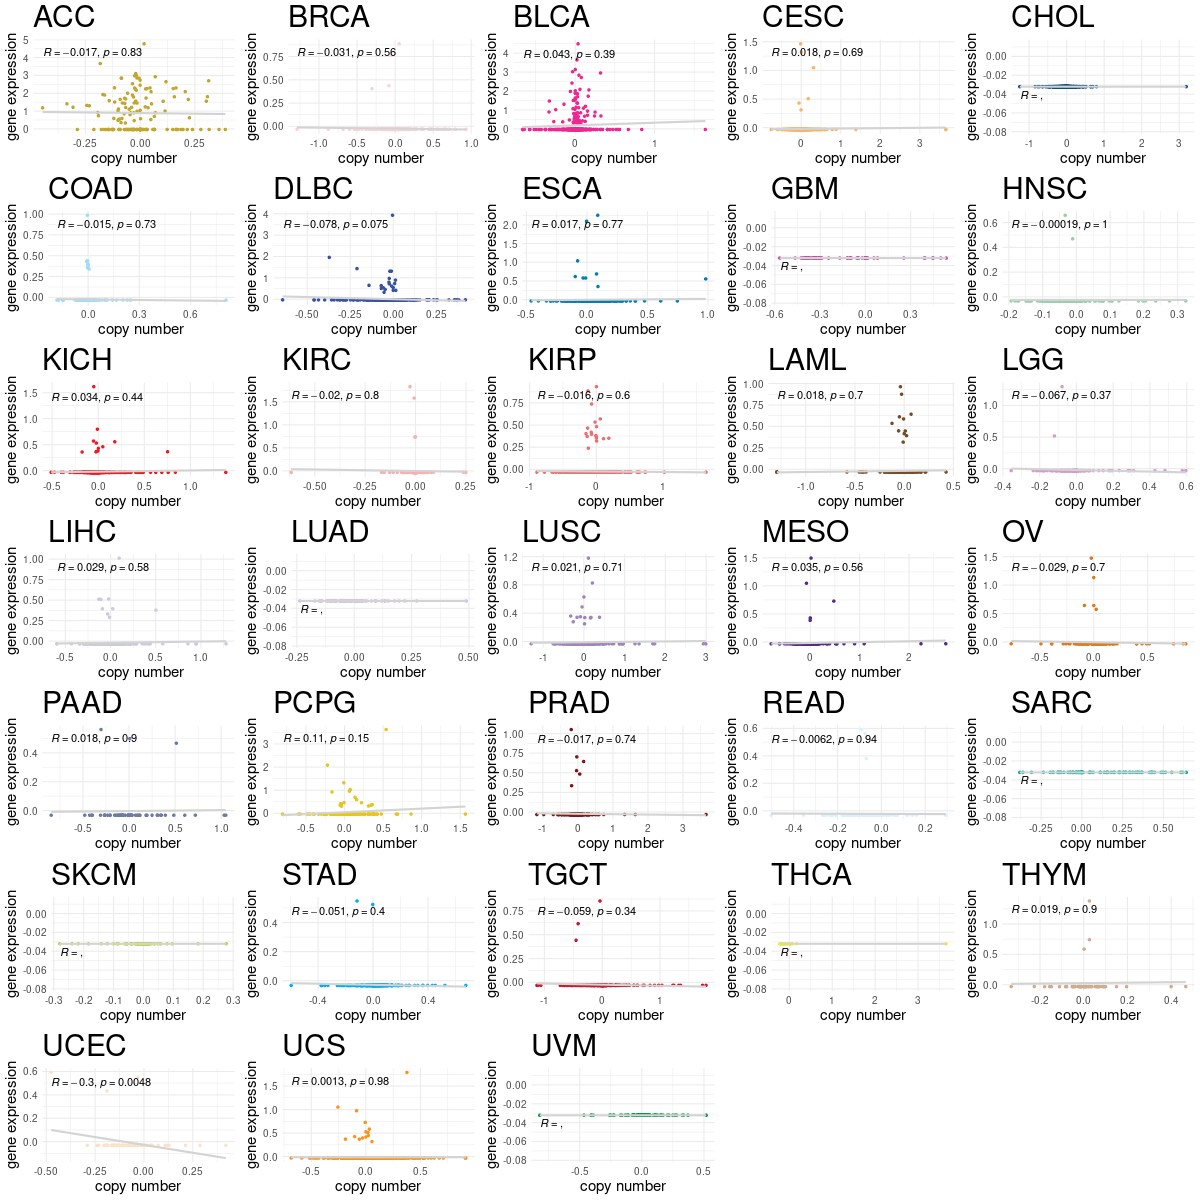 |
| Cancer type | Gene | Coefficient | Pvalue |
| UCEC | ZCCHC13 | -0.335134975 | 0.004767798 |
Top |
|
| Strongly correlated genes belong to cellular important gene groups with ZCCHC13 (coefficient>0.8, pval<0.05, node color based on FC between tumor and matched normal). Significantly associated important genes in the individual cancer types. * Cell metabolism gene: cell metabolism genes from REACTOME (black edge), IUPHAR: drug target genes from IUPHAR (blue edge), Kinase: human kinase genes (brown edge), CGC: cancer gene census genes (orange edge), TSG: tumor suppresor genes (purple edge), Epifactor: epigenetic factors (light blue edge), TF: transcription factors (green) |
 |
| Cancer type | Gene group | Translation factor | Correlated gene | Coefficient | Pvalue |
| DLBC | Cell metabolism gene | ZCCHC13 | HS6ST3 | 0.802757457 | 6.77E-12 |
| DLBC | TF | ZCCHC13 | NKX2-8 | 0.804584742 | 5.58E-12 |
| DLBC | TSG | ZCCHC13 | NKX2-8 | 0.804584742 | 5.58E-12 |
| ESCA | Cell metabolism gene | ZCCHC13 | FSHB | 0.821208913 | 3.75E-49 |
| ESCA | IUPHAR | ZCCHC13 | KCNG4 | 0.807633337 | 2.24E-46 |
| ESCA | IUPHAR | ZCCHC13 | NLRP8 | 0.811738543 | 3.42E-47 |
| ESCA | IUPHAR | ZCCHC13 | NLRP13 | 0.842970911 | 3.95E-54 |
| ESCA | IUPHAR | ZCCHC13 | BIRC8 | 0.854862506 | 3.50E-57 |
| KICH | Cell metabolism gene | ZCCHC13 | MUC17 | 0.83723567 | 4.69E-25 |
| KICH | Cell metabolism gene | ZCCHC13 | GCG | 0.909146139 | 1.29E-35 |
| KICH | Cell metabolism gene | ZCCHC13 | GPX6 | 0.919670764 | 6.79E-38 |
| KICH | Cell metabolism gene | ZCCHC13 | TUBA3C | 0.990067675 | 1.26E-77 |
| KICH | CGC | ZCCHC13 | SSX2 | 0.960653144 | 2.68E-51 |
| KICH | CGC | ZCCHC13 | SSX4 | 0.982937918 | 3.08E-67 |
| KICH | CGC | ZCCHC13 | SSX1 | 0.984383844 | 6.18E-69 |
| KICH | Epifactor | ZCCHC13 | H1FNT | 0.810829734 | 2.04E-22 |
| KICH | Epifactor | ZCCHC13 | H2BFWT | 0.824956785 | 8.98E-24 |
| KICH | Epifactor | ZCCHC13 | HIST1H2AB | 0.871292586 | 2.96E-29 |
| KICH | Epifactor | ZCCHC13 | HIST1H3I | 0.910846427 | 5.77E-36 |
| KICH | Epifactor | ZCCHC13 | HIST1H4L | 0.950448363 | 6.15E-47 |
| KICH | IUPHAR | ZCCHC13 | PANX3 | 0.859736701 | 1.05E-27 |
| KICH | IUPHAR | ZCCHC13 | MMP27 | 0.882401617 | 6.86E-31 |
| KICH | IUPHAR | ZCCHC13 | SLCO6A1 | 0.941800206 | 6.54E-44 |
| KICH | TF | ZCCHC13 | ZNF679 | 0.809399245 | 2.76E-22 |
| KICH | TF | ZCCHC13 | FOXG1 | 0.812958943 | 1.30E-22 |
| KICH | TF | ZCCHC13 | ZIC4 | 0.813029374 | 1.28E-22 |
| KICH | TF | ZCCHC13 | DMRTB1 | 0.824803176 | 9.30E-24 |
| KICH | TF | ZCCHC13 | TBX5 | 0.83453818 | 9.15E-25 |
| KICH | TF | ZCCHC13 | BARX1 | 0.839492492 | 2.65E-25 |
| KICH | TF | ZCCHC13 | FOXR2 | 0.845027978 | 6.32E-26 |
| KICH | TF | ZCCHC13 | PROP1 | 0.865853326 | 1.65E-28 |
| KICH | TF | ZCCHC13 | MYT1L | 0.871530646 | 2.75E-29 |
| KICH | TF | ZCCHC13 | DMBX1 | 0.916424635 | 3.68E-37 |
| KICH | TF | ZCCHC13 | SPZ1 | 0.922136854 | 1.79E-38 |
| KICH | TF | ZCCHC13 | LIN28B | 0.935391246 | 5.94E-42 |
| KICH | TF | ZCCHC13 | FEZF2 | 0.948712331 | 2.74E-46 |
| KICH | TSG | ZCCHC13 | PAEP | 0.804464524 | 7.67E-22 |
| KICH | TSG | ZCCHC13 | TBX5 | 0.83453818 | 9.15E-25 |
| KICH | TSG | ZCCHC13 | GKN2 | 0.875697587 | 6.96E-30 |
| STAD | IUPHAR | ZCCHC13 | NLRP8 | 0.813487428 | 1.63E-107 |
Top |
|
| Protein 3D structure Visit iCn3D. |
Top |
|
| Protein-protein interaction networks * Overlap between up-regulated DEGs (log2FC<-1 and adj.P<0.05) and STRING PPI network (center: Translation factor, node: DEGs, edges: weighted by -log2(adj.P)) |
 |
| Overlap between down-regulated DEGs (log2FC>1 and adj.P<0.05) and STRING PPI network (center: Translation factor, node: DEGs, edges: weighted by -log2(adj.P)) |
 |
 * Edge colors based on TCGA cancer types. |
| * Overlap between DEGs (log2FC>1 and adj.P<0.05) and STRING PPI network per cancer (center: Translation factor, node: DEGs, node color: log2FC, edges: weighted by -log2(adj.P)) |
 |
| Cancer type | Translation factor | Interacting protein coding gene | FC | adj.pval |
| COAD | ZCCHC13 | RPL10 | 2.006642468675 | 0.000363647937774659 |
| KIRP | ZCCHC13 | RPL10 | -1.37220416357567 | 0.000397900585085154 |
| BRCA | ZCCHC13 | MRTO4 | -1.1206548149334 | 0.000570623901679921 |
| KIRC | ZCCHC13 | WBSCR27 | 1.44399497052011 | 0.000815807222164296 |
| COAD | ZCCHC13 | CECR5 | 1.11086905031014 | 0.00177955627441406 |
| ESCA | ZCCHC13 | MRTO4 | -1.71658853440787 | 0.001953125 |
| ESCA | ZCCHC13 | WBSCR27 | -2.337084059103 | 0.0048828125 |
| STAD | ZCCHC13 | CECR5 | -1.05525781684033 | 0.0093395933508873 |
| THCA | ZCCHC13 | RPL10 | 1.10728945731078 | 0.0162154270723803 |
| LUSC | ZCCHC13 | RPL10L | -1.36690500854163 | 0.0210979717247784 |
| STAD | ZCCHC13 | RLIM | -2.17509128187061 | 0.0252704131416976 |
| CHOL | ZCCHC13 | RLIM | -1.47377508510375 | 0.02734375 |
| UCEC | ZCCHC13 | RPL10 | -2.16361378541108 | 0.03125 |
| KICH | ZCCHC13 | RPL10 | -2.34220425889432 | 0.0341737866401672 |
| LUAD | ZCCHC13 | CECR5 | -1.35474048180521 | 1.61427770148041e-05 |
| PRAD | ZCCHC13 | MRTO4 | -2.94194912263041 | 1.78303573859803e-06 |
| KIRC | ZCCHC13 | RLIM | -4.28576267772829 | 1.78820612744388e-08 |
| PRAD | ZCCHC13 | RLIM | 1.52529014887364 | 1.82900102684565e-05 |
| COAD | ZCCHC13 | RPL10L | -1.78552000802138 | 2.08616256713867e-07 |
| STAD | ZCCHC13 | MRTO4 | -2.65863510260604 | 2.98023223876953e-07 |
| COAD | ZCCHC13 | RLIM | -3.2570032025935 | 2.98023223876954e-08 |
| BRCA | ZCCHC13 | CHIC1 | -2.74073035072028 | 3.76176190769597e-05 |
| KIRP | ZCCHC13 | WBSCR27 | 1.35557893651603 | 4.5965425670147e-06 |
| LUAD | ZCCHC13 | MRTO4 | -6.33411065422197 | 4.60205959480617e-09 |
| BRCA | ZCCHC13 | RPL10 | -3.68650055930356 | 5.03964579430268e-08 |
| PRAD | ZCCHC13 | CHIC1 | -1.33989435459853 | 7.60368400697642e-06 |
| Protein-protein interactors with this translation factor (BIOGRID-3.4.160) |
| PPI interactors with ZCCHC13 |
| ATXN1, SIAH1, SNRPA, GUCD1, ZNF648, ZNF250, |
Top |
|
| Clinically associated variants from ClinVar. |
| Gene | Chr | Position | RefSeq | VarSeq | RefSeeq | VarType | Pathogenic | Disease | VarInfo |
| ZCCHC13 | chrX | 73524146 | G | A | single_nucleotide_variant | Benign | not_provided | SO:0001587|nonsense | SO:0001587|nonsense |
| ZCCHC13 | chrX | 73524204 | G | A | single_nucleotide_variant | Benign | not_provided | SO:0001583|missense_variant | SO:0001583|missense_variant |
| ZCCHC13 | chrX | 73524557 | A | G | single_nucleotide_variant | Benign | not_provided | SO:0001819|synonymous_variant | SO:0001819|synonymous_variant |
| nsSNVs with sample frequency (size of circle) from TCGA 33 cancers. |
 |
| SNVs and Indels |
| Gene | Cancer type | Chromosome | Start | End | RefSeeq | MutSeq | Mutation type | AAchange | # samples |
| ZCCHC13 | UCEC | chrX | 73524329 | 73524329 | C | T | Silent | p.I76 | 4 |
| ZCCHC13 | HNSC | chrX | 73524270 | 73524270 | G | T | Missense_Mutation | p.A57S | 3 |
| ZCCHC13 | BRCA | chrX | 73524431 | 73524431 | G | A | Silent | p.Q110 | 3 |
| ZCCHC13 | LUAD | chrX | 73524453 | 73524453 | C | A | Missense_Mutation | p.L118I | 3 |
| ZCCHC13 | HNSC | chrX | 73524500 | 73524500 | C | A | Nonsense_Mutation | p.C133* | 2 |
| ZCCHC13 | UCEC | chrX | 73524410 | 73524410 | C | A | Missense_Mutation | p.D103E | 2 |
| ZCCHC13 | LUAD | chrX | 73524388 | 73524388 | G | T | Missense_Mutation | p.R96I | 2 |
| ZCCHC13 | SKCM | chrX | 73524122 | 73524122 | C | T | Silent | p.F7F | 2 |
| ZCCHC13 | UCEC | chrX | 73524565 | 73524565 | G | A | Missense_Mutation | p.R155Q | 2 |
| ZCCHC13 | SARC | chrX | 73524388 | 73524388 | G | C | Missense_Mutation | 2 | |
| ZCCHC13 | STAD | chrX | 73524221 | 73524221 | C | T | Silent | p.S40S | 2 |
| ZCCHC13 | SARC | chrX | 73524388 | 73524388 | G | C | Missense_Mutation | p.R96T | 2 |
| ZCCHC13 | STAD | chrX | 73524418 | 73524418 | G | A | Missense_Mutation | p.R106H | 2 |
| ZCCHC13 | SKCM | chrX | 73524113 | 73524113 | G | A | Silent | p.K4K | 2 |
| ZCCHC13 | STAD | chrX | 73524363 | 73524363 | C | T | Missense_Mutation | p.R88C | 2 |
| ZCCHC13 | SKCM | chrX | 73524285 | 73524285 | C | T | Missense_Mutation | p.L62F | 2 |
| ZCCHC13 | SKCM | chrX | 73524277 | 73524277 | A | G | Missense_Mutation | p.N59S | 2 |
| ZCCHC13 | UCEC | chrX | 73524122 | 73524122 | C | T | Silent | p.F7 | 2 |
| ZCCHC13 | SKCM | chrX | 73524206 | 73524206 | T | C | Silent | p.G35G | 2 |
| ZCCHC13 | LUAD | chrX | 73524366 | 73524366 | C | A | Missense_Mutation | p.Q89K | 1 |
| ZCCHC13 | CESC | chrX | 73524431 | 73524431 | G | C | Missense_Mutation | p.Q110H | 1 |
| ZCCHC13 | SKCM | chrX | 73524129 | 73524129 | G | A | Missense_Mutation | p.G10R | 1 |
| ZCCHC13 | HNSC | chrX | 73524174 | 73524174 | G | C | Missense_Mutation | p.G25R | 1 |
| ZCCHC13 | COAD | chrX | 73524139 | 73524139 | G | A | Missense_Mutation | p.G13D | 1 |
| ZCCHC13 | LUAD | chrX | 73524478 | 73524478 | C | - | Frame_Shift_Del | p.A126fs | 1 |
| ZCCHC13 | COAD | chrX | 73524355 | 73524355 | G | A | Missense_Mutation | p.R85Q | 1 |
| ZCCHC13 | SKCM | chrX | 73524524 | 73524524 | C | T | Silent | p.I141I | 1 |
| ZCCHC13 | KIRC | chrX | 73524500 | 73524500 | C | T | Silent | p.C133C | 1 |
| ZCCHC13 | BLCA | chrX | 73524406 | 73524406 | G | A | Missense_Mutation | 1 | |
| ZCCHC13 | LUSC | chrX | 73524598 | 73524598 | A | T | Missense_Mutation | p.Q166L | 1 |
| ZCCHC13 | COAD | chrX | 73524329 | 73524329 | C | T | Silent | p.I76I | 1 |
| ZCCHC13 | SKCM | chrX | 73524159 | 73524159 | C | T | Missense_Mutation | p.P20S | 1 |
| ZCCHC13 | LGG | chrX | 73524566 | 73524566 | G | A | Silent | p.R155R | 1 |
| ZCCHC13 | BLCA | chrX | 73524501 | 73524501 | G | T | Missense_Mutation | 1 | |
| ZCCHC13 | LUSC | chrX | 73524496 | 73524496 | G | A | Missense_Mutation | p.R132Q | 1 |
| ZCCHC13 | GBM | chrX | 73524398 | 73524398 | T | A | Missense_Mutation | p.H99Q | 1 |
| ZCCHC13 | SKCM | chrX | 73524565 | 73524565 | G | C | Missense_Mutation | p.R155P | 1 |
| ZCCHC13 | LGG | chrX | 73524566 | 73524566 | G | A | Silent | 1 | |
| ZCCHC13 | BLCA | chrX | 73524385 | 73524385 | G | C | Missense_Mutation | 1 | |
| ZCCHC13 | GBM | chrX | 73524398 | 73524398 | T | A | Missense_Mutation | 1 | |
| ZCCHC13 | LGG | chrX | 73524403 | 73524403 | C | A | Missense_Mutation | 1 | |
| ZCCHC13 | BLCA | chrX | 73524406 | 73524406 | G | A | Missense_Mutation | p.R102H | 1 |
| ZCCHC13 | HNSC | chrX | 73524174 | 73524174 | G | C | Missense_Mutation | 1 | |
| ZCCHC13 | LUAD | chrX | 73524209 | 73524209 | T | C | Silent | p.S36S | 1 |
| ZCCHC13 | BLCA | chrX | 73524501 | 73524501 | G | T | Missense_Mutation | p.G134C | 1 |
| ZCCHC13 | HNSC | chrX | 73524270 | 73524270 | G | T | Missense_Mutation | 1 | |
| ZCCHC13 | LUAD | chrX | 73524477 | 73524477 | G | T | Missense_Mutation | p.A126S | 1 |
| ZCCHC13 | BLCA | chrX | 73524385 | 73524385 | G | C | Missense_Mutation | p.G95A | 1 |
| ZCCHC13 | STAD | chrX | 73524180 | 73524180 | C | T | Nonsense_Mutation | p.R27* | 1 |
| ZCCHC13 | HNSC | chrX | 73524386 | 73524386 | C | T | Silent | 1 | |
| ZCCHC13 | LUAD | chrX | 73524138 | 73524138 | G | A | Missense_Mutation | p.G13S | 1 |
| ZCCHC13 | HNSC | chrX | 73524386 | 73524386 | C | T | Silent | p.G95G | 1 |
| ZCCHC13 | CESC | chrX | 73524601 | 73524601 | G | T | Nonstop_Mutation | 1 |
| Copy number variation (CNV) of ZCCHC13 * Click on the image to open the original image in a new window. |
 |
| Fusion gene breakpoints (product of the structural variants (SVs)) across ZCCHC13 * Click on the image to open the UCSC genome browser with custom track showing this image in a new window. |
 |
| Fusion genes with this translation factor from FusionGDB2.0. |
| FusionGDB2 ID | Disease | Sample | Hgene | Hchr | Hbp | Hstrand | Tgene | Tchr | Tbp | Tstrand |
Top |
|
| Kaplan-Meier plots with logrank tests of overall survival (OS) |
 |
| Cancer type | Translation factor | Coefficent | Hazard ratio | Wald test pval | Likelihool ratio pval | Logrank test pval | # samples |
Top |
|
| Differential gene expression between female and male. (Wilcoxon test, pval<0.05) |
 |
| Cancer type | Translation factor | pval | adj.p |
| TGCT | ZCCHC13 | 0.00103926378915181 | 0.023 |
| SKCM | ZCCHC13 | 0.0130792721342567 | 0.27 |
Top |
|
| Differential gene expression between young and old age groups (Wilcoxon test, pval<0.05) |
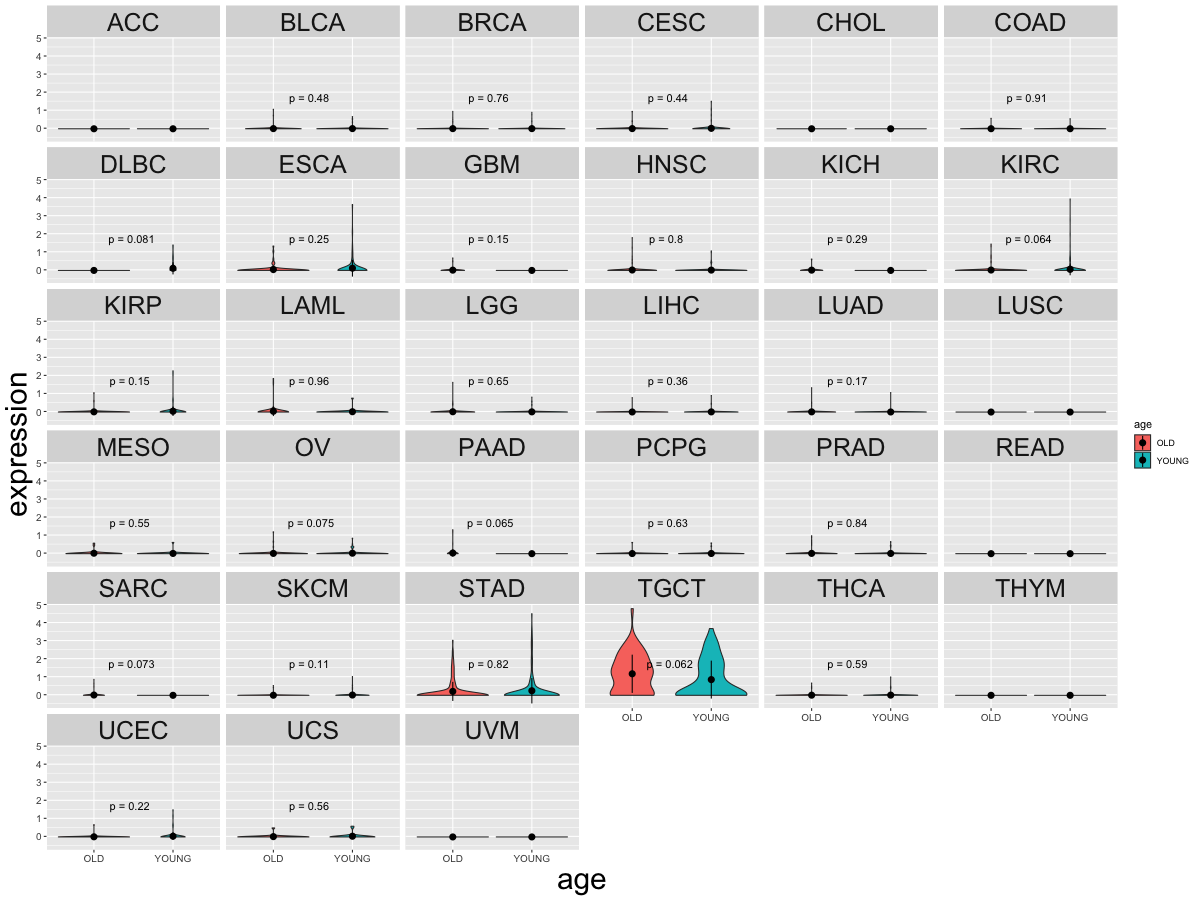 |
| Cancer type | Translation factor | pval | adj.p |
Top |
|
| Drugs targeting genes involved in this translation factor. (DrugBank Version 5.1.8 2021-05-08) |
| UniProtAcc | DrugBank ID | Drug name | Drug activity | Drug type | Drug status |
Top |
|
| Diseases associated with this translation factor. (DisGeNet 4.0) |
| Disease ID | Disease Name | # PubMeds | Disease source |
(UTHealth)
Web File Viewing | Emergency Information |Campus Carry|Site Policies