
|
||||||
|

Translation Factor: PAIP2B (NCBI Gene ID:400961) |
|
 Gene Summary Gene Summary |
| Gene Information | Gene Name: PAIP2B | Gene ID: 400961 | Gene Symbol | PAIP2B | Gene ID | 400961 |
| Gene Name | poly(A) binding protein interacting protein 2B | |
| Synonyms | - | |
| Cytomap | 2p13.3 | |
| Type of Gene | protein-coding | |
| Description | polyadenylate-binding protein-interacting protein 2BPABP-interacting protein 2BPAIP-2B | |
| Modification date | 20200313 | |
| UniProtAcc | Q9ULR5 | |
| Child GO biological process term(s) under GO:0006412 |
| GO ID | GO term |
| GO:0017148 | Negative regulation of translation |
| GO:0006417 | Regulation of translation |
| GO:0006413 | Translational initiation |
| GO:0006412 | Translation |
| Gene ontology of translaction factor with evidence of Inferred from Direct Assay (IDA) from Entrez |
| Partner | Gene | GO ID | GO term | PubMed ID |
| Hgene | PAIP2B | GO:0045947 | negative regulation of translational initiation | 16804161 |
| Inferred gene age of translation factor. |
| Gene | Inferred gene age group among (0 - 67.6], (67.6 - 355.7], (355.7 - 733], (733 - 1119.25], >1119.25 |
| PAIP2B | (733 - 1119.25] |
Top |
|
| We searched PubMed using 'PAIP2B[title] AND translation [title] AND human.' |
| Gene | Title | PMID |
| PAIP2B | Regulation of poly(A) binding protein function in translation: Characterization of the Paip2 homolog, Paip2B | 16804161 |
Top |
|
| Skipped exons in TCGA and GTEx based on Ensembl gene isoform structure. * Click on the image to open the UCSC genome browser with custom track showing this image in a new window. For more annotations, please visit our ExonSkipDB. |
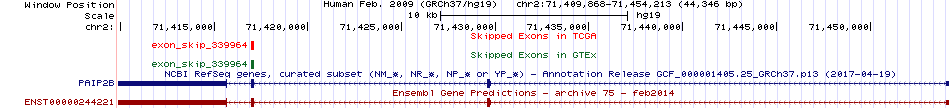 |
| Open reading frame (ORF) analsis of exon skipping events based on Ensembl gene isoform structure. * Click on the break point to see the gene structure around the break point region using the UCSC Genome Browser. |
| ENST | Exon skip start (DNA) | Exon Skip end (DNA) | ORF |
| ENST00000244221 | 71416974 | 71417151 | In-frame |
| Exon skipping position in the amino acid sequence. |
| ENST | Exon skip start (DNA) | Exon Skip end (DNA) | Len(transcript seq) | Exon skip start (mRNA) | Exon Skip end (mRNA) | Len(amino acid seq) | Exon skip start (AA) | Exon Skip end (AA) |
| ENST00000244221 | 71416974 | 71417151 | 6296 | 306 | 482 | 123 | 46 | 105 |
| Potentially (partially) lost protein functional features of UniProt. |
| UniProtAcc | Exon skip start (AA) | Exon Skip end (AA) | Function feature start (AA) | Function feature end (AA) | Functional feature type | Functional feature desc. |
| Q9ULR5 | 46 | 105 | 1 | 123 | Chain | ID=PRO_0000317294;Note=Polyadenylate-binding protein-interacting protein 2B |
Top |
|
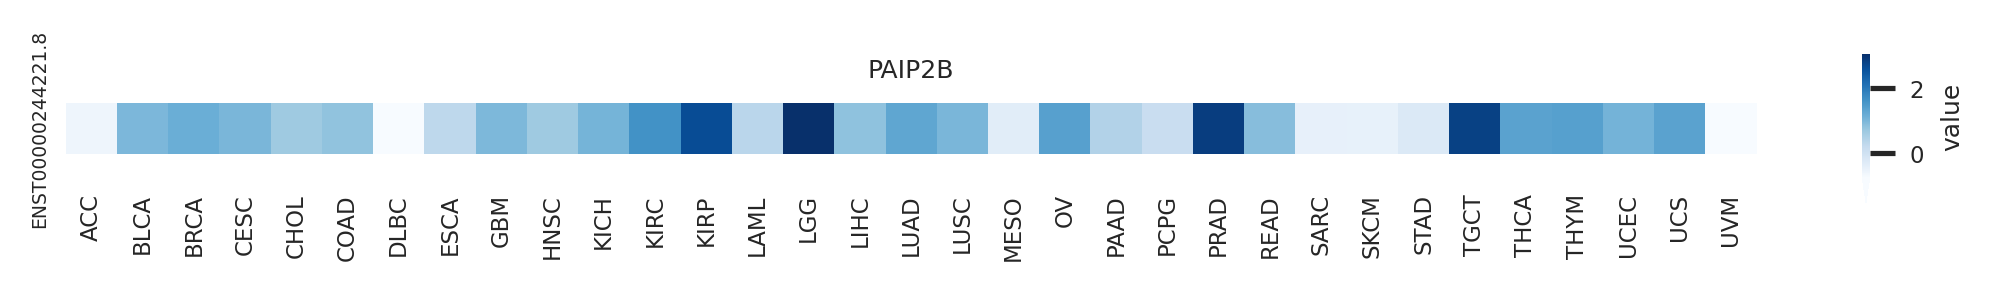
| Gene expression level across TCGA pancancer |
 |
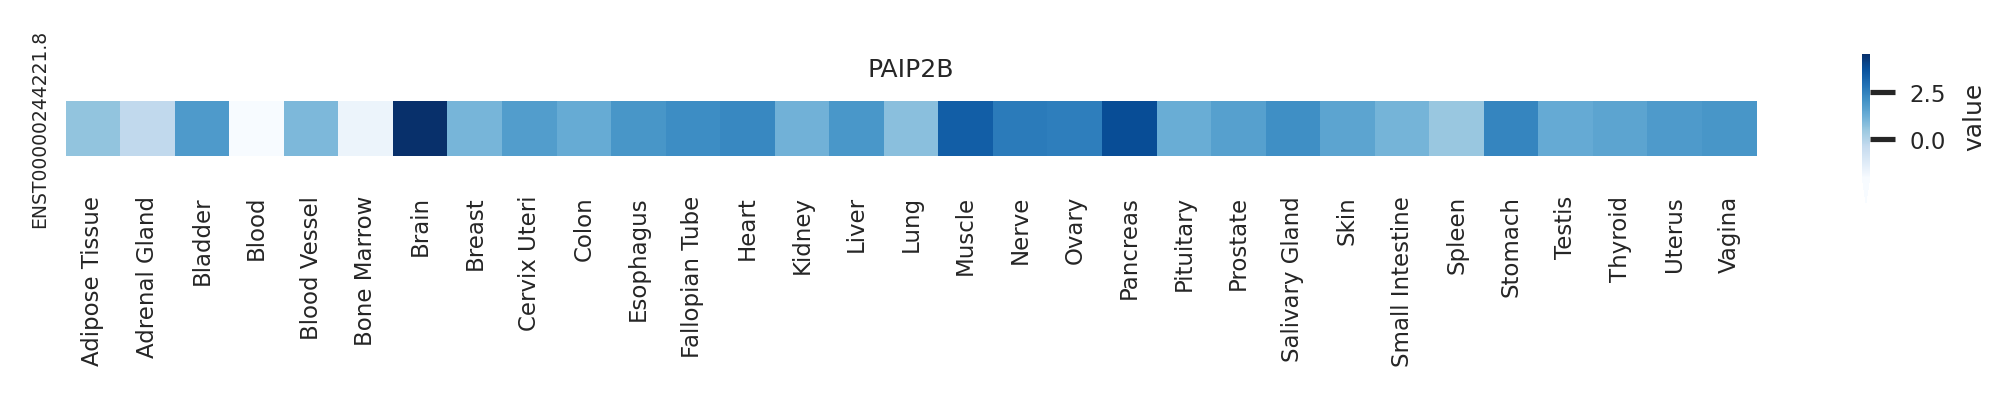
| Gene expression level across GTEx pantissue |
 |
| Expression level of gene isoforms across TCGA pancancer |
 |
| Expression level of gene isoforms across GTEx pantissue |
 |
| Cancer(tissue) type-specific expression level of Translation factor using z-score distriution |
 |
| Differential expression between tumor and matched normal (in the cancer types with more than 10 matched samples) |
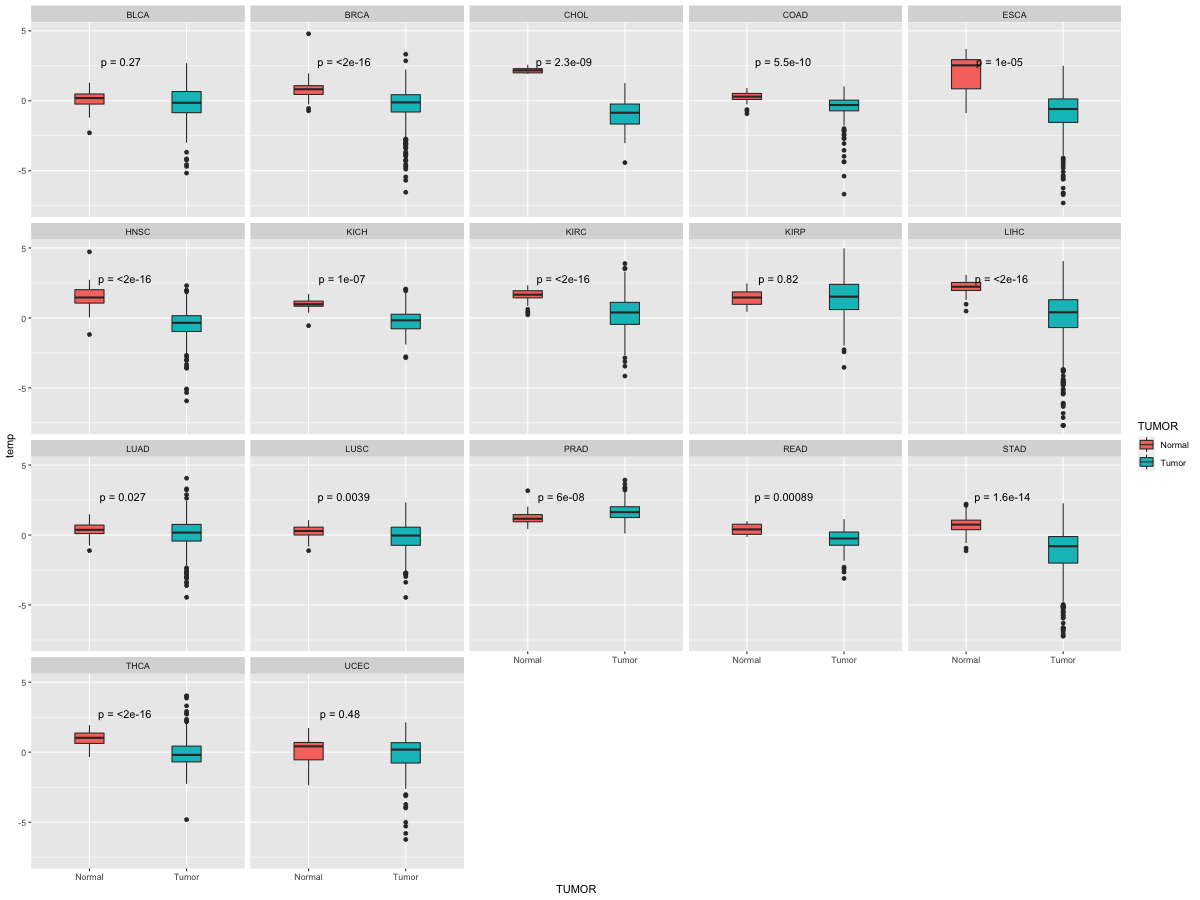 |
| Cancer type | Translation factor | FC | adj.pval |
| KIRC | PAIP2B | -1.69646345303634 | 1.30745672886698e-07 |
| BRCA | PAIP2B | -3.71582848478141 | 1.80409282930263e-11 |
| LIHC | PAIP2B | -2.98833419208047 | 8.51524921447167e-07 |
Top |
|
| Translation factor expression regulation through miRNA binding |
| Cancer type | Gene | miRNA | TargetScan binding score (Context++ score percentile) | Coefficient | Pvalue |
| DLBC | PAIP2B | hsa-miR-27b-3p | 94 | 0.411077705827937 | 0.00438038012736457 |
| Translation factor expression regulation through methylation in the promoter of Translation factor |
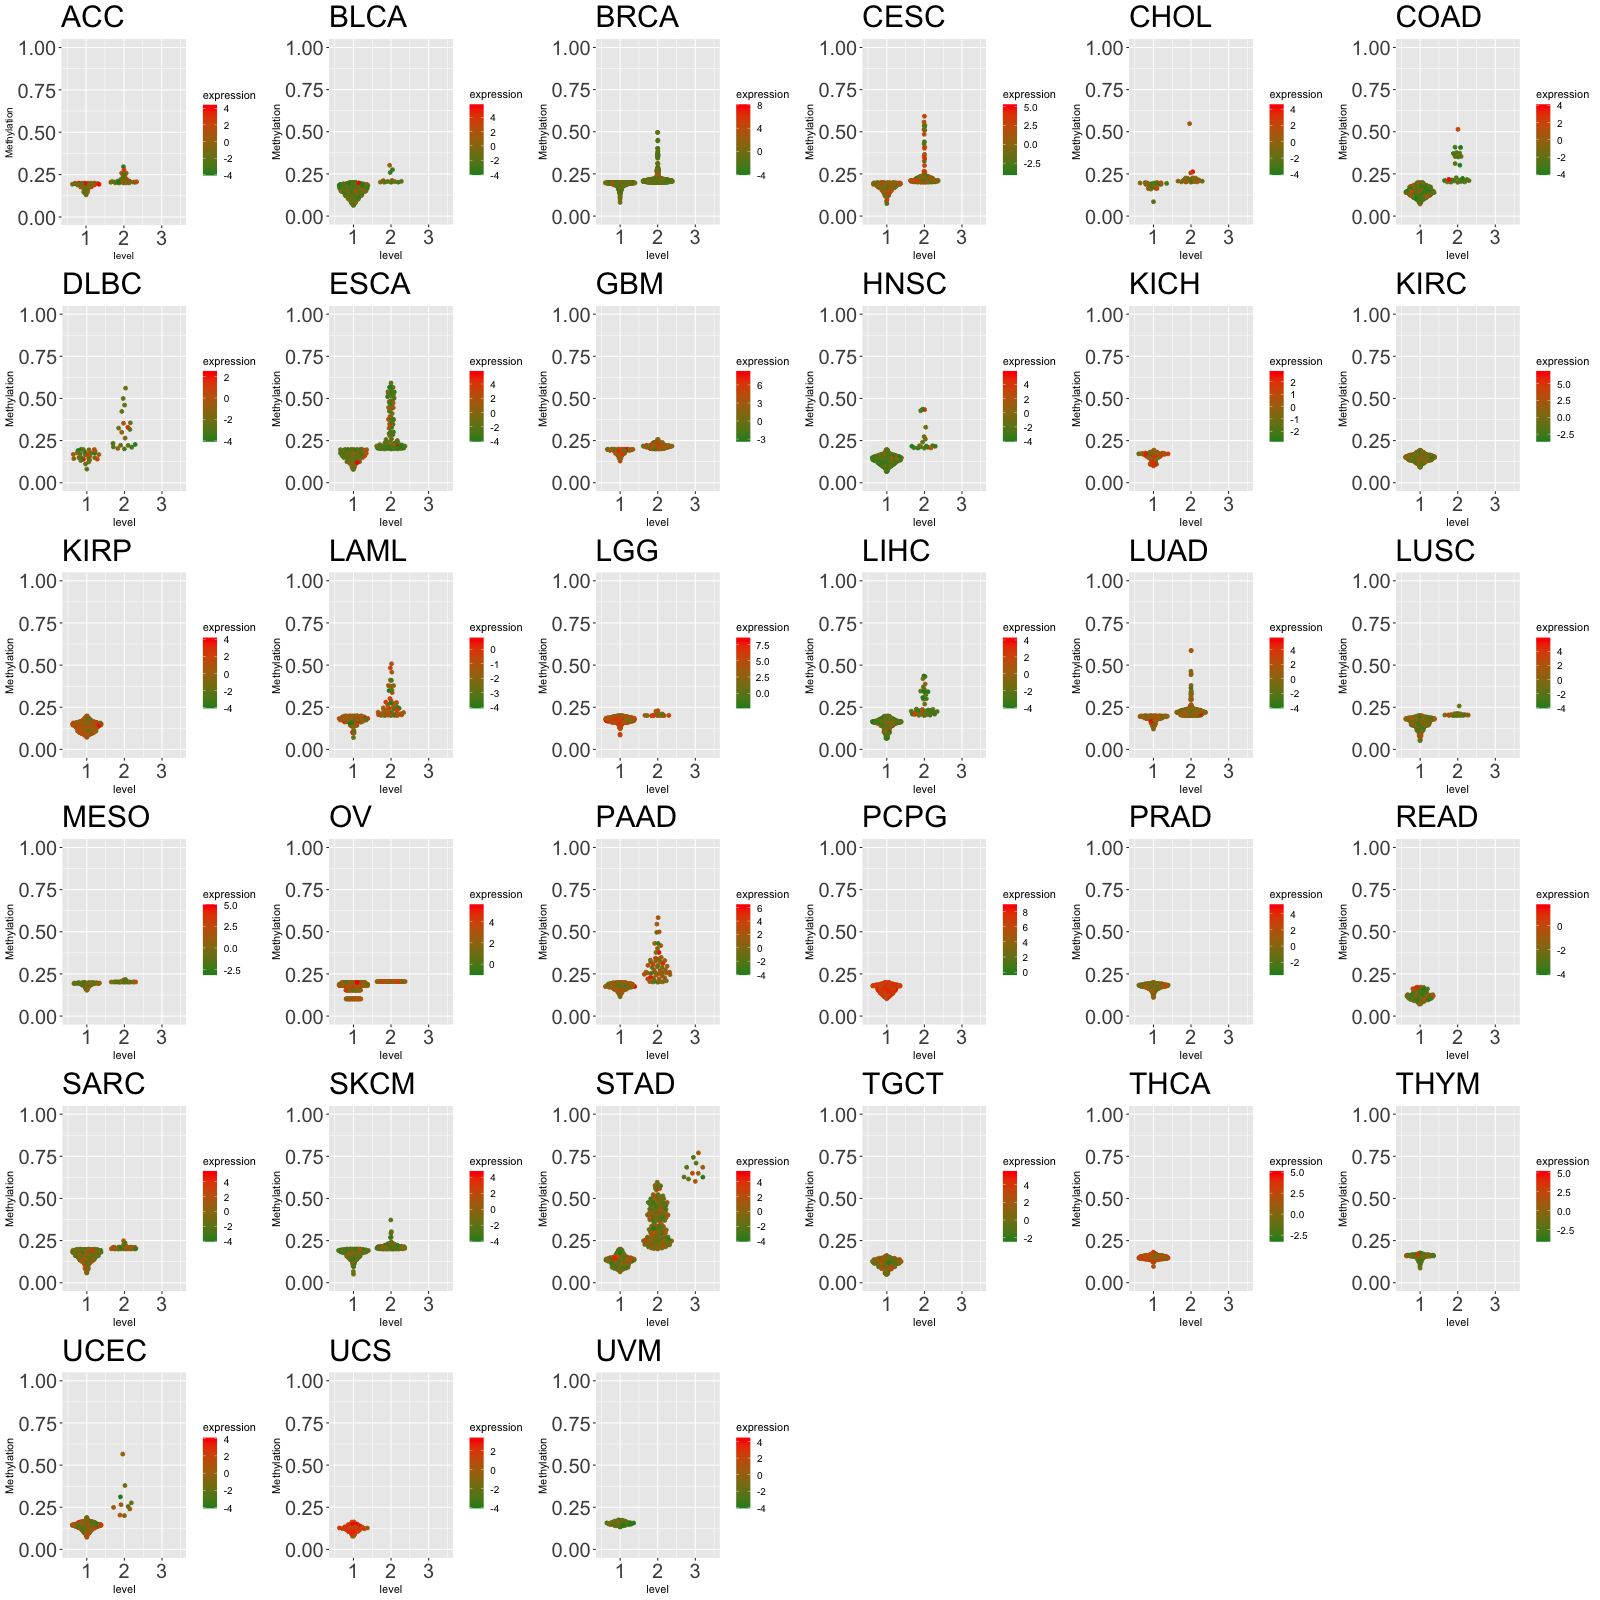 |
| Cancer type | Gene | methyl group b | methyl group a | DEG pval | avg methyl in b | avg methyl in a | avg exp in b | avg exp in a |
| ESCA | PAIP2B | 2 | 1 | 0.00140416372017687 | 0.323246481178396 | 0.160252053771471 | -1.74568092710799 | -1.15065940262925 |
| Translation factor expression regulation through methylation in the gene body of Translation factor (positive regulation) |
 |
| Cancer type | Gene | methyl group b | methyl group a | DEG pval | avg methyl in b | avg methyl in a | avg exp in b | avg exp in a |
| Translation factor expression regulation through copy number variation of Translation factor |
 |
| Cancer type | Gene | Coefficient | Pvalue |
| BRCA | PAIP2B | 0.012503297 | 0.011437702 |
Top |
|
| Strongly correlated genes belong to cellular important gene groups with PAIP2B (coefficient>0.8, pval<0.05, node color based on FC between tumor and matched normal). Significantly associated important genes in the individual cancer types. * Cell metabolism gene: cell metabolism genes from REACTOME (black edge), IUPHAR: drug target genes from IUPHAR (blue edge), Kinase: human kinase genes (brown edge), CGC: cancer gene census genes (orange edge), TSG: tumor suppresor genes (purple edge), Epifactor: epigenetic factors (light blue edge), TF: transcription factors (green) |
 |
| Cancer type | Gene group | Translation factor | Correlated gene | Coefficient | Pvalue |
| CHOL | Cell metabolism gene | PAIP2B | HADH | 0.801135728 | 3.86E-11 |
| CHOL | Cell metabolism gene | PAIP2B | CTH | 0.801896548 | 3.59E-11 |
| CHOL | Cell metabolism gene | PAIP2B | AASS | 0.80270751 | 3.31E-11 |
| CHOL | Cell metabolism gene | PAIP2B | ACACB | 0.805858918 | 2.42E-11 |
| CHOL | Cell metabolism gene | PAIP2B | PROS1 | 0.808065972 | 1.94E-11 |
| CHOL | Cell metabolism gene | PAIP2B | ACOX2 | 0.808543071 | 1.85E-11 |
| CHOL | Cell metabolism gene | PAIP2B | ACSM5 | 0.809795618 | 1.63E-11 |
| CHOL | Cell metabolism gene | PAIP2B | HIBCH | 0.810393398 | 1.53E-11 |
| CHOL | Cell metabolism gene | PAIP2B | SLC25A13 | 0.812529029 | 1.23E-11 |
| CHOL | Cell metabolism gene | PAIP2B | PEX11A | 0.813479413 | 1.11E-11 |
| CHOL | Cell metabolism gene | PAIP2B | MTHFD1 | 0.814011953 | 1.05E-11 |
| CHOL | Cell metabolism gene | PAIP2B | GLS2 | 0.819541807 | 5.83E-12 |
| CHOL | Cell metabolism gene | PAIP2B | ABCB11 | 0.820347355 | 5.34E-12 |
| CHOL | Cell metabolism gene | PAIP2B | BCKDHB | 0.821301476 | 4.81E-12 |
| CHOL | Cell metabolism gene | PAIP2B | ALDH5A1 | 0.821339959 | 4.79E-12 |
| CHOL | Cell metabolism gene | PAIP2B | RAPGEF4 | 0.822848878 | 4.06E-12 |
| CHOL | Cell metabolism gene | PAIP2B | CAT | 0.823789039 | 3.66E-12 |
| CHOL | Cell metabolism gene | PAIP2B | LPA | 0.824011022 | 3.57E-12 |
| CHOL | Cell metabolism gene | PAIP2B | DGAT2 | 0.828484522 | 2.15E-12 |
| CHOL | Cell metabolism gene | PAIP2B | PLIN1 | 0.829094014 | 2.01E-12 |
| CHOL | Cell metabolism gene | PAIP2B | ALDH7A1 | 0.830852476 | 1.64E-12 |
| CHOL | Cell metabolism gene | PAIP2B | UPB1 | 0.831385765 | 1.54E-12 |
| CHOL | Cell metabolism gene | PAIP2B | ALDH6A1 | 0.831959122 | 1.44E-12 |
| CHOL | Cell metabolism gene | PAIP2B | EHHADH | 0.832071703 | 1.42E-12 |
| CHOL | Cell metabolism gene | PAIP2B | ALDH2 | 0.832090052 | 1.42E-12 |
| CHOL | Cell metabolism gene | PAIP2B | DBH | 0.832182559 | 1.40E-12 |
| CHOL | Cell metabolism gene | PAIP2B | ADI1 | 0.832525643 | 1.34E-12 |
| CHOL | Cell metabolism gene | PAIP2B | SARDH | 0.833510227 | 1.20E-12 |
| CHOL | Cell metabolism gene | PAIP2B | AGL | 0.834111723 | 1.11E-12 |
| CHOL | Cell metabolism gene | PAIP2B | ENPP1 | 0.837362725 | 7.54E-13 |
| CHOL | Cell metabolism gene | PAIP2B | MOCS2 | 0.838616259 | 6.47E-13 |
| CHOL | Cell metabolism gene | PAIP2B | PCK2 | 0.838622849 | 6.46E-13 |
| CHOL | Cell metabolism gene | PAIP2B | ABAT | 0.839353616 | 5.91E-13 |
| CHOL | Cell metabolism gene | PAIP2B | SORD | 0.841816582 | 4.35E-13 |
| CHOL | Cell metabolism gene | PAIP2B | MCEE | 0.846106883 | 2.52E-13 |
| CHOL | Cell metabolism gene | PAIP2B | HSD17B4 | 0.847307418 | 2.16E-13 |
| CHOL | Cell metabolism gene | PAIP2B | ACSL1 | 0.858187991 | 4.93E-14 |
| CHOL | Cell metabolism gene | PAIP2B | ACADSB | 0.874123622 | 4.49E-15 |
| CHOL | CGC | PAIP2B | ESR1 | 0.817655641 | 7.15E-12 |
| CHOL | CGC | PAIP2B | ALDH2 | 0.832090052 | 1.42E-12 |
| CHOL | Epifactor | PAIP2B | CECR2 | 0.813469735 | 1.11E-11 |
| CHOL | IUPHAR | PAIP2B | CYP1A1 | 0.800481964 | 4.12E-11 |
| CHOL | IUPHAR | PAIP2B | SFXN1 | 0.801070892 | 3.89E-11 |
| CHOL | IUPHAR | PAIP2B | LEPR | 0.801342349 | 3.79E-11 |
| CHOL | IUPHAR | PAIP2B | SLC25A42 | 0.801458575 | 3.74E-11 |
| CHOL | IUPHAR | PAIP2B | CTH | 0.801896548 | 3.59E-11 |
| CHOL | IUPHAR | PAIP2B | ENPEP | 0.805475097 | 2.52E-11 |
| CHOL | IUPHAR | PAIP2B | ACACB | 0.805858918 | 2.42E-11 |
| CHOL | IUPHAR | PAIP2B | SLC6A13 | 0.809740508 | 1.64E-11 |
| CHOL | IUPHAR | PAIP2B | ADRA1A | 0.810334361 | 1.54E-11 |
| CHOL | IUPHAR | PAIP2B | SLC25A13 | 0.812529029 | 1.23E-11 |
| CHOL | IUPHAR | PAIP2B | CECR2 | 0.813469735 | 1.11E-11 |
| CHOL | IUPHAR | PAIP2B | FOLH1B | 0.814871461 | 9.61E-12 |
| CHOL | IUPHAR | PAIP2B | AQP9 | 0.815946802 | 8.58E-12 |
| CHOL | IUPHAR | PAIP2B | ESR1 | 0.817655641 | 7.15E-12 |
| CHOL | IUPHAR | PAIP2B | ABCB11 | 0.820347355 | 5.34E-12 |
| CHOL | IUPHAR | PAIP2B | CHRNA4 | 0.820504945 | 5.25E-12 |
| CHOL | IUPHAR | PAIP2B | ALDH5A1 | 0.821339959 | 4.79E-12 |
| CHOL | IUPHAR | PAIP2B | RAPGEF4 | 0.822848878 | 4.06E-12 |
| CHOL | IUPHAR | PAIP2B | CAT | 0.823789039 | 3.66E-12 |
| CHOL | IUPHAR | PAIP2B | ALDH2 | 0.832090052 | 1.42E-12 |
| CHOL | IUPHAR | PAIP2B | DBH | 0.832182559 | 1.40E-12 |
| CHOL | IUPHAR | PAIP2B | CYP39A1 | 0.83908 | 6.11E-13 |
| CHOL | IUPHAR | PAIP2B | ABAT | 0.839353616 | 5.91E-13 |
| CHOL | IUPHAR | PAIP2B | WNK3 | 0.840111593 | 5.38E-13 |
| CHOL | IUPHAR | PAIP2B | ABCA6 | 0.857582132 | 5.37E-14 |
| CHOL | Kinase | PAIP2B | WNK3 | 0.840111593 | 5.38E-13 |
| CHOL | TF | PAIP2B | ESR1 | 0.817655641 | 7.15E-12 |
| CHOL | TF | PAIP2B | ARID3C | 0.860235973 | 3.69E-14 |
| CHOL | TSG | PAIP2B | BMP10 | 0.800556589 | 4.09E-11 |
| CHOL | TSG | PAIP2B | ESR1 | 0.817655641 | 7.15E-12 |
| CHOL | TSG | PAIP2B | GLS2 | 0.819541807 | 5.83E-12 |
| CHOL | TSG | PAIP2B | CAT | 0.823789039 | 3.66E-12 |
| UVM | CGC | PAIP2B | RAF1 | 0.809604549 | 9.90E-20 |
| UVM | Epifactor | PAIP2B | SATB1 | 0.823894885 | 6.31E-21 |
| UVM | IUPHAR | PAIP2B | RAF1 | 0.809604549 | 9.90E-20 |
| UVM | IUPHAR | PAIP2B | SCN8A | 0.848311937 | 3.06E-23 |
| UVM | Kinase | PAIP2B | RAF1 | 0.809604549 | 9.90E-20 |
| UVM | TF | PAIP2B | ZXDC | 0.813847174 | 4.48E-20 |
| UVM | TF | PAIP2B | SATB1 | 0.823894885 | 6.31E-21 |
| UVM | TSG | PAIP2B | MTUS1 | 0.800431546 | 5.15E-19 |
Top |
|
| Protein 3D structure Visit iCn3D. |
Top |
|
| Protein-protein interaction networks * Overlap between up-regulated DEGs (log2FC<-1 and adj.P<0.05) and STRING PPI network (center: Translation factor, node: DEGs, edges: weighted by -log2(adj.P)) |
 |
| Overlap between down-regulated DEGs (log2FC>1 and adj.P<0.05) and STRING PPI network (center: Translation factor, node: DEGs, edges: weighted by -log2(adj.P)) |
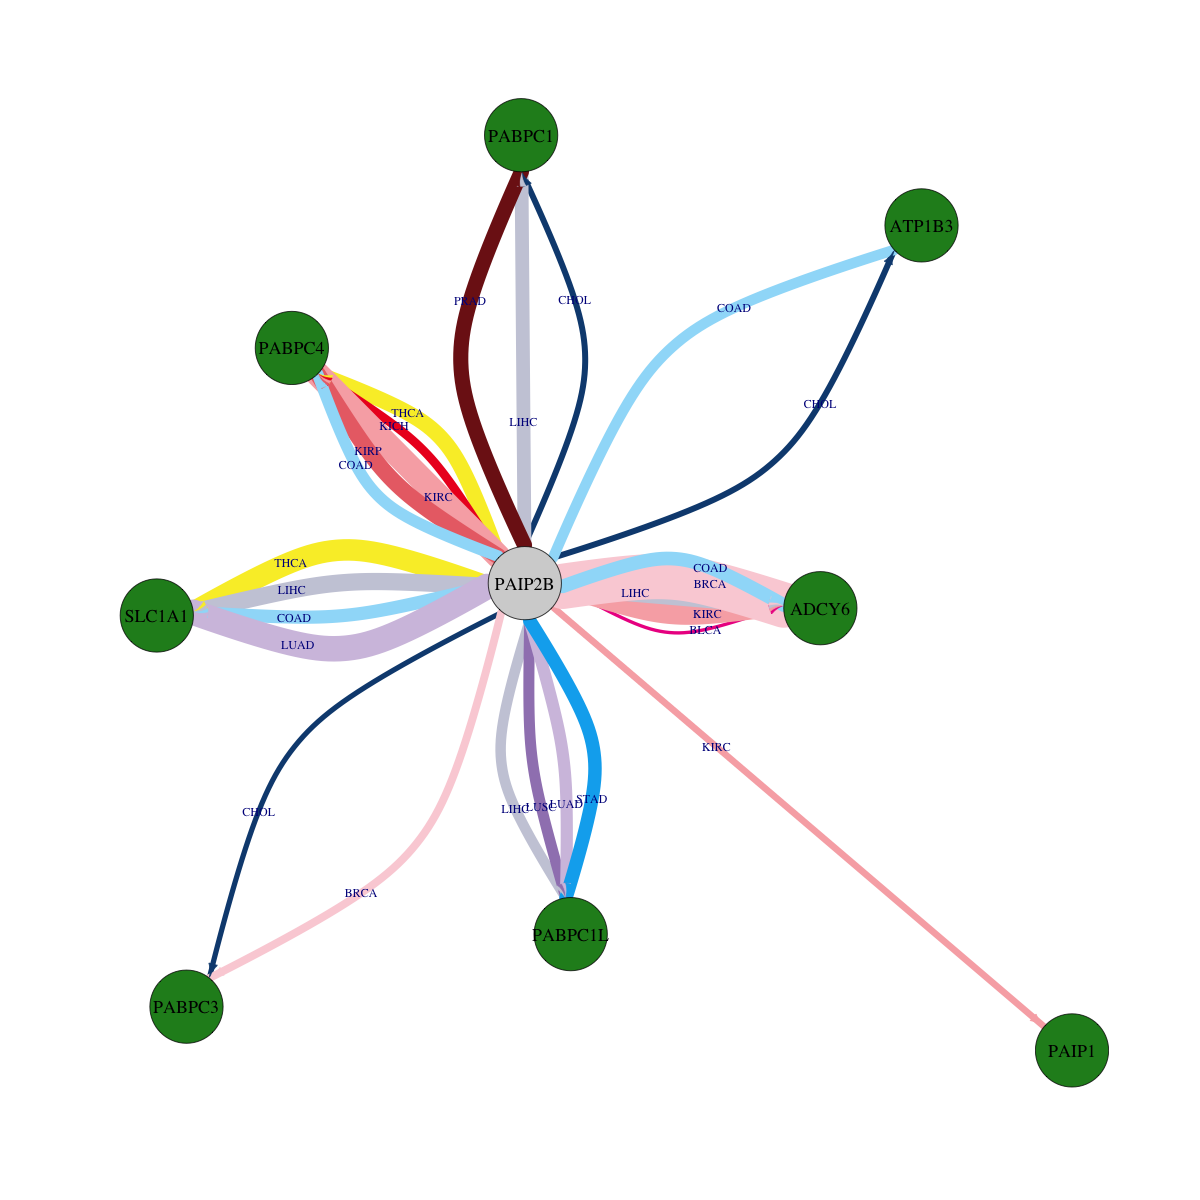 |
 * Edge colors based on TCGA cancer types. |
| * Overlap between DEGs (log2FC>1 and adj.P<0.05) and STRING PPI network per cancer (center: Translation factor, node: DEGs, node color: log2FC, edges: weighted by -log2(adj.P)) |
 |
| Cancer type | Translation factor | Interacting protein coding gene | FC | adj.pval |
| KICH | PAIP2B | PABPC4 | -1.36755201178157 | 0.000287055969238281 |
| BRCA | PAIP2B | PABPC3 | -3.84163884772227 | 0.000688782698821282 |
| KIRC | PAIP2B | PAIP1 | -5.71279064132007 | 0.00220467399393826 |
| CHOL | PAIP2B | ATP1B3 | -2.61811327561277 | 0.00390625 |
| CHOL | PAIP2B | PABPC1 | -4.56272528815353 | 0.00390625 |
| PRAD | PAIP2B | SLC1A1 | 1.19209763248206 | 0.00731863099602977 |
| CHOL | PAIP2B | PABPC3 | -1.20689409625496 | 0.0078125 |
| BLCA | PAIP2B | PABPC1 | 1.31485302792746 | 0.0180816650390625 |
| CHOL | PAIP2B | PABPC1L | 2.78331172494241 | 0.01953125 |
| BLCA | PAIP2B | ADCY6 | -1.62400696905527 | 0.0445594787597656 |
| BLCA | PAIP2B | SLC1A1 | 1.55522368404335 | 0.0493659973144531 |
| LIHC | PAIP2B | SLC1A1 | -1.19036601324842 | 1.22318557765184e-07 |
| LUAD | PAIP2B | PABPC1L | -2.51583026501524 | 1.30692790027182e-05 |
| KIRC | PAIP2B | PABPC4 | -1.49233512628432 | 1.55238188425888e-10 |
| BRCA | PAIP2B | PAIP1 | 1.33783668607252 | 1.59729685534959e-08 |
| COAD | PAIP2B | PABPC4 | -2.03666372801907 | 2.27093696594239e-05 |
| THCA | PAIP2B | SLC1A1 | -1.7343174708438 | 2.31189407147357e-09 |
| PRAD | PAIP2B | ADCY6 | 1.18317002132968 | 2.74398347191128e-05 |
| LUSC | PAIP2B | ATP1B3 | 3.12707108226298 | 2.79558697199975e-08 |
| LIHC | PAIP2B | ADCY6 | -2.37342600043136 | 2.84633422781438e-08 |
| LIHC | PAIP2B | PABPC1 | -1.72076961362188 | 2.98009622125841e-06 |
| KIRP | PAIP2B | PABPC4 | -2.80798320382911 | 2.98023223876953e-07 |
| COAD | PAIP2B | ADCY6 | -1.18375769948934 | 3.27825546264649e-06 |
| LUSC | PAIP2B | PABPC1L | -2.50538171229714 | 3.79466966402315e-05 |
| STAD | PAIP2B | PABPC1L | -2.43245436541992 | 4.02145087718964e-06 |
| THCA | PAIP2B | PABPC4 | -4.00250200468713 | 4.88626066707067e-07 |
| COAD | PAIP2B | SLC1A1 | -3.0474153272514 | 5.03659248352051e-06 |
| LUAD | PAIP2B | SLC1A1 | -3.30084545077193 | 5.75269129094147e-11 |
| COAD | PAIP2B | ATP1B3 | -1.17237984360016 | 6.03199005126954e-05 |
| LIHC | PAIP2B | PABPC1L | -2.77562492714404 | 6.17267413816717e-05 |
| HNSC | PAIP2B | ADCY6 | 1.65007439277528 | 6.70008830638836e-08 |
| BRCA | PAIP2B | ADCY6 | -1.38824996309554 | 7.02901412007711e-19 |
| KICH | PAIP2B | PABPC1L | 2.22531868187715 | 7.49826431274414e-05 |
| PRAD | PAIP2B | PABPC1 | -2.10200318363476 | 8.55379952759014e-07 |
| KIRC | PAIP2B | ADCY6 | -2.27287322399259 | 9.27019571822147e-09 |
| Protein-protein interactors with this translation factor (BIOGRID-3.4.160) |
| PPI interactors with PAIP2B |
| PABPC1, HNRNPA1, DND1, LUC7L2, ELAVL2, CELF5, CIRBP, RBM3, SNIP1, PAIP2, C17orf85, H2AFB3, CASC3, MKRN1, RBMS2, PABPC4L, SREK1, PABPC1L, H2AFX, CLK3, CLK2, MOV10, PDCD11, MKRN2, UPF1, ZNF326, MRPL11, ZCCHC3, ALYREF, SRSF1, PRR3, LARP4B, BCLAF1, YTHDC1, NCBP1, LARP1, PUM2, LARP1B, SCAF1, RBMXL1, H2AFB2, PURG, PABPC5, ZC3H11A, PAIP1, YBX1, FAM120A, HNRNPCL1, ZFR, DKC1, PABPC4, |
Top |
|
| Clinically associated variants from ClinVar. |
| Gene | Chr | Position | RefSeq | VarSeq | RefSeeq | VarType | Pathogenic | Disease | VarInfo |
| nsSNVs with sample frequency (size of circle) from TCGA 33 cancers. |
 |
| SNVs and Indels |
| Gene | Cancer type | Chromosome | Start | End | RefSeeq | MutSeq | Mutation type | AAchange | # samples |
| PAIP2B | PAAD | chr2 | 71417026 | 71417026 | C | T | Silent | p.Q88Q | 2 |
| PAIP2B | BLCA | chr2 | 71415650 | 71415650 | T | C | Missense_Mutation | p.N111D | 2 |
| PAIP2B | SKCM | chr2 | 71429639 | 71429639 | C | T | Silent | p.K27K | 2 |
| PAIP2B | SKCM | chr2 | 71417122 | 71417122 | G | A | Silent | p.F56F | 2 |
| PAIP2B | HNSC | chr2 | 71429712 | 71429712 | C | A | Missense_Mutation | p.G3V | 2 |
| PAIP2B | CESC | chr2 | 71417103 | 71417103 | C | G | Missense_Mutation | 2 | |
| PAIP2B | LIHC | chr2 | 71417134 | 71417134 | C | T | Silent | 2 | |
| PAIP2B | UCEC | chr2 | 71415636 | 71415636 | C | A | Missense_Mutation | p.K115N | 2 |
| PAIP2B | UCEC | chr2 | 71417072 | 71417072 | A | C | Missense_Mutation | p.F73C | 2 |
| PAIP2B | UCEC | chr2 | 71429712 | 71429712 | C | T | Missense_Mutation | p.G3E | 2 |
| PAIP2B | COAD | chr2 | 71429650 | 71429650 | G | A | Missense_Mutation | p.H24Y | 1 |
| PAIP2B | LUAD | chr2 | 71429701 | 71429701 | C | A | Missense_Mutation | p.A7S | 1 |
| PAIP2B | DLBC | chr2 | 71415619 | 71415619 | T | C | Missense_Mutation | p.E121G | 1 |
| PAIP2B | ESCA | chr2 | 71417056 | 71417056 | G | T | Missense_Mutation | p.D78E | 1 |
| PAIP2B | SARC | chr2 | 71417113 | 71417113 | G | T | Silent | 1 | |
| PAIP2B | ESCA | chr2 | 71417056 | 71417056 | G | T | Missense_Mutation | 1 | |
| PAIP2B | BLCA | chr2 | 71429644 | 71429644 | C | T | Missense_Mutation | p.E26K | 1 |
| PAIP2B | GBM | chr2 | 71429660 | 71429660 | C | T | Silent | 1 | |
| PAIP2B | BLCA | chr2 | 71417133 | 71417133 | C | T | Missense_Mutation | p.E53K | 1 |
| PAIP2B | HNSC | chr2 | 71429712 | 71429712 | C | A | Missense_Mutation | 1 | |
| PAIP2B | SKCM | chr2 | 71417066 | 71417066 | G | A | Missense_Mutation | p.P75L | 1 |
| PAIP2B | CESC | chr2 | 71429694 | 71429694 | G | T | Missense_Mutation | 1 | |
| PAIP2B | SKCM | chr2 | 71417067 | 71417067 | G | A | Missense_Mutation | p.P75S | 1 |
| PAIP2B | KIRP | chr2 | 71417143 | 71417143 | C | A | Missense_Mutation | 1 | |
| PAIP2B | TGCT | chr2 | 71417065 | 71417065 | G | T | Silent | 1 | |
| PAIP2B | CESC | chr2 | 71417103 | 71417103 | C | G | Missense_Mutation | p.E63Q | 1 |
| PAIP2B | COAD | chr2 | 71417008 | 71417008 | T | C | Silent | p.S94S | 1 |
| PAIP2B | LIHC | chr2 | 71429687 | 71429687 | C | G | Silent | 1 | |
| PAIP2B | COAD | chr2 | 71417134 | 71417134 | C | T | Silent | p.Q52Q | 1 |
| PAIP2B | LUAD | chr2 | 71415647 | 71415647 | G | T | Missense_Mutation | p.P112T | 1 |
| Copy number variation (CNV) of PAIP2B * Click on the image to open the original image in a new window. |
 |
| Fusion gene breakpoints (product of the structural variants (SVs)) across PAIP2B * Click on the image to open the UCSC genome browser with custom track showing this image in a new window. |
 |
| Fusion genes with this translation factor from FusionGDB2.0. |
| FusionGDB2 ID | Disease | Sample | Hgene | Hchr | Hbp | Hstrand | Tgene | Tchr | Tbp | Tstrand |
| 98397 | N/A | AV689750 | G2E3 | chr14 | 31074777 | + | PAIP2B | chr2 | 71442078 | + |
| 85212 | N/A | AI525177 | PAIP2B | chr2 | 71415858 | - | PSME4 | chr2 | 54174602 | - |
| 97771 | N/A | H19903 | PAIP2B | chr2 | 71412679 | - | YEATS2 | chr3 | 183529985 | + |
| 98397 | N/A | AI804731 | TANGO6 | chr16 | 68900174 | + | PAIP2B | chr2 | 71413987 | + |
| 98397 | UCEC | TCGA-BG-A3PP-01A | VAX2 | chr2 | 71127998 | + | PAIP2B | chr2 | 71429730 | - |
| 98398 | N/A | AK094335 | VPS36 | chr13 | 53004085 | - | PAIP2B | chr2 | 71454201 | - |
Top |
|
| Kaplan-Meier plots with logrank tests of overall survival (OS) |
 |
| Cancer type | Translation factor | Coefficent | Hazard ratio | Wald test pval | Likelihool ratio pval | Logrank test pval | # samples |
Top |
|
| Differential gene expression between female and male. (Wilcoxon test, pval<0.05) |
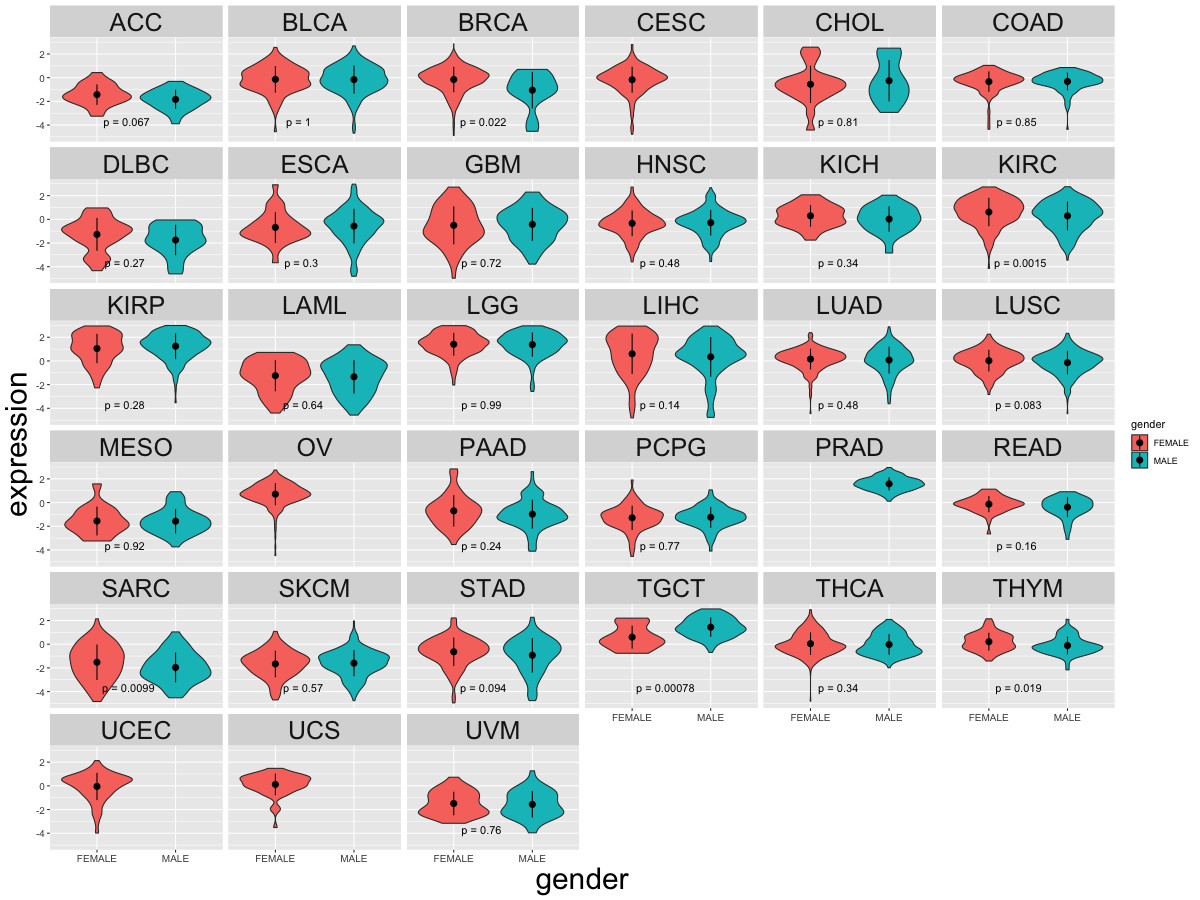 |
| Cancer type | Translation factor | pval | adj.p |
| KIRC | PAIP2B | 0.00022082357398957 | 0.0062 |
| TGCT | PAIP2B | 0.000592223003729502 | 0.016 |
| SARC | PAIP2B | 0.0138486893837552 | 0.36 |
| THYM | PAIP2B | 0.0189541218541445 | 0.47 |
| BRCA | PAIP2B | 0.0227561259992179 | 0.55 |
| LIHC | PAIP2B | 0.0368001890982104 | 0.85 |
Top |
|
| Differential gene expression between young and old age groups (Wilcoxon test, pval<0.05) |
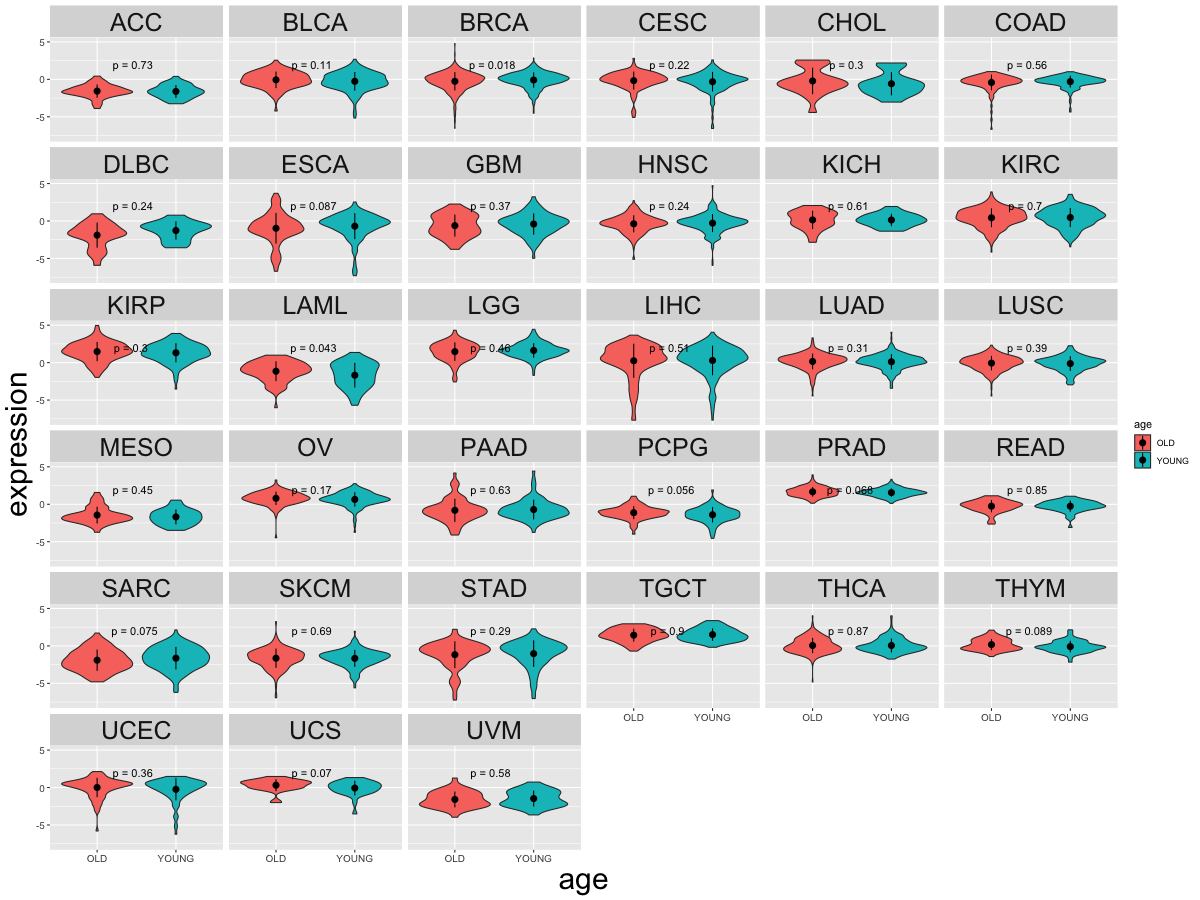 |
| Cancer type | Translation factor | pval | adj.p |
| LAML | PAIP2B | 0.0426802089501672 | 1 |
| BRCA | PAIP2B | 0.0184018785157734 | 0.61 |
Top |
|
| Drugs targeting genes involved in this translation factor. (DrugBank Version 5.1.8 2021-05-08) |
| UniProtAcc | DrugBank ID | Drug name | Drug activity | Drug type | Drug status |
Top |
|
| Diseases associated with this translation factor. (DisGeNet 4.0) |
| Disease ID | Disease Name | # PubMeds | Disease source |
(UTHealth)
Web File Viewing | Emergency Information |Campus Carry|Site Policies