
|
||||||
|

Translation Factor: DRG1 (NCBI Gene ID:4733) |
|
 Gene Summary Gene Summary |
| Gene Information | Gene Name: DRG1 | Gene ID: 4733 | Gene Symbol | DRG1 | Gene ID | 4733 |
| Gene Name | developmentally regulated GTP binding protein 1 | |
| Synonyms | NEDD3 | |
| Cytomap | 22q12.2 | |
| Type of Gene | protein-coding | |
| Description | developmentally-regulated GTP-binding protein 1DRG-1NEDD-3TRAFAC GTPase DRG1neural precursor cell expressed developmentally down-regulated protein 3neural precursor cell expressed, developmentally down-regulated 3translation factor GTPase DRG1 | |
| Modification date | 20200313 | |
| UniProtAcc | Q9Y295 | |
| Child GO biological process term(s) under GO:0006412 |
| GO ID | GO term |
| GO:0002181 | Cytoplasmic translation |
| GO:0006412 | Translation |
| Gene ontology of translaction factor with evidence of Inferred from Direct Assay (IDA) from Entrez |
| Partner | Gene | GO ID | GO term | PubMed ID |
| Inferred gene age of translation factor. |
| Gene | Inferred gene age group among (0 - 67.6], (67.6 - 355.7], (355.7 - 733], (733 - 1119.25], >1119.25 |
Top |
|
| We searched PubMed using 'DRG1[title] AND translation [title] AND human.' |
| Gene | Title | PMID |
| DRG1 | . | . |
Top |
|
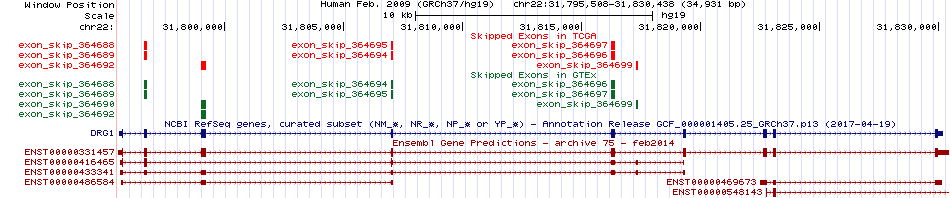
| Skipped exons in TCGA and GTEx based on Ensembl gene isoform structure. * Click on the image to open the UCSC genome browser with custom track showing this image in a new window. For more annotations, please visit our ExonSkipDB. |
 |
| Open reading frame (ORF) analsis of exon skipping events based on Ensembl gene isoform structure. * Click on the break point to see the gene structure around the break point region using the UCSC Genome Browser. |
| ENST | Exon skip start (DNA) | Exon Skip end (DNA) | ORF |
| ENST00000331457 | 31799014 | 31799190 | Frame-shift |
| ENST00000331457 | 31806997 | 31807067 | Frame-shift |
| ENST00000331457 | 31816241 | 31816411 | Frame-shift |
| Exon skipping position in the amino acid sequence. |
| ENST | Exon skip start (DNA) | Exon Skip end (DNA) | Len(transcript seq) | Exon skip start (mRNA) | Exon Skip end (mRNA) | Len(amino acid seq) | Exon skip start (AA) | Exon Skip end (AA) |
| Potentially (partially) lost protein functional features of UniProt. |
| UniProtAcc | Exon skip start (AA) | Exon Skip end (AA) | Function feature start (AA) | Function feature end (AA) | Functional feature type | Functional feature desc. |
Top |
|
| Gene expression level across TCGA pancancer |
 |
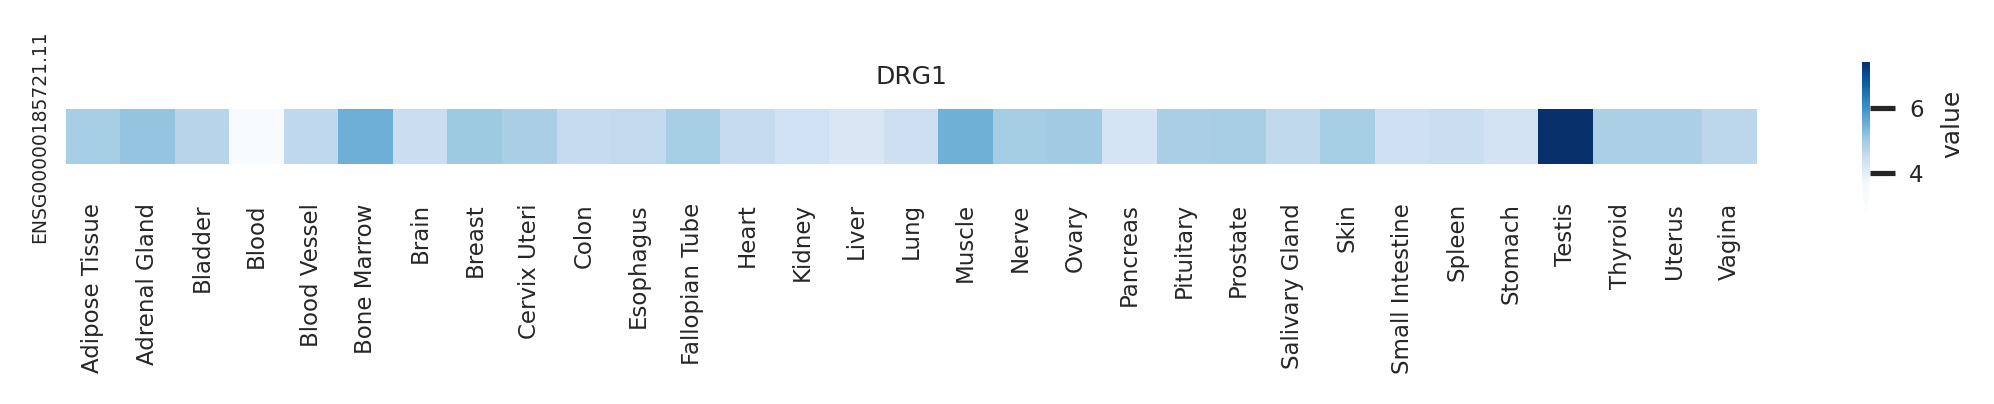
| Gene expression level across GTEx pantissue |
 |
| Expression level of gene isoforms across TCGA pancancer |
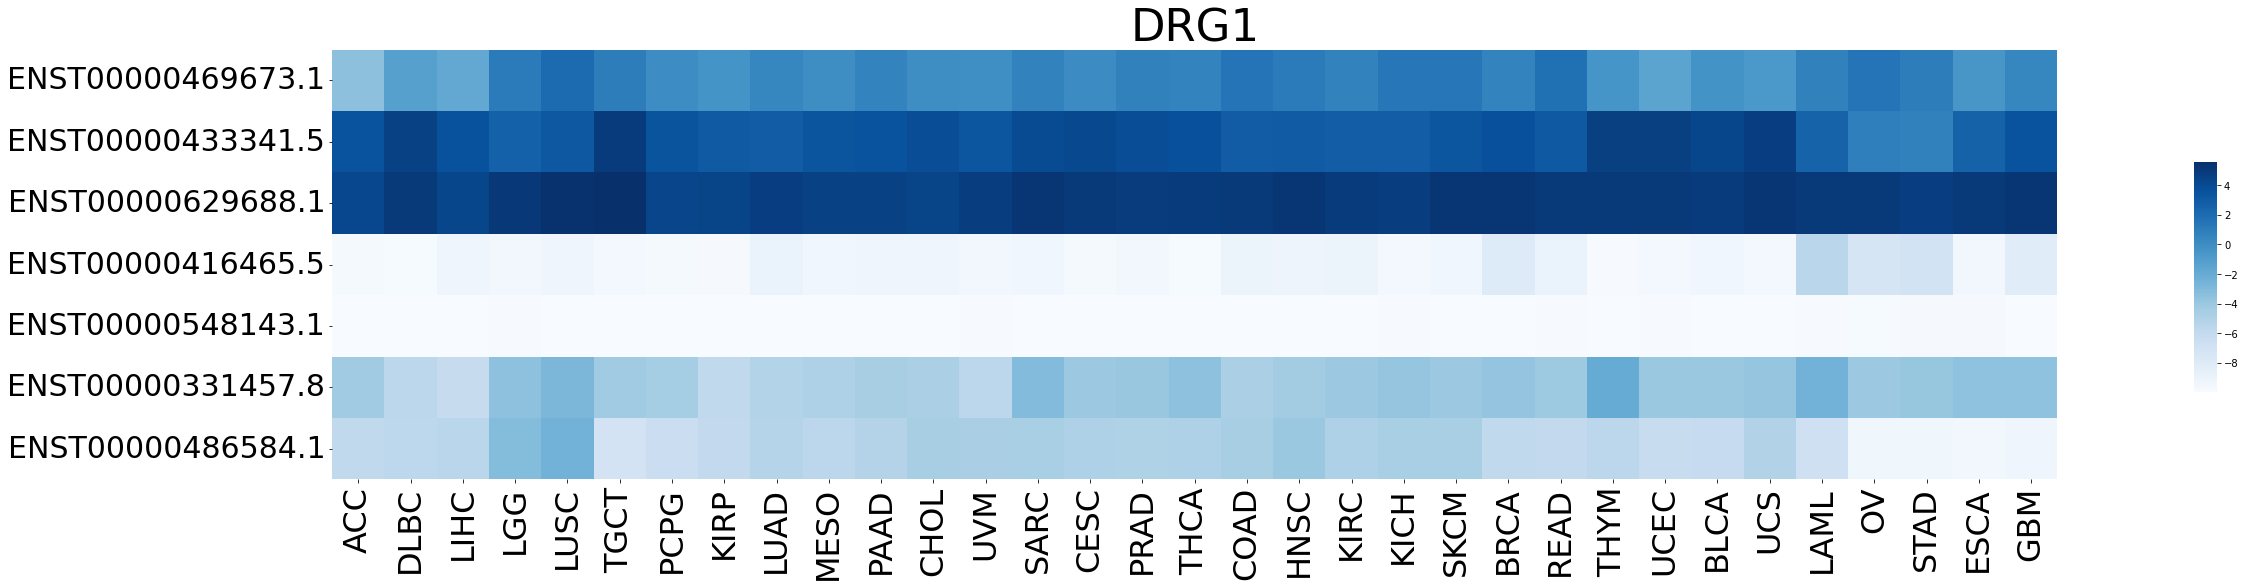 |
| Expression level of gene isoforms across GTEx pantissue |
 |
| Cancer(tissue) type-specific expression level of Translation factor using z-score distriution |
 |
| Differential expression between tumor and matched normal (in the cancer types with more than 10 matched samples) |
 |
| Cancer type | Translation factor | FC | adj.pval |
| LUAD | DRG1 | -1.38896782665224 | 0.00022838170846318 |
| KIRC | DRG1 | -4.16008421708878 | 0.0152218459760014 |
| CHOL | DRG1 | -2.74036943476079 | 0.01953125 |
Top |
|
| Translation factor expression regulation through miRNA binding |
| Cancer type | Gene | miRNA | TargetScan binding score (Context++ score percentile) | Coefficient | Pvalue |
| Translation factor expression regulation through methylation in the promoter of Translation factor |
 |
| Cancer type | Gene | methyl group b | methyl group a | DEG pval | avg methyl in b | avg methyl in a | avg exp in b | avg exp in a |
| Translation factor expression regulation through methylation in the gene body of Translation factor (positive regulation) |
 |
| Cancer type | Gene | methyl group b | methyl group a | DEG pval | avg methyl in b | avg methyl in a | avg exp in b | avg exp in a |
| Translation factor expression regulation through copy number variation of Translation factor |
 |
| Cancer type | Gene | Coefficient | Pvalue |
| KIRP | DRG1 | -0.055599163 | 0.013678164 |
Top |
|
| Strongly correlated genes belong to cellular important gene groups with DRG1 (coefficient>0.8, pval<0.05, node color based on FC between tumor and matched normal). Significantly associated important genes in the individual cancer types. * Cell metabolism gene: cell metabolism genes from REACTOME (black edge), IUPHAR: drug target genes from IUPHAR (blue edge), Kinase: human kinase genes (brown edge), CGC: cancer gene census genes (orange edge), TSG: tumor suppresor genes (purple edge), Epifactor: epigenetic factors (light blue edge), TF: transcription factors (green) |
 |
| Cancer type | Gene group | Translation factor | Correlated gene | Coefficient | Pvalue |
| DLBC | Cell metabolism gene | DRG1 | SUCLG1 | 0.800538102 | 8.53E-12 |
| DLBC | Cell metabolism gene | DRG1 | TIMM10 | 0.800590425 | 8.48E-12 |
| DLBC | Cell metabolism gene | DRG1 | MDH2 | 0.802935663 | 6.64E-12 |
| DLBC | Cell metabolism gene | DRG1 | ATP5G1 | 0.803212867 | 6.45E-12 |
| DLBC | Cell metabolism gene | DRG1 | EXOSC4 | 0.806471545 | 4.56E-12 |
| DLBC | Cell metabolism gene | DRG1 | SNRPD2 | 0.809737496 | 3.20E-12 |
| DLBC | Cell metabolism gene | DRG1 | PSMB3 | 0.812591209 | 2.34E-12 |
| DLBC | Cell metabolism gene | DRG1 | PSMD8 | 0.81590855 | 1.61E-12 |
| DLBC | Cell metabolism gene | DRG1 | MIF | 0.817300206 | 1.37E-12 |
| DLBC | Cell metabolism gene | DRG1 | POLR2F | 0.831019226 | 2.67E-13 |
| DLBC | Cell metabolism gene | DRG1 | TIMM13 | 0.832668746 | 2.17E-13 |
| DLBC | Cell metabolism gene | DRG1 | SNRPE | 0.836535499 | 1.33E-13 |
| DLBC | Cell metabolism gene | DRG1 | DTYMK | 0.855809132 | 9.21E-15 |
| DLBC | Cell metabolism gene | DRG1 | SNRPB | 0.857532438 | 7.12E-15 |
| DLBC | Cell metabolism gene | DRG1 | TOMM22 | 0.861988309 | 3.61E-15 |
| DLBC | Cell metabolism gene | DRG1 | PSMC3 | 0.864021564 | 2.62E-15 |
| DLBC | Cell metabolism gene | DRG1 | ADSL | 0.8697603 | 1.04E-15 |
| DLBC | Cell metabolism gene | DRG1 | SNRPD3 | 0.877821154 | 2.61E-16 |
| DLBC | Cell metabolism gene | DRG1 | SAMM50 | 0.881595256 | 1.32E-16 |
| DLBC | Cell metabolism gene | DRG1 | TIMM50 | 0.886166607 | 5.63E-17 |
| DLBC | CGC | DRG1 | U2AF1 | 0.817508075 | 1.34E-12 |
| DLBC | Epifactor | DRG1 | EXOSC4 | 0.806471545 | 4.56E-12 |
| DLBC | Epifactor | DRG1 | RRP8 | 0.81266552 | 2.32E-12 |
| DLBC | Epifactor | DRG1 | RUVBL2 | 0.856827588 | 7.92E-15 |
| DLBC | IUPHAR | DRG1 | MFSD2B | 0.8176661 | 1.32E-12 |
| DLBC | IUPHAR | DRG1 | BIRC5 | 0.854050825 | 1.19E-14 |
| DLBC | TSG | DRG1 | GADD45GIP1 | 0.834207964 | 1.79E-13 |
| DLBC | TSG | DRG1 | PHB | 0.859278919 | 5.47E-15 |
| ESCA | Cell metabolism gene | DRG1 | SNRPD3 | 0.812335972 | 2.59E-47 |
| GBM | Cell metabolism gene | DRG1 | HSCB | 0.801240233 | 9.17E-40 |
| GBM | Cell metabolism gene | DRG1 | ADSL | 0.859054913 | 2.57E-51 |
| GBM | Cell metabolism gene | DRG1 | TOMM22 | 0.882003116 | 1.96E-57 |
| GBM | Epifactor | DRG1 | RBX1 | 0.838158336 | 1.28E-46 |
| KIRP | Cell metabolism gene | DRG1 | TOMM22 | 0.822810558 | 9.03E-81 |
| LGG | Cell metabolism gene | DRG1 | TOMM22 | 0.814744294 | 4.45E-127 |
| LUSC | Cell metabolism gene | DRG1 | ADSL | 0.806818973 | 4.87E-128 |
| LUSC | Cell metabolism gene | DRG1 | TOMM22 | 0.823576952 | 8.43E-138 |
| MESO | Cell metabolism gene | DRG1 | POLR2F | 0.806071623 | 4.60E-21 |
| MESO | Cell metabolism gene | DRG1 | TOMM22 | 0.812817019 | 1.19E-21 |
| PRAD | Cell metabolism gene | DRG1 | TOMM22 | 0.803037438 | 2.71E-125 |
| READ | Cell metabolism gene | DRG1 | SNRPD3 | 0.802508814 | 7.69E-25 |
| READ | Cell metabolism gene | DRG1 | POLR2F | 0.810236393 | 1.22E-25 |
| READ | Cell metabolism gene | DRG1 | TOMM22 | 0.856232236 | 2.60E-31 |
| TGCT | Cell metabolism gene | DRG1 | TUBA1C | 0.824733178 | 5.85E-40 |
| TGCT | Cell metabolism gene | DRG1 | NOP56 | 0.829758902 | 7.65E-41 |
| TGCT | Cell metabolism gene | DRG1 | ADSL | 0.863286091 | 1.38E-47 |
| TGCT | Cell metabolism gene | DRG1 | TOMM22 | 0.865700333 | 3.85E-48 |
| TGCT | Epifactor | DRG1 | TRIM28 | 0.810502733 | 1.33E-37 |
| TGCT | IUPHAR | DRG1 | TRIM28 | 0.810502733 | 1.33E-37 |
| TGCT | Kinase | DRG1 | TRIM28 | 0.810502733 | 1.33E-37 |
| TGCT | TF | DRG1 | MYBL2 | 0.819571559 | 4.42E-39 |
| THYM | Cell metabolism gene | DRG1 | SNRPB | 0.800195161 | 2.05E-28 |
| THYM | Cell metabolism gene | DRG1 | LSM3 | 0.800274445 | 2.01E-28 |
| THYM | Cell metabolism gene | DRG1 | SLC27A5 | 0.803762601 | 7.80E-29 |
| THYM | Cell metabolism gene | DRG1 | IDH3B | 0.813521569 | 4.99E-30 |
| THYM | Cell metabolism gene | DRG1 | LSM2 | 0.821991893 | 4.02E-31 |
| THYM | Cell metabolism gene | DRG1 | ACOT8 | 0.823805923 | 2.30E-31 |
| THYM | Cell metabolism gene | DRG1 | PSMB7 | 0.829084538 | 4.39E-32 |
| THYM | Cell metabolism gene | DRG1 | PSMC3 | 0.830263221 | 3.01E-32 |
| THYM | Cell metabolism gene | DRG1 | GCDH | 0.830779849 | 2.54E-32 |
| THYM | Cell metabolism gene | DRG1 | TIMM13 | 0.840583979 | 9.65E-34 |
| THYM | Cell metabolism gene | DRG1 | POLR2F | 0.842302062 | 5.32E-34 |
| THYM | Cell metabolism gene | DRG1 | SNRPD2 | 0.842494726 | 4.97E-34 |
| THYM | Cell metabolism gene | DRG1 | SNRPD3 | 0.85233872 | 1.41E-35 |
| THYM | Cell metabolism gene | DRG1 | POLD2 | 0.856549347 | 2.83E-36 |
| THYM | Cell metabolism gene | DRG1 | TOMM22 | 0.874192332 | 1.86E-39 |
| THYM | CGC | DRG1 | RBM10 | 0.803475904 | 8.44E-29 |
| THYM | CGC | DRG1 | TFPT | 0.845863555 | 1.51E-34 |
| THYM | Epifactor | DRG1 | TRIM28 | 0.804210995 | 6.90E-29 |
| THYM | Epifactor | DRG1 | FBL | 0.806645828 | 3.52E-29 |
| THYM | Epifactor | DRG1 | PAF1 | 0.818124599 | 1.29E-30 |
| THYM | Epifactor | DRG1 | PRPF31 | 0.818298664 | 1.23E-30 |
| THYM | Epifactor | DRG1 | RUVBL2 | 0.832044098 | 1.69E-32 |
| THYM | Epifactor | DRG1 | TFPT | 0.845863555 | 1.51E-34 |
| THYM | IUPHAR | DRG1 | SLC27A5 | 0.803762601 | 7.80E-29 |
| THYM | IUPHAR | DRG1 | TRIM28 | 0.804210995 | 6.90E-29 |
| THYM | IUPHAR | DRG1 | PPIA | 0.809208515 | 1.72E-29 |
| THYM | Kinase | DRG1 | TRIM28 | 0.804210995 | 6.90E-29 |
| THYM | TF | DRG1 | ZNF428 | 0.807461471 | 2.80E-29 |
| THYM | TF | DRG1 | THYN1 | 0.812119679 | 7.48E-30 |
| THYM | TF | DRG1 | PIN1 | 0.818700106 | 1.09E-30 |
| THYM | TSG | DRG1 | PIN1 | 0.818700106 | 1.09E-30 |
| THYM | TSG | DRG1 | GNB2L1 | 0.854505014 | 6.21E-36 |
| UCS | Cell metabolism gene | DRG1 | SNRPB | 0.800195161 | 2.05E-28 |
| UCS | Cell metabolism gene | DRG1 | LSM3 | 0.800274445 | 2.01E-28 |
| UCS | Cell metabolism gene | DRG1 | SLC27A5 | 0.803762601 | 7.80E-29 |
| UCS | Cell metabolism gene | DRG1 | IDH3B | 0.813521569 | 4.99E-30 |
| UCS | Cell metabolism gene | DRG1 | LSM2 | 0.821991893 | 4.02E-31 |
| UCS | Cell metabolism gene | DRG1 | ACOT8 | 0.823805923 | 2.30E-31 |
| UCS | Cell metabolism gene | DRG1 | PSMB7 | 0.829084538 | 4.39E-32 |
| UCS | Cell metabolism gene | DRG1 | PSMC3 | 0.830263221 | 3.01E-32 |
| UCS | Cell metabolism gene | DRG1 | GCDH | 0.830779849 | 2.54E-32 |
| UCS | Cell metabolism gene | DRG1 | TIMM13 | 0.840583979 | 9.65E-34 |
| UCS | Cell metabolism gene | DRG1 | POLR2F | 0.842302062 | 5.32E-34 |
| UCS | Cell metabolism gene | DRG1 | SNRPD2 | 0.842494726 | 4.97E-34 |
| UCS | Cell metabolism gene | DRG1 | SNRPD3 | 0.85233872 | 1.41E-35 |
| UCS | Cell metabolism gene | DRG1 | POLD2 | 0.856549347 | 2.83E-36 |
| UCS | Cell metabolism gene | DRG1 | TOMM22 | 0.874192332 | 1.86E-39 |
| UCS | CGC | DRG1 | RBM10 | 0.803475904 | 8.44E-29 |
| UCS | CGC | DRG1 | TFPT | 0.845863555 | 1.51E-34 |
| UCS | Epifactor | DRG1 | TRIM28 | 0.804210995 | 6.90E-29 |
| UCS | Epifactor | DRG1 | FBL | 0.806645828 | 3.52E-29 |
| UCS | Epifactor | DRG1 | PAF1 | 0.818124599 | 1.29E-30 |
| UCS | Epifactor | DRG1 | PRPF31 | 0.818298664 | 1.23E-30 |
| UCS | Epifactor | DRG1 | RUVBL2 | 0.832044098 | 1.69E-32 |
| UCS | Epifactor | DRG1 | TFPT | 0.845863555 | 1.51E-34 |
| UCS | IUPHAR | DRG1 | SLC27A5 | 0.803762601 | 7.80E-29 |
| UCS | IUPHAR | DRG1 | TRIM28 | 0.804210995 | 6.90E-29 |
| UCS | IUPHAR | DRG1 | PPIA | 0.809208515 | 1.72E-29 |
| UCS | Kinase | DRG1 | TRIM28 | 0.804210995 | 6.90E-29 |
| UCS | TF | DRG1 | ZNF428 | 0.807461471 | 2.80E-29 |
| UCS | TF | DRG1 | THYN1 | 0.812119679 | 7.48E-30 |
| UCS | TF | DRG1 | PIN1 | 0.818700106 | 1.09E-30 |
| UCS | TSG | DRG1 | PIN1 | 0.818700106 | 1.09E-30 |
| UCS | TSG | DRG1 | GNB2L1 | 0.854505014 | 6.21E-36 |
Top |
|
| Protein 3D structure Visit iCn3D. |
Top |
|
| Protein-protein interaction networks * Overlap between up-regulated DEGs (log2FC<-1 and adj.P<0.05) and STRING PPI network (center: Translation factor, node: DEGs, edges: weighted by -log2(adj.P)) |
 |
| Overlap between down-regulated DEGs (log2FC>1 and adj.P<0.05) and STRING PPI network (center: Translation factor, node: DEGs, edges: weighted by -log2(adj.P)) |
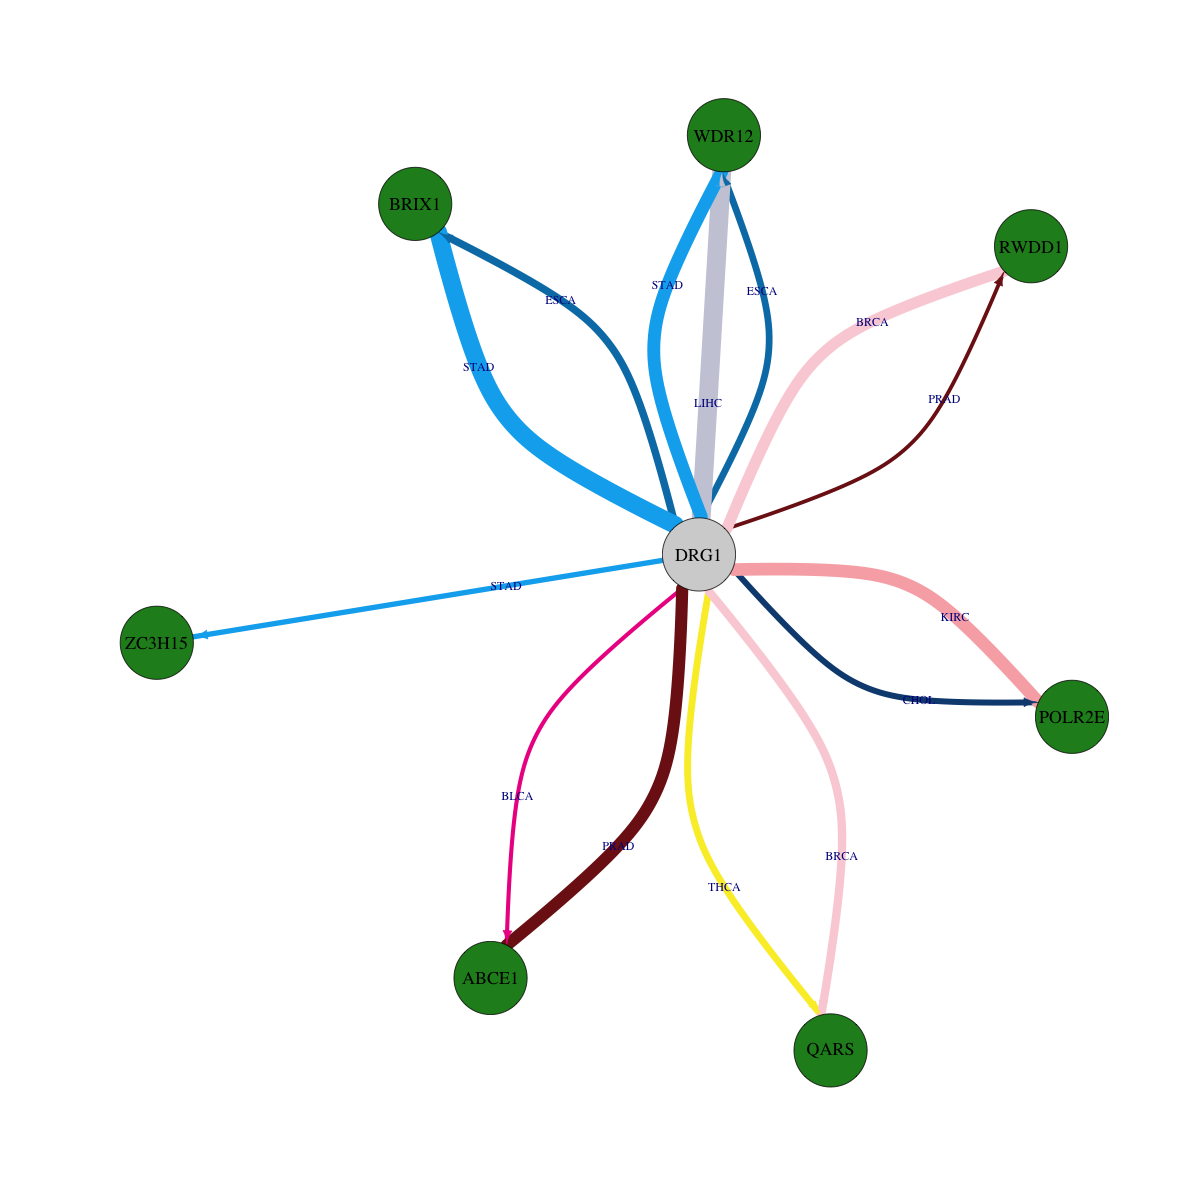 |
 * Edge colors based on TCGA cancer types. |
| * Overlap between DEGs (log2FC>1 and adj.P<0.05) and STRING PPI network per cancer (center: Translation factor, node: DEGs, node color: log2FC, edges: weighted by -log2(adj.P)) |
 |
| Cancer type | Translation factor | Interacting protein coding gene | FC | adj.pval |
| BRCA | DRG1 | QARS | -4.19270554058168 | 0.00045278023754438 |
| KICH | DRG1 | WDR12 | 1.27437010311891 | 0.000631332397460937 |
| BRCA | DRG1 | ABCE1 | 1.3740626146648 | 0.000669229587514616 |
| ESCA | DRG1 | BRIX1 | -3.68972417085688 | 0.0009765625 |
| KIRP | DRG1 | POLR2E | 1.23265401096991 | 0.00143672106787562 |
| THCA | DRG1 | QARS | -1.4601543520666 | 0.00171161769998529 |
| ESCA | DRG1 | WDR12 | -4.50085604434153 | 0.001953125 |
| LIHC | DRG1 | ABCE1 | 1.33775121002715 | 0.0033398145023608 |
| CHOL | DRG1 | POLR2E | -5.34523892600449 | 0.00390625 |
| STAD | DRG1 | ZC3H15 | -1.04968618173197 | 0.00733334058895707 |
| ESCA | DRG1 | RWDD1 | 1.43074573953025 | 0.009765625 |
| HNSC | DRG1 | ABCE1 | 1.20332081233659 | 0.0124875666290336 |
| BLCA | DRG1 | ABCE1 | -4.08863120087471 | 0.0229873657226562 |
| BLCA | DRG1 | ZC3H15 | 1.07480871713981 | 0.0258216857910156 |
| PRAD | DRG1 | RWDD1 | -1.37015889011473 | 0.0291755363147523 |
| KICH | DRG1 | POLR2E | 2.04319971062501 | 1.23381614685059e-05 |
| PRAD | DRG1 | ABCE1 | -2.9089513514626 | 1.31460603050763e-05 |
| LIHC | DRG1 | WDR12 | -3.16467679630325 | 2.54824448841554e-08 |
| BRCA | DRG1 | POLR2E | 1.06411979989366 | 2.7227965426238e-05 |
| BRCA | DRG1 | RWDD1 | -1.13785288766259 | 3.18183978181012e-05 |
| PRAD | DRG1 | QARS | 1.84374784424986 | 3.33417295851411e-06 |
| STAD | DRG1 | WDR12 | -2.46721337744962 | 6.79492950439454e-06 |
| STAD | DRG1 | BRIX1 | -4.28173420731282 | 7.8696757555008e-08 |
| KIRC | DRG1 | POLR2E | -2.38370423485223 | 8.04051937698217e-06 |
| Protein-protein interactors with this translation factor (BIOGRID-3.4.160) |
| PPI interactors with DRG1 |
| RWDD1, CAPNS1, HDGF, ZC3H15, UBE2I, GRB2, TAL1, BARD1, BRCA1, PAXIP1, VCAM1, FN1, ITGA4, CLDN1, SRPK2, HECW2, WWOX, PHKG2, STAU1, PHC2, SKIL, COIL, STK16, SSX2IP, CUL7, CCDC8, ABL1, MAST3, LRRC41, NTMT1, HAO1, CAND1, CAND2, FEN1, IFRD2, KIF23, NAA15, SFN, NTRK1, XPO1, RPL10, Rpl35, Rrbp1, SNW1, CDC5L, OSCP1, COPZ1, SARNP, SUB1, CHORDC1, DIS3, ZC3HAV1, SEPT7, PRCC, CDK5, SH3GLB1, CYLD, MTF1, BRD1, TRIM14, EGLN3, EFTUD2, RIOK1, ESR2, HEXIM1, MEPCE, LARP7, RECQL4, Prkaa1, Prkab1, ATG16L1, PHB, KRAS, NR2C2, SNRNP70, BIRC3, LMBR1L, NFX1, BRD7, LNX1, MEOX2, PLEKHA4, PTEN, HCVgp1, RASA1, N, nsp8, ESR1, CIT, KIF14, RNF11, Apc2, IFI16, CUL4A, DNAJC2, RPL10A, HSPA14, RPL4, RPL6, RPL7, RPL7A, RPL8, RPL18, RPLP0, TCEB1, TCEB2, DNAJC1, ACADSB, MKRN1, SPOP, UFL1, DDRGK1, AIFM1, AKAP1, ANAPC2, CLIP1, CXADR, DHFRL1, KRT19, LAMTOR1, LCK, POLR2C, PRPH, SQSTM1, FZR1, WDR5, SOSTDC1, ACTA2, EP300, FBXW7, SIRT6, |
Top |
|
| Clinically associated variants from ClinVar. |
| Gene | Chr | Position | RefSeq | VarSeq | RefSeeq | VarType | Pathogenic | Disease | VarInfo |
| DRG1 | chr22 | 31796605 | G | T | single_nucleotide_variant | Uncertain_significance | Neurodevelopmental_disorder | SO:0001574|splice_acceptor_variant | SO:0001574|splice_acceptor_variant |
| DRG1 | chr22 | 31796681 | C | T | single_nucleotide_variant | Likely_pathogenic | Flexion_contracture | SO:0001587|nonsense | SO:0001587|nonsense |
| nsSNVs with sample frequency (size of circle) from TCGA 33 cancers. |
 |
| SNVs and Indels |
| Gene | Cancer type | Chromosome | Start | End | RefSeeq | MutSeq | Mutation type | AAchange | # samples |
| DRG1 | BLCA | chr22 | 31822619 | 31822619 | C | G | Missense_Mutation | p.I244M | 5 |
| DRG1 | BRCA | chr22 | 31819322 | 31819322 | G | C | Missense_Mutation | p.K213N | 3 |
| DRG1 | UCS | chr22 | 31829935 | 31829935 | T | C | Missense_Mutation | p.V361A | 3 |
| DRG1 | SKCM | chr22 | 31807018 | 31807018 | C | T | Silent | p.I121I | 3 |
| DRG1 | UVM | chr22 | 31816310 | 31816310 | A | G | Missense_Mutation | p.I161V | 3 |
| DRG1 | BLCA | chr22 | 31796663 | 31796663 | C | T | Missense_Mutation | p.R34C | 2 |
| DRG1 | STAD | chr22 | 31822649 | 31822649 | C | T | Silent | 2 | |
| DRG1 | UCEC | chr22 | 31799045 | 31799045 | G | A | Missense_Mutation | p.R66Q | 2 |
| DRG1 | UCEC | chr22 | 31807065 | 31807065 | C | T | Missense_Mutation | p.A137V | 2 |
| DRG1 | STAD | chr22 | 31822649 | 31822649 | C | T | Silent | p.S254S | 2 |
| DRG1 | UCEC | chr22 | 31816248 | 31816248 | G | A | Missense_Mutation | p.R140Q | 2 |
| DRG1 | UCEC | chr22 | 31816303 | 31816303 | G | T | Missense_Mutation | p.K158N | 2 |
| DRG1 | STAD | chr22 | 31823111 | 31823111 | C | T | Missense_Mutation | p.T316I | 2 |
| DRG1 | UCEC | chr22 | 31816306 | 31816306 | G | A | Silent | p.K159 | 2 |
| DRG1 | CESC | chr22 | 31823084 | 31823084 | C | T | Missense_Mutation | 2 | |
| DRG1 | STAD | chr22 | 31822637 | 31822637 | T | C | Silent | p.I250I | 2 |
| DRG1 | UCEC | chr22 | 31819288 | 31819288 | C | T | Missense_Mutation | p.A202V | 2 |
| DRG1 | UCEC | chr22 | 31819384 | 31819384 | T | C | Missense_Mutation | p.V234A | 2 |
| DRG1 | CESC | chr22 | 31823084 | 31823084 | C | T | Missense_Mutation | p.S307F | 2 |
| DRG1 | LIHC | chr22 | 31799026 | 31799026 | G | T | Missense_Mutation | p.A60S | 2 |
| DRG1 | LIHC | chr22 | 31816314 | 31816314 | A | - | Frame_Shift_Del | p.E162fs | 2 |
| DRG1 | SKCM | chr22 | 31829903 | 31829903 | G | A | Silent | p.V350V | 2 |
| DRG1 | BLCA | chr22 | 31816285 | 31816285 | G | A | Silent | p.L152L | 2 |
| DRG1 | UVM | chr22 | 31816310 | 31816310 | A | G | Missense_Mutation | 2 | |
| DRG1 | KIRP | chr22 | 31799189 | 31799189 | A | G | Splice_Site | p.Q114_splice | 2 |
| DRG1 | BLCA | chr22 | 31822752 | 31822752 | C | G | Missense_Mutation | p.L289V | 2 |
| DRG1 | LIHC | chr22 | 31822755 | 31822755 | A | - | Frame_Shift_Del | p.K290fs | 2 |
| DRG1 | KIRP | chr22 | 31799189 | 31799189 | A | G | Missense_Mutation | p.Q114R | 1 |
| DRG1 | UCEC | chr22 | 31819397 | 31819397 | G | A | Splice_Site | p.R238_splice | 1 |
| DRG1 | LIHC | chr22 | 31816331 | 31816331 | T | - | Frame_Shift_Del | p.F168fs | 1 |
| DRG1 | COAD | chr22 | 31816296 | 31816296 | G | A | Missense_Mutation | p.G156E | 1 |
| DRG1 | KIRP | chr22 | 31829876 | 31829876 | C | A | Silent | 1 | |
| DRG1 | BLCA | chr22 | 31799166 | 31799166 | C | G | Missense_Mutation | p.I106M | 1 |
| DRG1 | LUAD | chr22 | 31823154 | 31823154 | C | T | Silent | p.I330I | 1 |
| DRG1 | COAD | chr22 | 31822711 | 31822711 | G | A | Missense_Mutation | p.R275H | 1 |
| DRG1 | LGG | chr22 | 31796608 | 31796608 | G | T | Missense_Mutation | p.M15I | 1 |
| DRG1 | LUSC | chr22 | 31829895 | 31829895 | C | G | Missense_Mutation | p.Q348E | 1 |
| DRG1 | ESCA | chr22 | 31795658 | 31795658 | G | T | RNA | NULL | 1 |
| DRG1 | STAD | chr22 | 31829850 | 31829859 | CCATGCAGTG | - | Frame_Shift_Del | p.335_335del | 1 |
| DRG1 | LGG | chr22 | 31796681 | 31796681 | C | T | Nonsense_Mutation | p.R40* | 1 |
| DRG1 | PAAD | chr22 | 31819348 | 31819348 | G | A | Missense_Mutation | p.R222H | 1 |
| DRG1 | ESCA | chr22 | 31799191 | 31799191 | G | A | Splice_Site | e3+1 | 1 |
| DRG1 | BLCA | chr22 | 31816285 | 31816285 | G | A | Silent | 1 | |
| DRG1 | LIHC | chr22 | 31799026 | 31799026 | G | T | Missense_Mutation | 1 | |
| DRG1 | PRAD | chr22 | 31829930 | 31829930 | G | T | Missense_Mutation | p.E359D | 1 |
| DRG1 | ESCA | chr22 | 31799191 | 31799191 | G | A | Splice_Site | 1 | |
| DRG1 | BLCA | chr22 | 31822752 | 31822752 | C | G | Missense_Mutation | 1 | |
| DRG1 | LIHC | chr22 | 31822736 | 31822736 | A | G | Silent | 1 | |
| DRG1 | CESC | chr22 | 31816296 | 31816296 | G | T | Missense_Mutation | 1 | |
| DRG1 | READ | chr22 | 31799071 | 31799071 | G | A | Missense_Mutation | p.V75M | 1 |
| DRG1 | ESCA | chr22 | 31799191 | 31799191 | G | A | Splice_Site | . | 1 |
| DRG1 | STAD | chr22 | 31829850 | 31829859 | CCATGCAGTG | - | Splice_Site | p.L336_splice | 1 |
| DRG1 | BLCA | chr22 | 31796663 | 31796663 | C | T | Missense_Mutation | 1 | |
| DRG1 | LIHC | chr22 | 31796695 | 31796695 | T | C | Silent | p.T44T | 1 |
| DRG1 | SARC | chr22 | 31816267 | 31816267 | G | T | Missense_Mutation | 1 | |
| DRG1 | HNSC | chr22 | 31829860 | 31829860 | C | A | Missense_Mutation | 1 | |
| DRG1 | THYM | chr22 | 31816350 | 31816350 | G | A | Missense_Mutation | p.S174N | 1 |
| DRG1 | BLCA | chr22 | 31799166 | 31799166 | C | G | Missense_Mutation | 1 | |
| DRG1 | UCS | chr22 | 31829935 | 31829935 | T | C | Missense_Mutation | 1 | |
| DRG1 | CESC | chr22 | 31819365 | 31819365 | G | A | Missense_Mutation | p.D228N | 1 |
| DRG1 | SARC | chr22 | 31799118 | 31799118 | G | T | Missense_Mutation | 1 | |
| DRG1 | HNSC | chr22 | 31829860 | 31829860 | C | A | Missense_Mutation | p.A336D | 1 |
| DRG1 | THYM | chr22 | 31823063 | 31823063 | G | T | Missense_Mutation | p.G300V | 1 |
| DRG1 | BLCA | chr22 | 31822619 | 31822619 | C | G | Missense_Mutation | 1 | |
| DRG1 | CESC | chr22 | 31819365 | 31819365 | G | A | Missense_Mutation | 1 | |
| DRG1 | KIRP | chr22 | 31816283 | 31816283 | C | T | Silent | p.L152L | 1 |
| DRG1 | THYM | chr22 | 31823119 | 31823119 | G | T | Nonsense_Mutation | p.E319X | 1 |
| DRG1 | LIHC | chr22 | 31816245 | 31816245 | C | - | Frame_Shift_Del | p.A139fs | 1 |
| DRG1 | COAD | chr22 | 31799027 | 31799027 | C | T | Missense_Mutation | p.A60V | 1 |
| DRG1 | UCEC | chr22 | 31816283 | 31816283 | C | A | Missense_Mutation | p.L152M | 1 |
| DRG1 | COAD | chr22 | 31799098 | 31799098 | C | A | Missense_Mutation | p.L84M | 1 |
| DRG1 | STAD | chr22 | 31829850 | 31829859 | CCATGCAGTG | - | Splice_Site | 1 |
| Copy number variation (CNV) of DRG1 * Click on the image to open the original image in a new window. |
 |
| Fusion gene breakpoints (product of the structural variants (SVs)) across DRG1 * Click on the image to open the UCSC genome browser with custom track showing this image in a new window. |
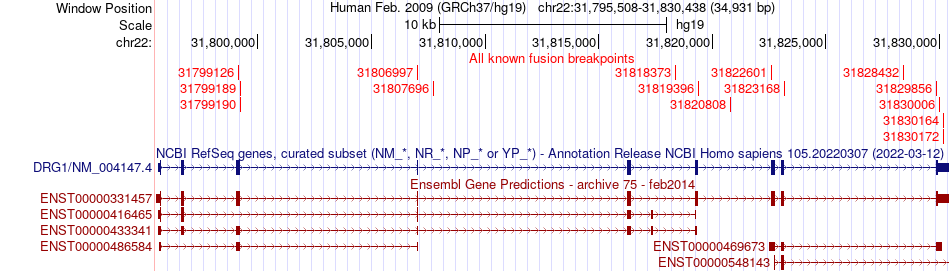 |
| Fusion genes with this translation factor from FusionGDB2.0. |
| FusionGDB2 ID | Disease | Sample | Hgene | Hchr | Hbp | Hstrand | Tgene | Tchr | Tbp | Tstrand |
| 91909 | N/A | BM151065 | ANKRD28 | chr3 | 15891687 | - | DRG1 | chr22 | 31830172 | - |
| 91909 | BRCA | TCGA-D8-A140-01A | DEPDC5 | chr22 | 32215211 | + | DRG1 | chr22 | 31924676 | + |
| 100181 | N/A | BM150997 | DRG1 | chr22 | 31829856 | - | DEPDC5 | chr22 | 32272251 | - |
| 102721 | ESCA | TCGA-LN-A5U7 | DRG1 | chr22 | 31819396 | + | LIMK2 | chr22 | 31667122 | + |
| 102721 | LGG | TCGA-CS-6666 | DRG1 | chr22 | 31904362 | + | LIMK2 | chr22 | 31654277 | + |
| 103282 | GBM | TCGA-19-2625-01A | DRG1 | chr22 | 31823168 | + | MYH9 | chr22 | 36723533 | - |
| 103175 | LUSC | TCGA-33-4532 | DRG1 | chr22 | 31799190 | + | MYO18B | chr22 | 26317223 | + |
| 103175 | LUSC | TCGA-33-4532-01A | DRG1 | chr22 | 31799189 | + | MYO18B | chr22 | 26317223 | + |
| 103175 | LUSC | TCGA-33-4532-01A | DRG1 | chr22 | 31799190 | + | MYO18B | chr22 | 26317224 | + |
| 50148 | N/A | DB064896 | DRG1 | chr22 | 31799126 | + | SZRD1 | chr1 | 16719832 | + |
| 91909 | N/A | BQ372668 | INTS4 | chr11 | 77629341 | + | DRG1 | chr22 | 31807696 | - |
| 91909 | N/A | DN912858 | MLLT3 | chr9 | 20502104 | + | DRG1 | chr22 | 31820808 | - |
| 91909 | N/A | BG032465 | NDUFB7 | chr19 | 14676890 | - | DRG1 | chr22 | 31828432 | - |
| 91909 | OV | TCGA-24-1845 | RELB | chr19 | 45515534 | + | DRG1 | chr22 | 31806997 | + |
| 91909 | LUAD | TCGA-97-A4M3-01A | RMDN2 | chr2 | 38156872 | + | DRG1 | chr22 | 31822601 | + |
| 91909 | N/A | DL058742 | TCOF1 | chr5 | 149778004 | + | DRG1 | chr22 | 31439595 | + |
| 91912 | N/A | BF813460 | TMEM214 | chr2 | 27262627 | - | DRG1 | chr22 | 31830006 | + |
Top |
|
| Kaplan-Meier plots with logrank tests of overall survival (OS) |
 |
| Cancer type | Translation factor | Coefficent | Hazard ratio | Wald test pval | Likelihool ratio pval | Logrank test pval | # samples |
Top |
|
| Differential gene expression between female and male. (Wilcoxon test, pval<0.05) |
 |
| Cancer type | Translation factor | pval | adj.p |
| KIRC | DRG1 | 0.000987088321232784 | 0.028 |
| TGCT | DRG1 | 0.0101500189048071 | 0.27 |
| STAD | DRG1 | 0.0368268320128155 | 0.96 |
Top |
|
| Differential gene expression between young and old age groups (Wilcoxon test, pval<0.05) |
 |
| Cancer type | Translation factor | pval | adj.p |
| ESCA | DRG1 | 0.00200487722028485 | 0.066 |
| THYM | DRG1 | 0.0167365594950762 | 0.52 |
| SARC | DRG1 | 0.00650725149881043 | 0.21 |
Top |
|
| Drugs targeting genes involved in this translation factor. (DrugBank Version 5.1.8 2021-05-08) |
| UniProtAcc | DrugBank ID | Drug name | Drug activity | Drug type | Drug status |
Top |
|
| Diseases associated with this translation factor. (DisGeNet 4.0) |
| Disease ID | Disease Name | # PubMeds | Disease source |
(UTHealth)
Web File Viewing | Emergency Information |Campus Carry|Site Policies