
|
||||||
|

Translation Factor: RPL10A (NCBI Gene ID:4736) |
|
 Gene Summary Gene Summary |
| Gene Information | Gene Name: RPL10A | Gene ID: 4736 | Gene Symbol | RPL10A | Gene ID | 4736 |
| Gene Name | ribosomal protein L10a | |
| Synonyms | CSA19|Csa-19|L10A|NEDD6 | |
| Cytomap | 6p21.31 | |
| Type of Gene | protein-coding | |
| Description | 60S ribosomal protein L10aNEDD-6large ribosomal subunit protein uL1neural precursor cell expressed developmentally down-regulated protein 6 | |
| Modification date | 20200320 | |
| UniProtAcc | P62906 | |
| Child GO biological process term(s) under GO:0006412 |
| GO ID | GO term |
| GO:0005840 | Ribosome |
| GO:0002181 | Cytoplasmic translation |
| GO:0006412 | Translation |
| Gene ontology of translaction factor with evidence of Inferred from Direct Assay (IDA) from Entrez |
| Partner | Gene | GO ID | GO term | PubMed ID |
| Hgene | RPL10A | GO:0002181 | cytoplasmic translation | 25957688 |
| Inferred gene age of translation factor. |
| Gene | Inferred gene age group among (0 - 67.6], (67.6 - 355.7], (355.7 - 733], (733 - 1119.25], >1119.25 |
| RPL10A | >1119.25 |
Top |
|
| We searched PubMed using 'RPL10A[title] AND translation [title] AND human.' |
| Gene | Title | PMID |
| RPL10A | . | . |
Top |
|
| Skipped exons in TCGA and GTEx based on Ensembl gene isoform structure. * Click on the image to open the UCSC genome browser with custom track showing this image in a new window. For more annotations, please visit our ExonSkipDB. |
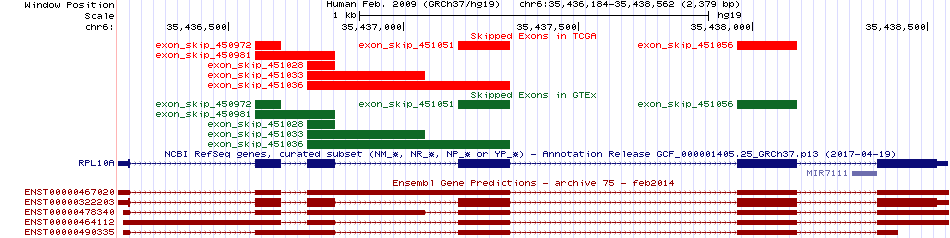 |
| Open reading frame (ORF) analsis of exon skipping events based on Ensembl gene isoform structure. * Click on the break point to see the gene structure around the break point region using the UCSC Genome Browser. |
| ENST | Exon skip start (DNA) | Exon Skip end (DNA) | ORF |
| ENST00000322203 | 35436723 | 35436804 | In-frame |
| ENST00000322203 | 35437157 | 35437306 | Frame-shift |
| ENST00000322203 | 35437955 | 35438128 | Frame-shift |
| Exon skipping position in the amino acid sequence. |
| ENST | Exon skip start (DNA) | Exon Skip end (DNA) | Len(transcript seq) | Exon skip start (mRNA) | Exon Skip end (mRNA) | Len(amino acid seq) | Exon skip start (AA) | Exon Skip end (AA) |
| ENST00000322203 | 35436723 | 35436804 | 733 | 108 | 188 | 217 | 27 | 53 |
| Potentially (partially) lost protein functional features of UniProt. |
| UniProtAcc | Exon skip start (AA) | Exon Skip end (AA) | Function feature start (AA) | Function feature end (AA) | Functional feature type | Functional feature desc. |
| P62906 | 27 | 53 | 2 | 217 | Chain | ID=PRO_0000125818;Note=60S ribosomal protein L10a |
Top |
|
| Gene expression level across TCGA pancancer |
 |
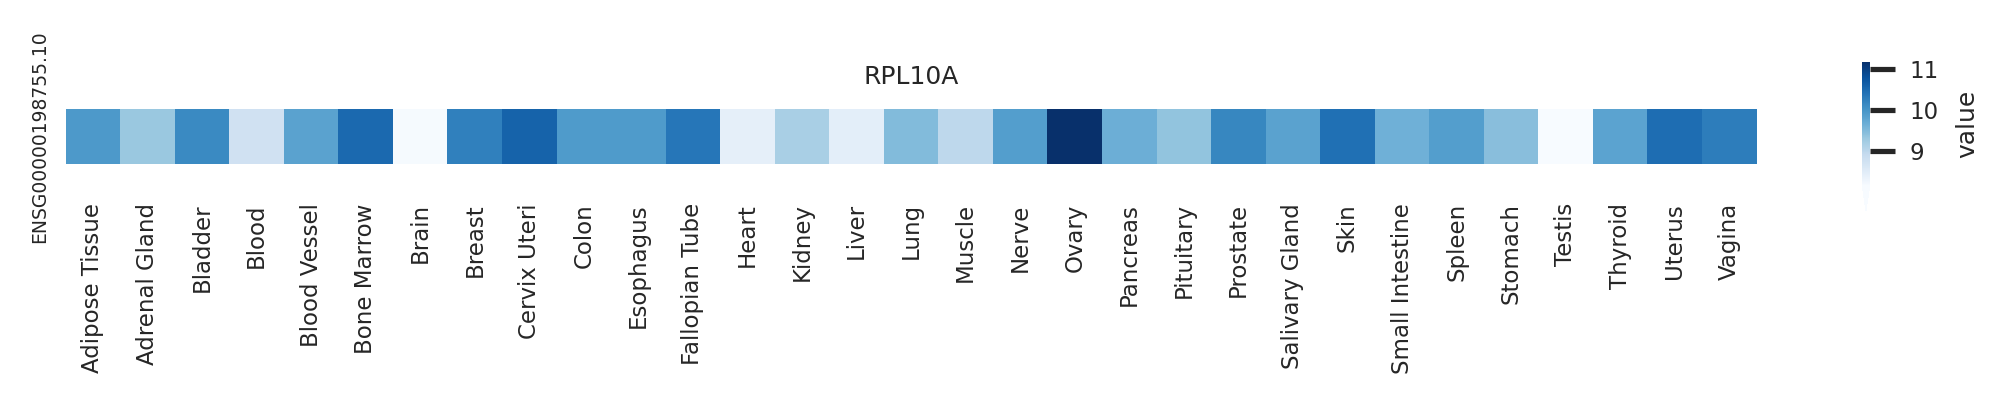
| Gene expression level across GTEx pantissue |
 |
| Expression level of gene isoforms across TCGA pancancer |
 |
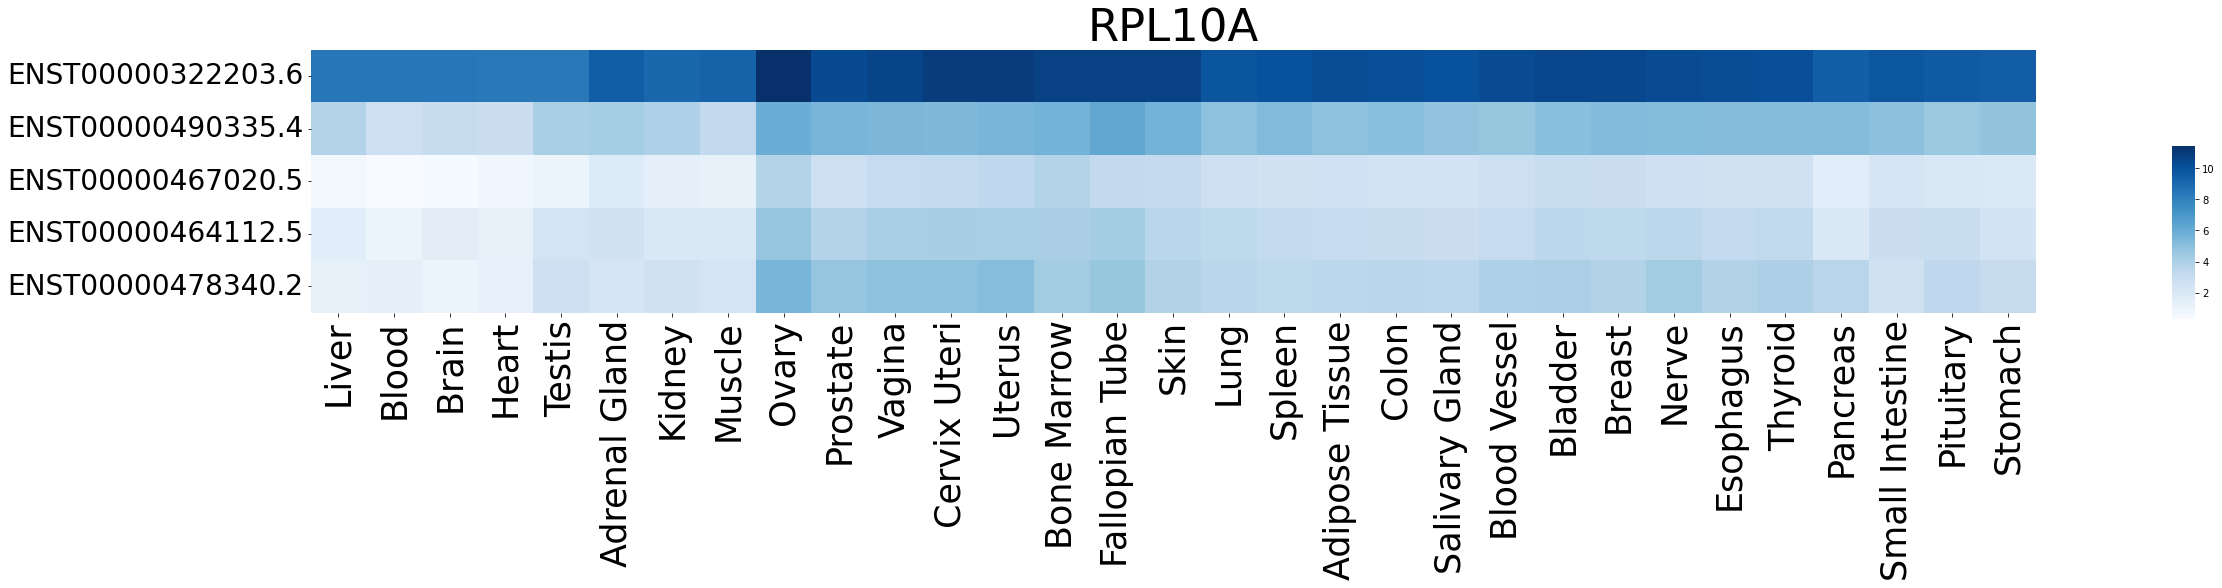
| Expression level of gene isoforms across GTEx pantissue |
 |
| Cancer(tissue) type-specific expression level of Translation factor using z-score distriution |
 |
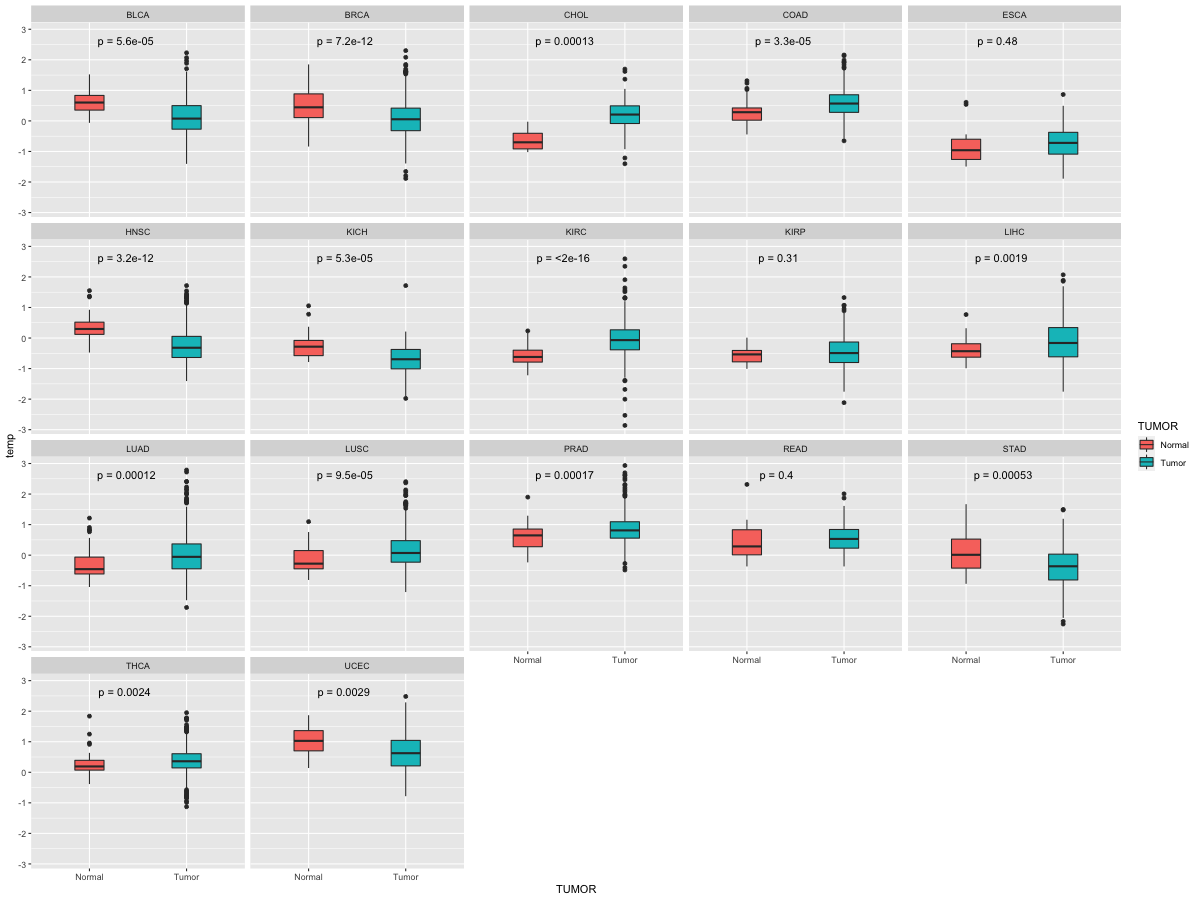
| Differential expression between tumor and matched normal (in the cancer types with more than 10 matched samples) |
 |
| Cancer type | Translation factor | FC | adj.pval |
| BLCA | RPL10A | -6.44657805140652 | 0.000164031982421875 |
| KICH | RPL10A | 1.57107790372051 | 0.0124664902687073 |
| KIRC | RPL10A | -2.3455028090226 | 5.61779186490163e-09 |
Top |
|
| Translation factor expression regulation through miRNA binding |
| Cancer type | Gene | miRNA | TargetScan binding score (Context++ score percentile) | Coefficient | Pvalue |
| Translation factor expression regulation through methylation in the promoter of Translation factor |
 |
| Cancer type | Gene | methyl group b | methyl group a | DEG pval | avg methyl in b | avg methyl in a | avg exp in b | avg exp in a |
| Translation factor expression regulation through methylation in the gene body of Translation factor (positive regulation) |
 |
| Cancer type | Gene | methyl group b | methyl group a | DEG pval | avg methyl in b | avg methyl in a | avg exp in b | avg exp in a |
| Translation factor expression regulation through copy number variation of Translation factor |
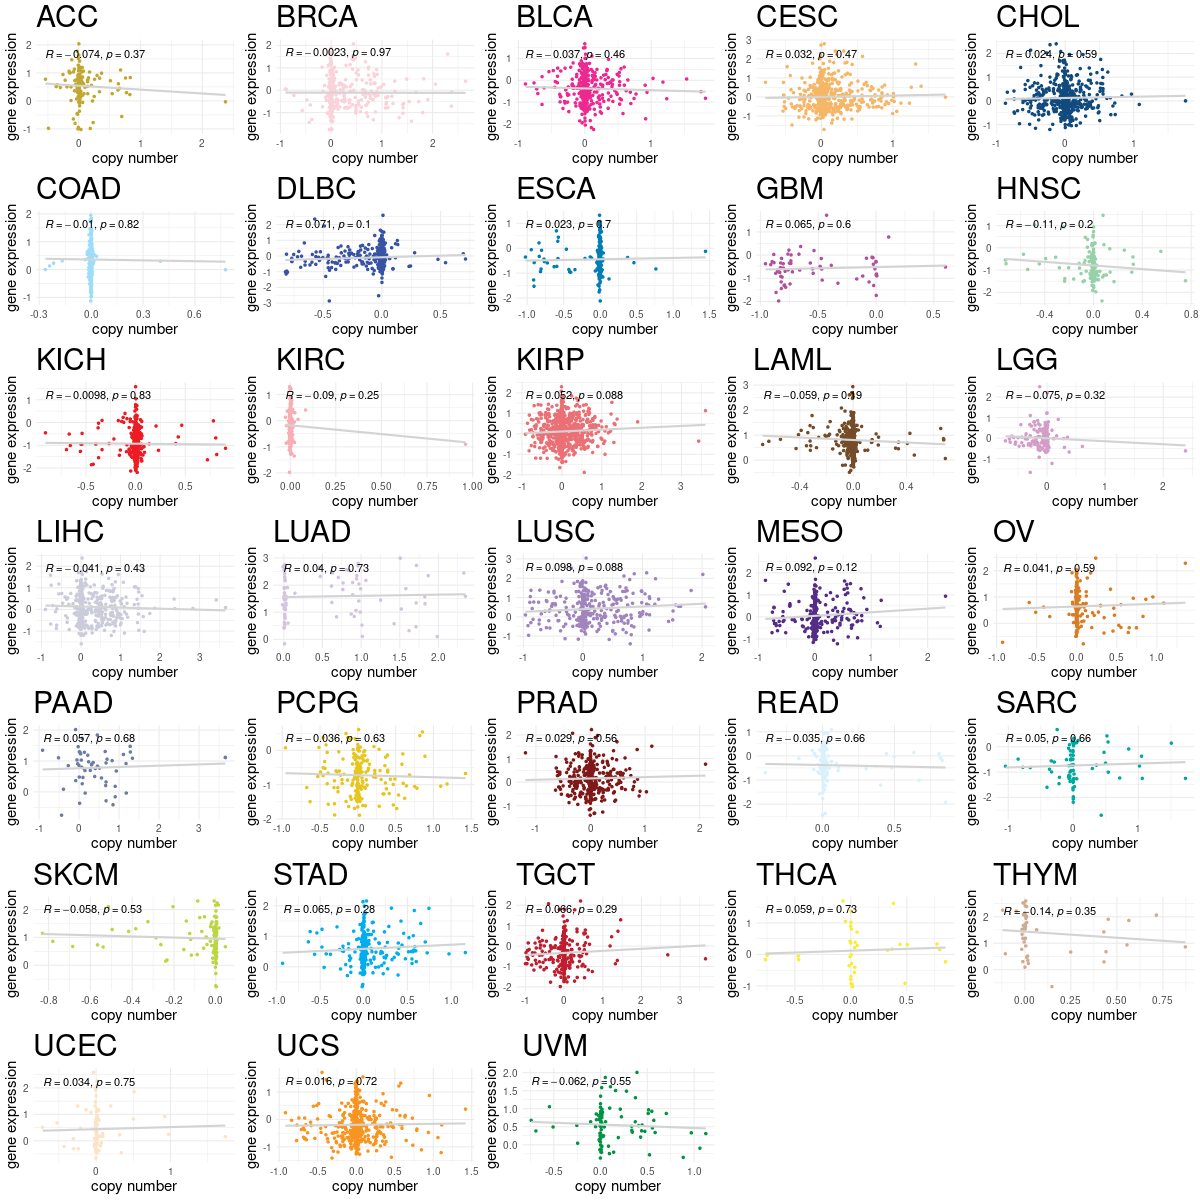 |
| Cancer type | Gene | Coefficient | Pvalue |
Top |
|
| Strongly correlated genes belong to cellular important gene groups with RPL10A (coefficient>0.8, pval<0.05, node color based on FC between tumor and matched normal). Significantly associated important genes in the individual cancer types. * Cell metabolism gene: cell metabolism genes from REACTOME (black edge), IUPHAR: drug target genes from IUPHAR (blue edge), Kinase: human kinase genes (brown edge), CGC: cancer gene census genes (orange edge), TSG: tumor suppresor genes (purple edge), Epifactor: epigenetic factors (light blue edge), TF: transcription factors (green) |
 |
| Cancer type | Gene group | Translation factor | Correlated gene | Coefficient | Pvalue |
| CHOL | Cell metabolism gene | RPL10A | IMPDH2 | 0.834689214 | 1.04E-12 |
| CHOL | CGC | RPL10A | NACA | 0.838537516 | 6.53E-13 |
| CHOL | IUPHAR | RPL10A | IMPDH2 | 0.834689214 | 1.04E-12 |
| CHOL | TSG | RPL10A | GAS5 | 0.818672007 | 6.41E-12 |
| DLBC | Cell metabolism gene | RPL10A | TOMM22 | 0.800386848 | 8.66E-12 |
| DLBC | Cell metabolism gene | RPL10A | NME2 | 0.82072088 | 9.26E-13 |
| DLBC | Cell metabolism gene | RPL10A | GEMIN7 | 0.824787847 | 5.72E-13 |
| DLBC | Cell metabolism gene | RPL10A | SNRPD2 | 0.827297526 | 4.23E-13 |
| DLBC | CGC | RPL10A | NACA | 0.83627594 | 1.37E-13 |
| DLBC | Epifactor | RPL10A | FBL | 0.84342394 | 5.33E-14 |
| DLBC | TF | RPL10A | ZNF581 | 0.800946793 | 8.17E-12 |
| DLBC | TF | RPL10A | NME2 | 0.82072088 | 9.26E-13 |
| DLBC | TSG | RPL10A | GLTSCR2 | 0.821070679 | 8.89E-13 |
| DLBC | TSG | RPL10A | GNB2L1 | 0.922102806 | 1.36E-20 |
| GBM | Cell metabolism gene | RPL10A | CCT4 | 0.808371029 | 5.70E-41 |
| GBM | Cell metabolism gene | RPL10A | PFDN5 | 0.810704845 | 2.24E-41 |
| GBM | Cell metabolism gene | RPL10A | SSR2 | 0.818889509 | 7.59E-43 |
| GBM | TSG | RPL10A | GAS5 | 0.81248321 | 1.09E-41 |
| LAML | TSG | RPL10A | GAS5 | 0.801774284 | 4.46E-40 |
| LAML | TSG | RPL10A | GNB2L1 | 0.834722587 | 3.59E-46 |
| MESO | TSG | RPL10A | GNB2L1 | 0.841440627 | 1.93E-24 |
| PRAD | Epifactor | RPL10A | FBL | 0.813081372 | 7.26E-131 |
| PRAD | TSG | RPL10A | GNB2L1 | 0.828212588 | 6.26E-140 |
| THYM | Epifactor | RPL10A | FBL | 0.80283618 | 1.00E-28 |
| UCS | Epifactor | RPL10A | FBL | 0.80283618 | 1.00E-28 |
| UVM | Cell metabolism gene | RPL10A | LTA4H | 0.844537896 | 7.39E-23 |
| UVM | IUPHAR | RPL10A | LTA4H | 0.844537896 | 7.39E-23 |
| UVM | TSG | RPL10A | ST13 | 0.84732548 | 3.86E-23 |
Top |
|
| Protein 3D structure Visit iCn3D. |
Top |
|
| Protein-protein interaction networks * Overlap between up-regulated DEGs (log2FC<-1 and adj.P<0.05) and STRING PPI network (center: Translation factor, node: DEGs, edges: weighted by -log2(adj.P)) |
 |
| Overlap between down-regulated DEGs (log2FC>1 and adj.P<0.05) and STRING PPI network (center: Translation factor, node: DEGs, edges: weighted by -log2(adj.P)) |
 |
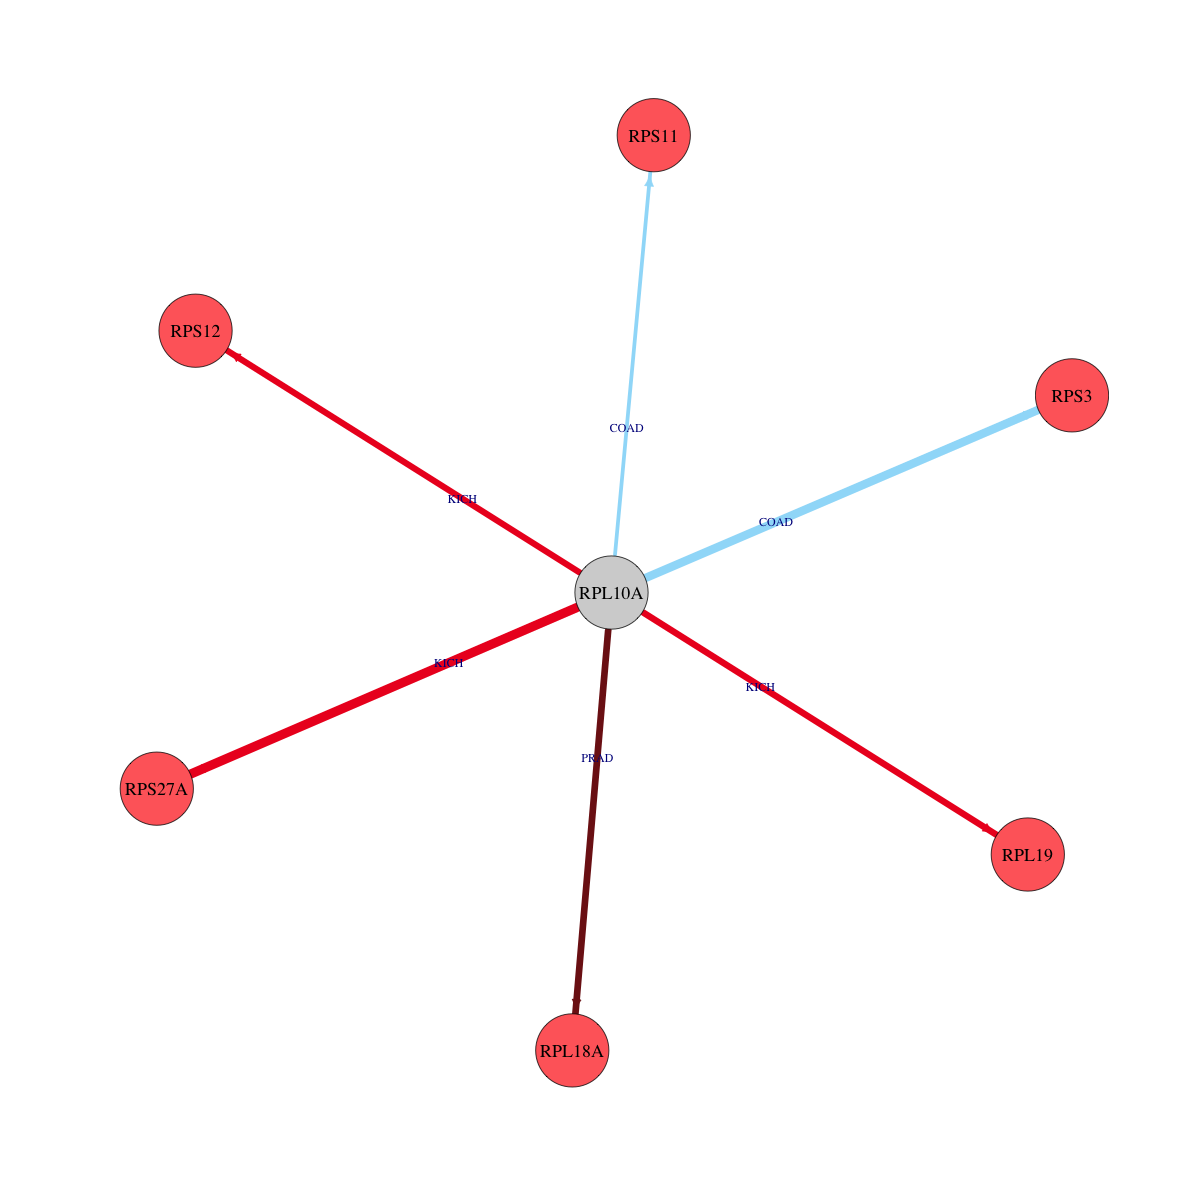
 * Edge colors based on TCGA cancer types. |
| * Overlap between DEGs (log2FC>1 and adj.P<0.05) and STRING PPI network per cancer (center: Translation factor, node: DEGs, node color: log2FC, edges: weighted by -log2(adj.P)) |
 |
| Cancer type | Translation factor | Interacting protein coding gene | FC | adj.pval |
| KIRP | RPL10A | RPL18A | -1.51651392808885 | 0.00016188295558095 |
| KICH | RPL10A | RPS27A | 1.75396693785956 | 0.000187873840332031 |
| KIRP | RPL10A | RPS16 | -1.35957043617517 | 0.00019507110118866 |
| COAD | RPL10A | RPS3 | 1.48730375143014 | 0.000411599874496461 |
| KIRP | RPL10A | RPS11 | -1.01861570565103 | 0.00105937570333481 |
| LIHC | RPL10A | RPL8 | -4.84588284974558 | 0.00110314154326131 |
| PRAD | RPL10A | RPL18A | 1.40600175748499 | 0.00205137828390396 |
| KICH | RPL10A | RPL19 | 1.36901182894089 | 0.00250792503356934 |
| KICH | RPL10A | RPS12 | 1.26997381758431 | 0.00308787822723389 |
| LUAD | RPL10A | RPL19 | -1.31398026615725 | 0.00993159558412698 |
| THCA | RPL10A | RPS16 | -6.16322798156577 | 0.0115764821363307 |
| BLCA | RPL10A | RPS12 | -1.47804673440421 | 0.0204124450683594 |
| BLCA | RPL10A | RPS27A | -1.04747470069188 | 0.0258216857910156 |
| HNSC | RPL10A | RPS3 | -4.73505819095135 | 0.0273726439852453 |
| COAD | RPL10A | RPS11 | 1.35307548998204 | 0.0312207043170929 |
| LUSC | RPL10A | RPL19 | -2.14669889516666 | 0.044366810398747 |
| KIRC | RPL10A | RPL19 | -2.73485271276676 | 1.33980982873695e-10 |
| BRCA | RPL10A | RPS12 | -4.91239327478244 | 1.85340619742495e-09 |
| KIRP | RPL10A | RPL37 | -1.17421621947139 | 2.26888805627823e-05 |
| KIRC | RPL10A | RPL35 | -1.06475238059392 | 2.72286325678163e-08 |
| KIRC | RPL10A | RPL8 | -1.18252459971773 | 5.64962994208288e-07 |
| KIRP | RPL10A | RPL8 | -1.53003692350119 | 6.0301274061203e-05 |
| KIRC | RPL10A | RPS16 | -1.66149869889384 | 7.8509870430991e-09 |
| BRCA | RPL10A | RPS27A | -4.28512148200424 | 7.8788217967112e-14 |
| KIRC | RPL10A | RPL37 | -2.87198822058464 | 8.03913394748564e-12 |
| KIRP | RPL10A | RPL35 | -1.52981101975496 | 9.0546440333128e-05 |
| KIRC | RPL10A | RPS3 | -1.29560847926387 | 9.05905681935088e-10 |
| KIRC | RPL10A | RPL18A | -4.43079304960843 | 9.2516163152192e-11 |
| Protein-protein interactors with this translation factor (BIOGRID-3.4.160) |
| PPI interactors with RPL10A |
| RRP1B, Rrp1b, CDK5RAP3, DCC, HDAC5, NOP56, VHL, SIRT7, CUL3, CUL4A, CUL5, CDK2, CUL1, COPS5, CAND1, RPL21, RPL6, RPL7A, RPS3A, RPS3, RPS9, RPL4, RPL7, RPLP0, RPL11, RPL12, RPL13, RPL14, RPL15, RPL17, RPL18A, RPL18, RPL19, RPL23, RPL24, RPL30, RPL31, RPL37A, RPL3, RPL5, RPL8, RPL9, RPS11, RPS13, RPS15A, RPS16, RPS20, RPS23, RPS24, RPS25, RPS28, RPS2, RPS4X, RPS5, RPS6, RPS8, RPSA, RPL23A, RPS26, RPS12, RPS19, RPL22, RPL32, RPS21, RPS27A, RPL29, EEF1A1, EEF2, SLC25A5, ILF2, NAP1L1, HNRNPM, ILF3, ACTA2, HSP90AB1, RPS27L, RPL10L, RPLP0P6, RAD18, S100A10, SLC25A6, PSMB1, ESR1, FN1, VCAM1, UBL4A, ITGA4, PAN2, SRPR, ACTB, YWHAQ, TARDBP, CEP250, TP53, TUBG1, HUWE1, RGS17, CUL7, OBSL1, CCDC8, RNF2, HIST1H1A, DDX27, HIST2H2BF, RPL26L1, URB1, NOL8, NPM1, GTPBP4, WDR89, RPL36AL, NOP2, FYTTD1, MDM2, GZF1, ZCCHC7, DHX8, ZC3H3, PRR11, ZNF707, ZRSR2, BRIX1, MRTO4, PABPC1, POLR1A, RNPS1, RPL10, RPL13A, RPL27, RPL27A, RPL34, RPL35, RPL35A, RPL36, RPL38, RPLP1, RPLP2, RPS10, RPS14, RPS18, LOC101929876, RPS27, RPS7, SSR3, TUBB4B, NTRK1, PTEN, XPO1, HNRNPU, TFG, CENPQ, CENPU, Eif3a, Eif3e, Srp72, Rrbp1, MCM2, ZNF746, CNBP, SART3, MAGEB10, ZC3HAV1, PRDM5, RBM34, HIST1H1E, GLTSCR2, MECP2, RRS1, KIAA0020, KNOP1, RBM4B, GPATCH4, DGCR8, WDR46, U2AF2, HIST1H1T, RRP8, CYLD, COX15, DLD, HSD17B10, PDHA1, TRIM25, UBE2A, BRCA1, YAP1, MTF1, CFTR, TMPO, PPP1CC, CTNNB1, DIMT1, JUP, TRIP4, PRPF8, EFTUD2, AAR2, PIH1D1, TNIP2, CHD3, RNF4, CHD4, LARP7, TNF, RIOK1, HEXIM1, MEPCE, PPT1, AGR2, RECQL4, DCPS, RNF144A, REST, MYC, CDK9, Prkaa1, Prkab1, RPS6KB2, FBL, HIST1H3A, GRWD1, RC3H1, RC3H2, ACTC1, PHB, RBX1, NR2C2, UCHL3, PPARG, EIF5A, VRK1, VRK3, HIST1H4A, DYRK1A, SNRNP70, PTPN6, ITFG1, ARAF, HMGB1, BIRC3, STAU1, NFX1, WWP2, BRD7, MATR3, Dnajc17, APP, CMTR1, ARIH2, PLEKHA4, TFCP2, FANCD2, HCVgp1, ZC3H18, MAP3K14, NCK1, RRBP1, CASQ2, SCN4A, MAP9, SPEN, PCDH11X, COL23A1, PIK3R6, LOC728637, SNIP1, M, nsp4, nsp6, NEK4, DUX4, CIT, ANLN, AURKB, CHMP4B, CHMP4C, ECT2, KIF14, KIF20A, KIF23, PRC1, GRSF1, MKI67, LDLR, LRRC59, BRD4, Apc2, RBM39, FBP1, IFI16, BKRF1, USP15, DNAJC1, DNAJC25, DNAJC2, DRG1, DNAJC9, SETD8, OGT, DDRGK1, SPOP, PARK2, UFL1, TRIM37, HTRA4, FZR1, WDR5, PAGE4, NAA40, SRSF5, REXO4, ADARB1, HIST1H1B, MYBBP1A, ZNF48, CCDC140, GLYR1, HERC5, C8orf33, MAP7D1, NEIL1, PAK1IP1, RPF1, SRPK2, SRSF6, YTHDC2, RPS4Y1, MAGEB2, DDX10, DDX54, LYAR, ZNF668, PRKRA, ZNF346, DDX51, ZNF800, BUD13, TSPYL1, LIN28A, PPAN-P2RY11, FAM111A, PBRM1, CCDC137, DDX18, GTPBP10, FTSJ3, NCL, NIFK, NOC3L, TAF1C, DDX24, NOC2L, ZNF512, NPM3, NIP7, DDX50, ZNF524, STAU2, DDX31, SREK1, TAF1B, SPATS2L, ZNF574, ZCCHC6, NSA2, ZNF770, SURF6, XRN1, TTF1, RSBN1, ABT1, SPRTN, BTF3, FBXW7, Nudt21, RCHY1, CCNF, N, SIRT6, RB1CC1, KLF4, |
Top |
|
| Clinically associated variants from ClinVar. |
| Gene | Chr | Position | RefSeq | VarSeq | RefSeeq | VarType | Pathogenic | Disease | VarInfo |
| nsSNVs with sample frequency (size of circle) from TCGA 33 cancers. |
 |
| SNVs and Indels |
| Gene | Cancer type | Chromosome | Start | End | RefSeeq | MutSeq | Mutation type | AAchange | # samples |
| RPL10A | BRCA | chr6 | 35436736 | 35436736 | G | A | Silent | p.T31 | 4 |
| RPL10A | HNSC | chr6 | 35436736 | 35436736 | G | T | Silent | p.T31T | 3 |
| RPL10A | ESCA | chr6 | 35438036 | 35438036 | G | A | Missense_Mutation | p.A131T | 3 |
| RPL10A | KIRP | chr6 | 35437266 | 35437267 | - | A | Frame_Shift_Ins | p.L90fs | 3 |
| RPL10A | UCEC | chr6 | 35437209 | 35437209 | G | A | Silent | p.Q71 | 2 |
| RPL10A | PRAD | chr6 | 35438057 | 35438057 | C | T | Missense_Mutation | p.L138F | 2 |
| RPL10A | HNSC | chr6 | 35438521 | 35438521 | A | G | Silent | p.L216L | 2 |
| RPL10A | UCEC | chr6 | 35438049 | 35438049 | C | T | Missense_Mutation | p.P135L | 2 |
| RPL10A | UVM | chr6 | 35437971 | 35437971 | C | T | Missense_Mutation | p.A109V | 2 |
| RPL10A | PRAD | chr6 | 35438405 | 35438405 | G | A | Missense_Mutation | p.E178K | 2 |
| RPL10A | PRAD | chr6 | 35437258 | 35437258 | G | T | Nonsense_Mutation | p.E88* | 2 |
| RPL10A | KIRC | chr6 | 35437244 | 35437247 | CCCA | - | Frame_Shift_Del | p.PH83fs | 2 |
| RPL10A | LIHC | chr6 | 35437992 | 35437992 | T | - | Frame_Shift_Del | p.L116fs | 2 |
| RPL10A | ESCA | chr6 | 35438036 | 35438036 | G | A | Missense_Mutation | 2 | |
| RPL10A | THCA | chr6 | 35436757 | 35436757 | G | T | Missense_Mutation | p.L38F | 2 |
| RPL10A | LUAD | chr6 | 35438059 | 35438059 | C | G | Silent | p.L138L | 2 |
| RPL10A | KIRP | chr6 | 35436591 | 35436591 | C | T | Silent | p.R7R | 2 |
| RPL10A | BLCA | chr6 | 35438423 | 35438423 | C | T | Missense_Mutation | p.H184Y | 2 |
| RPL10A | STAD | chr6 | 35436771 | 35436771 | C | A | Missense_Mutation | 2 | |
| RPL10A | KIRP | chr6 | 35437266 | 35437267 | - | A | Frame_Shift_Ins | p.LK90fs | 1 |
| RPL10A | THYM | chr6 | 35438009 | 35438009 | C | T | Nonsense_Mutation | p.R122X | 1 |
| RPL10A | BLCA | chr6 | 35438491 | 35438491 | C | G | Missense_Mutation | p.I206M | 1 |
| RPL10A | MESO | chr6 | 35436770 | 35436770 | C | T | Missense_Mutation | p.P43S | 1 |
| RPL10A | HNSC | chr6 | 35436775 | 35436775 | G | A | Silent | 1 | |
| RPL10A | STAD | chr6 | 35438059 | 35438060 | CA | - | Frame_Shift_Del | p.138_138del | 1 |
| RPL10A | KIRP | chr6 | 35436772 | 35436772 | C | A | Silent | 1 | |
| RPL10A | THYM | chr6 | 35438464 | 35438464 | C | A | Missense_Mutation | p.N197K | 1 |
| RPL10A | THYM | chr6 | 35438395 | 35438395 | G | T | Missense_Mutation | p.M174I | 1 |
| RPL10A | OV | chr6 | 35436212 | 35436212 | A | G | Missense_Mutation | p.M1V | 1 |
| RPL10A | HNSC | chr6 | 35438014 | 35438014 | C | G | Missense_Mutation | p.I123M | 1 |
| RPL10A | STAD | chr6 | 35437973 | 35437973 | T | - | Frame_Shift_Del | p.A109fs | 1 |
| RPL10A | LIHC | chr6 | 35437288 | 35437288 | A | C | Missense_Mutation | 1 | |
| RPL10A | THYM | chr6 | 35438009 | 35438009 | C | T | Missense_Mutation | 1 | |
| RPL10A | CESC | chr6 | 35436196 | 35436196 | C | G | RNA | NULL | 1 |
| RPL10A | PAAD | chr6 | 35438416 | 35438416 | T | A | Nonsense_Mutation | p.Y181* | 1 |
| RPL10A | STAD | chr6 | 35437275 | 35437277 | CAA | - | In_Frame_Del | p.93_94del | 1 |
| RPL10A | LIHC | chr6 | 35436605 | 35436605 | A | G | Missense_Mutation | 1 | |
| RPL10A | CESC | chr6 | 35436227 | 35436227 | C | T | RNA | NULL | 1 |
| RPL10A | STAD | chr6 | 35436771 | 35436771 | C | A | Missense_Mutation | p.P43H | 1 |
| RPL10A | BLCA | chr6 | 35438389 | 35438389 | G | A | Silent | 1 | |
| RPL10A | LIHC | chr6 | 35436190 | 35436190 | G | T | Missense_Mutation | 1 | |
| RPL10A | CESC | chr6 | 35436280 | 35436280 | C | G | RNA | NULL | 1 |
| RPL10A | PRAD | chr6 | 35437188 | 35437188 | T | A | Silent | p.S64S | 1 |
| RPL10A | HNSC | chr6 | 35436775 | 35436775 | G | A | Silent | p.Q44Q | 1 |
| RPL10A | STAD | chr6 | 35437275 | 35437277 | CAA | - | In_Frame_Del | p.N94del | 1 |
| RPL10A | BLCA | chr6 | 35437166 | 35437166 | C | T | Missense_Mutation | 1 | |
| RPL10A | LIHC | chr6 | 35436589 | 35436589 | C | G | Missense_Mutation | p.R7G | 1 |
| RPL10A | CHOL | chr6 | 35438392 | 35438392 | G | T | Missense_Mutation | p.K173N | 1 |
| RPL10A | KIRC | chr6 | 35437244 | 35437247 | CCCA | - | Frame_Shift_Del | p.83_84del | 1 |
| RPL10A | STAD | chr6 | 35438059 | 35438060 | CA | - | Frame_Shift_Del | p.L138fs | 1 |
| RPL10A | BLCA | chr6 | 35438423 | 35438423 | C | T | Missense_Mutation | 1 | |
| RPL10A | LIHC | chr6 | 35437288 | 35437288 | A | C | Missense_Mutation | p.K98Q | 1 |
| RPL10A | UVM | chr6 | 35437971 | 35437971 | C | T | Missense_Mutation | 1 | |
| RPL10A | THCA | chr6 | 35436757 | 35436757 | G | T | Missense_Mutation | 1 | |
| RPL10A | BLCA | chr6 | 35438491 | 35438491 | C | G | Missense_Mutation | 1 | |
| RPL10A | SARC | chr6 | 35436188 | 35436188 | C | T | RNA | NULL | 1 |
| RPL10A | KIRP | chr6 | 35437954 | 35437954 | A | G | Splice_Site | . | 1 |
| RPL10A | BLCA | chr6 | 35438389 | 35438389 | G | A | Silent | p.V172V | 1 |
| RPL10A | HNSC | chr6 | 35438521 | 35438521 | A | G | Silent | 1 | |
| RPL10A | SKCM | chr6 | 35436650 | 35436650 | A | C | Missense_Mutation | p.K27T | 1 |
| RPL10A | THYM | chr6 | 35437204 | 35437204 | G | A | Missense_Mutation | 1 | |
| RPL10A | BLCA | chr6 | 35437166 | 35437166 | C | T | Missense_Mutation | p.S57F | 1 |
| RPL10A | LUAD | chr6 | 35438399 | 35438399 | G | C | Missense_Mutation | p.D176H | 1 |
| RPL10A | HNSC | chr6 | 35438014 | 35438014 | C | G | Missense_Mutation | 1 | |
| RPL10A | SKCM | chr6 | 35436650 | 35436650 | A | C | Splice_Site | p.K27_splice | 1 |
| RPL10A | THYM | chr6 | 35437204 | 35437204 | G | A | Missense_Mutation | p.D70N | 1 |
| RPL10A | LUAD | chr6 | 35438117 | 35438118 | - | A | Frame_Shift_Ins | p.N158fs | 1 |
| RPL10A | HNSC | chr6 | 35436736 | 35436736 | G | T | Silent | 1 |
| Copy number variation (CNV) of RPL10A * Click on the image to open the original image in a new window. |
 |
| Fusion gene breakpoints (product of the structural variants (SVs)) across RPL10A * Click on the image to open the UCSC genome browser with custom track showing this image in a new window. |
 |
| Fusion genes with this translation factor from FusionGDB2.0. |
| FusionGDB2 ID | Disease | Sample | Hgene | Hchr | Hbp | Hstrand | Tgene | Tchr | Tbp | Tstrand |
| 88140 | N/A | BE673489 | AC091042.1 | chr18 | 65042372 | - | RPL10A | chr6 | 35438557 | - |
| 88140 | N/A | EC545315 | AC091042.1 | chr18 | 65042528 | + | RPL10A | chr6 | 35438430 | + |
| 75760 | N/A | BI859991 | RPL10A | chr6 | 35438557 | + | AC091042.1 | chr18 | 65042372 | + |
| 88732 | N/A | BI857658 | RPL10A | chr6 | 35438557 | + | DIAPH2 | chrX | 96204684 | + |
| 82588 | N/A | DA314410 | RPL10A | chr6 | 35436754 | + | DPP9 | chr19 | 4723759 | - |
| 75760 | OV | TCGA-13-0760-01A | RPL10A | chr6 | 35438128 | + | FANCE | chr6 | 35430566 | + |
| 75760 | N/A | AI201829 | RPL10A | chr6 | 35438102 | - | ITGB5 | chr3 | 124482531 | + |
| 94335 | N/A | BG034060 | RPL10A | chr6 | 35438558 | + | PTPRG | chr3 | 61728136 | - |
| 94335 | N/A | BI497110 | RPL10A | chr6 | 35438556 | + | PTPRG | chr3 | 61728473 | - |
| 94335 | N/A | BI860452 | RPL10A | chr6 | 35438556 | + | PTPRG | chr3 | 61728754 | - |
| 94335 | N/A | BM015176 | RPL10A | chr6 | 35438557 | + | PTPRG | chr3 | 61728122 | - |
| 94335 | N/A | EC563709 | RPL10A | chr6 | 35438557 | + | PTPRG | chr3 | 61728145 | - |
| 88140 | N/A | AA491868 | RPL10A | chr6 | 35438467 | + | RPL10A | chr6 | 35438557 | - |
| 88140 | N/A | AA730358 | RPL10A | chr6 | 35438557 | + | RPL10A | chr6 | 35438467 | - |
| 91953 | HNSC | TCGA-D6-A6ES | RPL10A | chr6 | 35438511 | + | S100A8 | chr1 | 153363022 | - |
| 88141 | Non-Cancer | ERR315358 | SUPT3H | chr6 | 45332938 | - | RPL10A | chr6 | 35436576 | + |
Top |
|
| Kaplan-Meier plots with logrank tests of overall survival (OS) |
 |
| Cancer type | Translation factor | Coefficent | Hazard ratio | Wald test pval | Likelihool ratio pval | Logrank test pval | # samples |
Top |
|
| Differential gene expression between female and male. (Wilcoxon test, pval<0.05) |
 |
| Cancer type | Translation factor | pval | adj.p |
| KIRC | RPL10A | 0.000204241612955541 | 0.0057 |
| BRCA | RPL10A | 0.0271792658521527 | 0.73 |
| MESO | RPL10A | 0.0296446160371935 | 0.77 |
Top |
|
| Differential gene expression between young and old age groups (Wilcoxon test, pval<0.05) |
 |
| Cancer type | Translation factor | pval | adj.p |
| TGCT | RPL10A | 0.0156336147878502 | 0.48 |
| LGG | RPL10A | 0.0148682425551636 | 0.48 |
| BRCA | RPL10A | 0.00254348092904686 | 0.084 |
| PAAD | RPL10A | 0.0427907096346563 | 1 |
Top |
|
| Drugs targeting genes involved in this translation factor. (DrugBank Version 5.1.8 2021-05-08) |
| UniProtAcc | DrugBank ID | Drug name | Drug activity | Drug type | Drug status |
Top |
|
| Diseases associated with this translation factor. (DisGeNet 4.0) |
| Disease ID | Disease Name | # PubMeds | Disease source |
| C0152013 | Adenocarcinoma of lung (disorder) | 1 | CTD_human |
(UTHealth)
Web File Viewing | Emergency Information |Campus Carry|Site Policies