
|
||||||
|

Translation Factor: MRPS18C (NCBI Gene ID:51023) |
|
 Gene Summary Gene Summary |
| Gene Information | Gene Name: MRPS18C | Gene ID: 51023 | Gene Symbol | MRPS18C | Gene ID | 51023 |
| Gene Name | mitochondrial ribosomal protein S18C | |
| Synonyms | CGI-134|MRP-S18-1|MRP-S18-c|MRPS18-1|S18mt-c|mrps18-c | |
| Cytomap | 4q21.23 | |
| Type of Gene | protein-coding | |
| Description | 28S ribosomal protein S18c, mitochondrial28S ribosomal protein S18-1, mitochondrialmitochondrial ribosomal protein S18-1mitochondrial small ribosomal subunit protein bS18cmitochondrial small ribosomal subunit protein bS18mmitochondrial small ribosoma | |
| Modification date | 20200313 | |
| UniProtAcc | Q9Y3D5 | |
| Child GO biological process term(s) under GO:0006412 |
| GO ID | GO term |
| GO:0005840 | Ribosome |
| GO:0006412 | Translation |
| Gene ontology of translaction factor with evidence of Inferred from Direct Assay (IDA) from Entrez |
| Partner | Gene | GO ID | GO term | PubMed ID |
| Inferred gene age of translation factor. |
| Gene | Inferred gene age group among (0 - 67.6], (67.6 - 355.7], (355.7 - 733], (733 - 1119.25], >1119.25 |
| MRPS18C | >1119.25 |
Top |
|
| We searched PubMed using 'MRPS18C[title] AND translation [title] AND human.' |
| Gene | Title | PMID |
| MRPS18C | . | . |
Top |
|
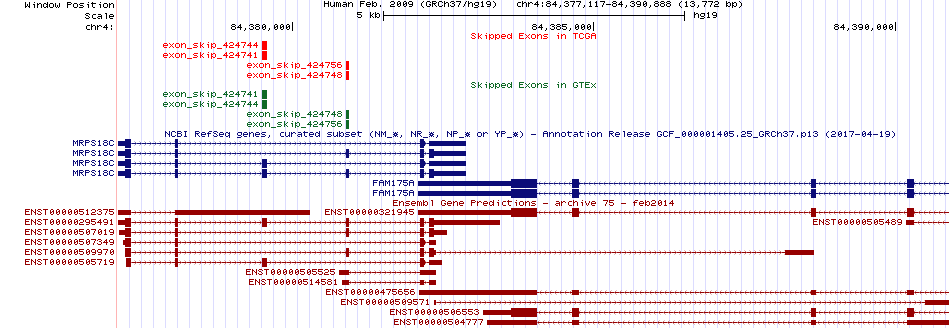
| Skipped exons in TCGA and GTEx based on Ensembl gene isoform structure. * Click on the image to open the UCSC genome browser with custom track showing this image in a new window. For more annotations, please visit our ExonSkipDB. |
 |
| Open reading frame (ORF) analsis of exon skipping events based on Ensembl gene isoform structure. * Click on the break point to see the gene structure around the break point region using the UCSC Genome Browser. |
| ENST | Exon skip start (DNA) | Exon Skip end (DNA) | ORF |
| ENST00000295491 | 84379498 | 84379582 | In-frame |
| ENST00000295491 | 84380892 | 84380950 | Frame-shift |
| Exon skipping position in the amino acid sequence. |
| ENST | Exon skip start (DNA) | Exon Skip end (DNA) | Len(transcript seq) | Exon skip start (mRNA) | Exon Skip end (mRNA) | Len(amino acid seq) | Exon skip start (AA) | Exon Skip end (AA) |
| ENST00000295491 | 84379498 | 84379582 | 1660 | 264 | 347 | 142 | 50 | 78 |
| Potentially (partially) lost protein functional features of UniProt. |
| UniProtAcc | Exon skip start (AA) | Exon Skip end (AA) | Function feature start (AA) | Function feature end (AA) | Functional feature type | Functional feature desc. |
Top |
|
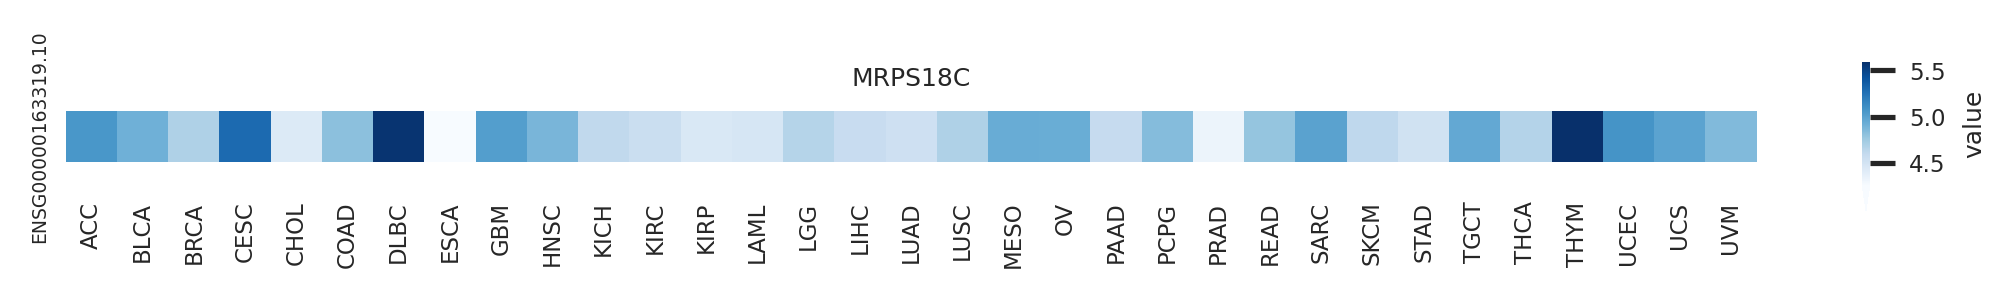
| Gene expression level across TCGA pancancer |
 |
| Gene expression level across GTEx pantissue |
 |
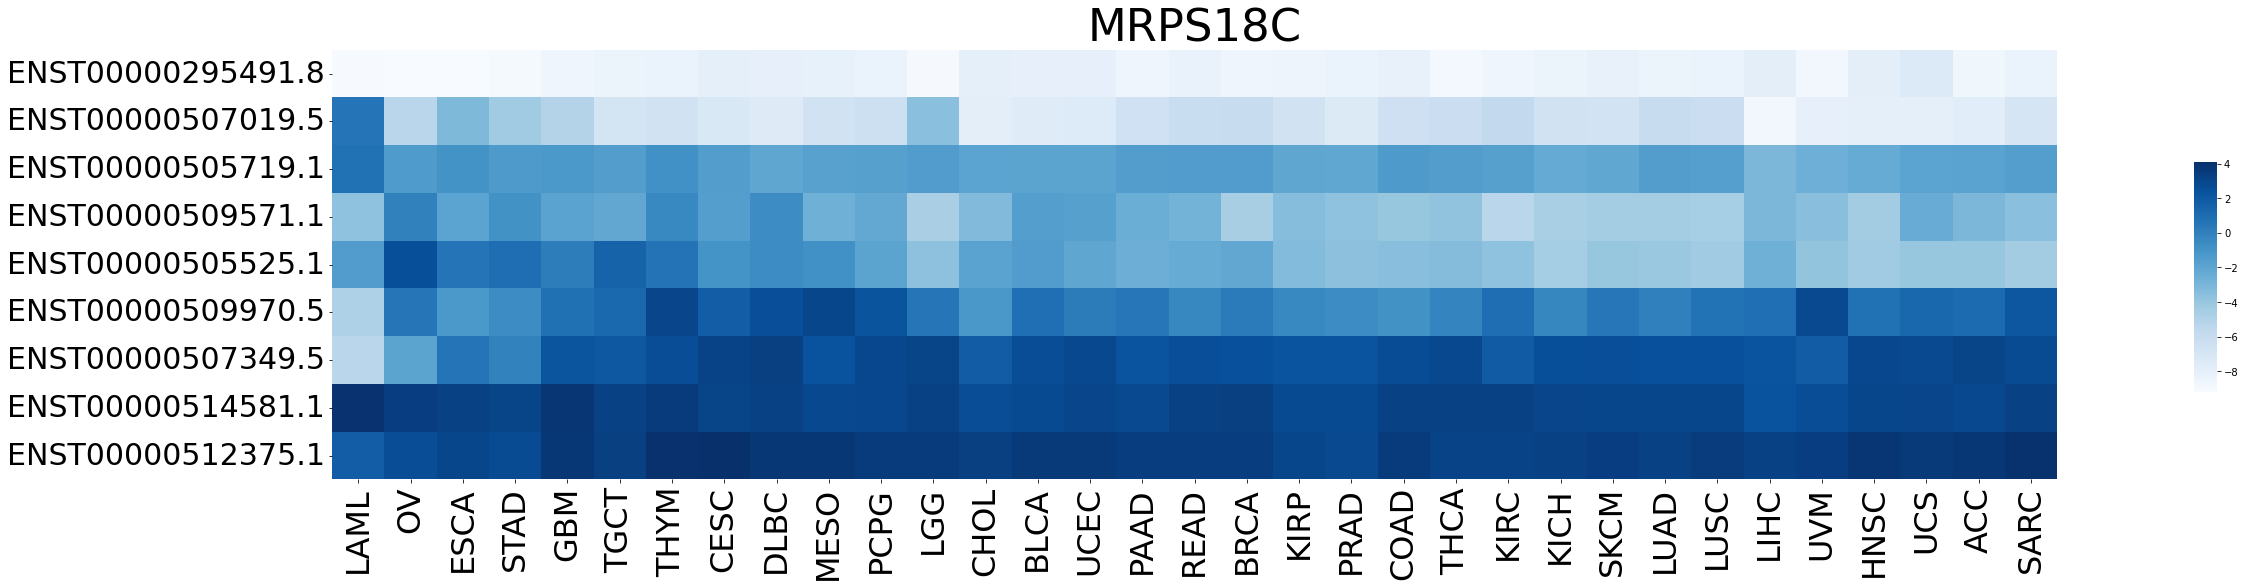
| Expression level of gene isoforms across TCGA pancancer |
 |
| Expression level of gene isoforms across GTEx pantissue |
 |
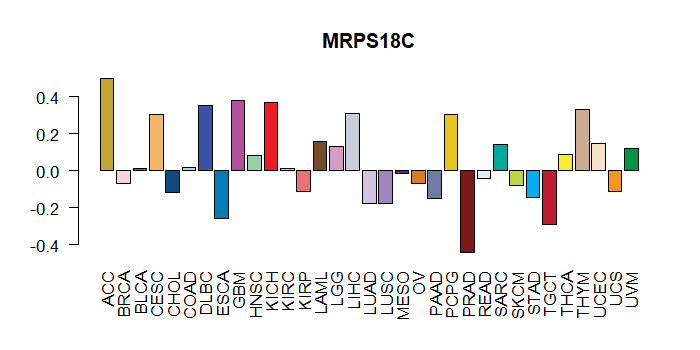
| Cancer(tissue) type-specific expression level of Translation factor using z-score distriution |
 |
| Differential expression between tumor and matched normal (in the cancer types with more than 10 matched samples) |
 |
| Cancer type | Translation factor | FC | adj.pval |
| LIHC | MRPS18C | -1.25336042046698 | 0.00251545393492315 |
| COAD | MRPS18C | -3.48505830240365 | 0.00322914123535157 |
Top |
|
| Translation factor expression regulation through miRNA binding |
| Cancer type | Gene | miRNA | TargetScan binding score (Context++ score percentile) | Coefficient | Pvalue |
| Translation factor expression regulation through methylation in the promoter of Translation factor |
| Cancer type | Gene | methyl group b | methyl group a | DEG pval | avg methyl in b | avg methyl in a | avg exp in b | avg exp in a |
| Translation factor expression regulation through methylation in the gene body of Translation factor (positive regulation) |
| Cancer type | Gene | methyl group b | methyl group a | DEG pval | avg methyl in b | avg methyl in a | avg exp in b | avg exp in a |
| Translation factor expression regulation through copy number variation of Translation factor |
| Cancer type | Gene | Coefficient | Pvalue |
| LUSC | MRPS18C | -0.116626732 | 0.003683591 |
| CHOL | MRPS18C | -0.071065962 | 0.009926326 |
Top |
|
| Strongly correlated genes belong to cellular important gene groups with MRPS18C (coefficient>0.8, pval<0.05, node color based on FC between tumor and matched normal). Significantly associated important genes in the individual cancer types. * Cell metabolism gene: cell metabolism genes from REACTOME (black edge), IUPHAR: drug target genes from IUPHAR (blue edge), Kinase: human kinase genes (brown edge), CGC: cancer gene census genes (orange edge), TSG: tumor suppresor genes (purple edge), Epifactor: epigenetic factors (light blue edge), TF: transcription factors (green) |
 |
| Cancer type | Gene group | Translation factor | Correlated gene | Coefficient | Pvalue |
| DLBC | Cell metabolism gene | MRPS18C | PSMD13 | 0.805641739 | 4.99E-12 |
| DLBC | Cell metabolism gene | MRPS18C | TIMM50 | 0.805674596 | 4.97E-12 |
| DLBC | Cell metabolism gene | MRPS18C | POLR2L | 0.815655023 | 1.66E-12 |
| DLBC | Cell metabolism gene | MRPS18C | SNRPD3 | 0.821939554 | 8.03E-13 |
| DLBC | Cell metabolism gene | MRPS18C | PSMC3 | 0.835662248 | 1.48E-13 |
| DLBC | Cell metabolism gene | MRPS18C | TIMM8B | 0.840907422 | 7.47E-14 |
| DLBC | Cell metabolism gene | MRPS18C | SAMM50 | 0.846955756 | 3.28E-14 |
| DLBC | Cell metabolism gene | MRPS18C | TIMM10 | 0.872835711 | 6.20E-16 |
| GBM | Epifactor | MRPS18C | DPY30 | 0.844234563 | 6.50E-48 |
| THYM | TF | MRPS18C | DNTTIP1 | 0.816330482 | 2.20E-30 |
| UCS | TF | MRPS18C | DNTTIP1 | 0.816330482 | 2.20E-30 |
Top |
|
| Protein 3D structure Visit iCn3D. |
Top |
|
| Protein-protein interaction networks * Overlap between up-regulated DEGs (log2FC<-1 and adj.P<0.05) and STRING PPI network (center: Translation factor, node: DEGs, edges: weighted by -log2(adj.P)) |
 |
| Overlap between down-regulated DEGs (log2FC>1 and adj.P<0.05) and STRING PPI network (center: Translation factor, node: DEGs, edges: weighted by -log2(adj.P)) |
 |
 * Edge colors based on TCGA cancer types. |
| * Overlap between DEGs (log2FC>1 and adj.P<0.05) and STRING PPI network per cancer (center: Translation factor, node: DEGs, node color: log2FC, edges: weighted by -log2(adj.P)) |
 |
| Cancer type | Translation factor | Interacting protein coding gene | FC | adj.pval |
| BRCA | MRPS18C | MRPS15 | -2.19567551682318 | 0.000188684660674703 |
| KICH | MRPS18C | MRPS5 | 1.25108287838437 | 0.000249803066253662 |
| LUAD | MRPS18C | MRPS18A | -1.54123864042049 | 0.000452706327224566 |
| LIHC | MRPS18C | MRPS7 | 1.27029395477208 | 0.00182077236082954 |
| STAD | MRPS18C | MRPS16 | -1.64208084987431 | 0.00239070039242506 |
| KIRC | MRPS18C | MRPS15 | 1.11572283836012 | 0.00361818577801855 |
| HNSC | MRPS18C | MRPS16 | -2.01564621821803 | 0.00518989327406416 |
| KICH | MRPS18C | MRPS2 | 1.26543989555015 | 0.0114533305168152 |
| THCA | MRPS18C | MRPS15 | -1.19960602422995 | 0.0140154883942907 |
| PRAD | MRPS18C | MRPS18A | -1.89251195553289 | 0.0168224419088856 |
| ESCA | MRPS18C | MRPS5 | -2.15440118747854 | 0.0185546875 |
| ESCA | MRPS18C | MRPS2 | -3.20556788084675 | 0.0244140625 |
| THCA | MRPS18C | MRPS11 | -3.10694728540962 | 0.0252226935182201 |
| BLCA | MRPS18C | MRPS11 | -2.30276998968219 | 0.040130615234375 |
| THCA | MRPS18C | MRPS10 | 1.33413691764991 | 1.55171507174296e-05 |
| LUAD | MRPS18C | MRPS5 | -2.20881945885927 | 1.77904381378076e-06 |
| LUSC | MRPS18C | MRPS18A | -4.26181803018125 | 1.79996309233889e-05 |
| LUSC | MRPS18C | MRPS2 | -2.70930846488508 | 1.92864354932136e-09 |
| BRCA | MRPS18C | MRPS11 | -1.24304977976804 | 2.31302509538916e-07 |
| LUAD | MRPS18C | MRPL42 | -6.34610249602491 | 2.48255276366547e-08 |
| LUAD | MRPS18C | MRPS14 | -3.02634914022647 | 4.24616078981701e-06 |
| LIHC | MRPS18C | MRPS2 | -1.14771055358828 | 4.2584580238307e-05 |
| LUSC | MRPS18C | MRPS5 | -7.65956389962319 | 4.27210217182982e-06 |
| KIRC | MRPS18C | MRPL42 | -4.382095336248 | 5.26630854166927e-06 |
| LUSC | MRPS18C | MRPS11 | -2.9004097541444 | 5.43966600483641e-07 |
| HNSC | MRPS18C | MRPS18A | -2.4520120168475 | 5.97184352955084e-05 |
| LUSC | MRPS18C | MRPS14 | -3.86726163364221 | 6.1453992201761e-05 |
| BRCA | MRPS18C | MRPS7 | -2.12787460270434 | 9.33194208595055e-10 |
| Protein-protein interactors with this translation factor (BIOGRID-3.4.160) |
| PPI interactors with MRPS18C |
| LIG4, SHMT2, MOV10, NOL12, TRA2A, RPL6, MRPS2, TRMT10B, HNRNPA1, ZNF707, MRPS31, MRPS5, MRPS11, MRPS6, PPTC7, MRPS34, AURKAIP1, PDGFB, MRPS27, SNRNP70, ZBTB48, GLTSCR2, CCDC59, RPL18, E4F1, HEXIM1, MEPCE, LARP7, HSPD1, TCF7L2, ALYREF, PRKCI, ESR1, IMMP2L, GRSF1, ACAD9, AUH, C12orf65, C1QBP, C21orf33, C6orf203, C8orf82, CCDC90B, CS, DHX30, FASTKD3, FASTKD5, GFM1, HINT2, ICT1, LRPPRC, CCDC109B, MDH2, METTL15, METTL17, MRPL11, MRPS12, MRPS26, MRRF, MTERF3, MTIF2, MTIF3, MTRF1, MTRF1L, NGRN, PMPCA, PMPCB, RPUSD4, SLIRP, SSBP1, TACO1, TBRG4, TFAM, TMEM70, TRUB2, TSFM, TUFM, VWA8, EXD2, FASN, MRPS15, MRPS9, N4BP2L2, YBX1, RPL13A, H1FNT, EDC4, MRPS17, MRPS22, LIN28B, ZNF777, SULF2, H2AFB3, ABT1, SRSF5, DSG4, ZNF17, MRPL2, RPS24, MRPS35, GNL2, PCBP4, ZNF460, PTCD3, MRPS10, ZKSCAN8, MRPS33, RPL27A, MRPS28, LANCL2, RPL17, DBT, SRSF6, SUPV3L1, ZNF467, RPS9, MRPS21, MRPS14, MRPS23, SIRT3, MCAT, FAM120A, HNRNPU, DAP3, MRPS7, SMG5, MRPS25, RPL37, UTP23, MRPS24, DUSP14, SRSF3, PYCRL, RBMS2, MRPS16, NUDT6, NOA1, MRPS18B, RPL26, PRR3, SH2D4A, RPL13, UQCC1, PRIM2, SRP14, UQCC2, FGF17, SRSF7, NEIL1, MANF, PLCB3, RPL19, ERAL1, RPL23A, HIST1H2AM, PAK3, RPL35, ARFGAP2, CHMP1A, SRP54, PPP1R12A, TOMM34, TTC9C, DNM3, ZC3H3, SRSF1, ARHGEF1, ZNF574, CCDC43, CHMP2A, DNM2, RPL3, GNA13, SURF6, CCDC12, SH3PXD2B, ZC3HAV1, LIN28A, RPL10, ZMAT2, BTF3L4, RPS27, KLF12, |
Top |
|
| Clinically associated variants from ClinVar. |
| Gene | Chr | Position | RefSeq | VarSeq | RefSeeq | VarType | Pathogenic | Disease | VarInfo |
| nsSNVs with sample frequency (size of circle) from TCGA 33 cancers. |
 |
| SNVs and Indels |
| Gene | Cancer type | Chromosome | Start | End | RefSeeq | MutSeq | Mutation type | AAchange | # samples |
| MRPS18C | UCEC | chr4 | 84382343 | 84382343 | G | A | Missense_Mutation | p.R141Q | 3 |
| MRPS18C | LUAD | chr4 | 84377294 | 84377294 | G | A | Missense_Mutation | p.A22T | 2 |
| MRPS18C | BRCA | chr4 | 84377236 | 84377236 | C | T | Missense_Mutation | p.R1C | 2 |
| MRPS18C | BRCA | chr4 | 84377269 | 84377271 | GAA | - | In_Frame_Del | p.K15in_frame_del | 2 |
| MRPS18C | SKCM | chr4 | 84377272 | 84377272 | G | A | Silent | p.K14K | 2 |
| MRPS18C | CESC | chr4 | 84380912 | 84380912 | C | G | Missense_Mutation | 2 | |
| MRPS18C | SKCM | chr4 | 84377277 | 84377277 | T | C | Missense_Mutation | p.L16S | 2 |
| MRPS18C | CESC | chr4 | 84377261 | 84377261 | C | T | Silent | 2 | |
| MRPS18C | STAD | chr4 | 84379541 | 84379541 | T | C | Missense_Mutation | p.C65R | 2 |
| MRPS18C | BLCA | chr4 | 84382165 | 84382165 | T | A | Missense_Mutation | p.I111N | 2 |
| MRPS18C | UVM | chr4 | 84377254 | 84377254 | C | T | Silent | p.C8C | 1 |
| MRPS18C | BLCA | chr4 | 84377256 | 84377256 | G | T | Missense_Mutation | p.G9V | 1 |
| MRPS18C | BLCA | chr4 | 84379565 | 84379565 | G | A | Missense_Mutation | p.D73N | 1 |
| MRPS18C | LUAD | chr4 | 84377239 | 84377239 | T | C | Silent | p.A3A | 1 |
| MRPS18C | SARC | chr4 | 84380892 | 84380892 | G | T | Splice_Site | 1 | |
| MRPS18C | BLCA | chr4 | 84382165 | 84382165 | T | A | Missense_Mutation | 1 | |
| MRPS18C | BLCA | chr4 | 84377203 | 84377203 | C | T | Missense_Mutation | 1 | |
| MRPS18C | SKCM | chr4 | 84379500 | 84379500 | C | T | Splice_Site | p.P51_splice | 1 |
| MRPS18C | BLCA | chr4 | 84377255 | 84377255 | G | A | Missense_Mutation | 1 | |
| MRPS18C | KIRC | chr4 | 84379580 | 84379580 | C | A | Missense_Mutation | p.Q78K | 1 |
| MRPS18C | BLCA | chr4 | 84377256 | 84377256 | G | T | Missense_Mutation | 1 | |
| MRPS18C | LGG | chr4 | 84379555 | 84379555 | A | C | Silent | p.G69G | 1 |
| MRPS18C | THCA | chr4 | 84377236 | 84377236 | C | T | Silent | 1 | |
| MRPS18C | BLCA | chr4 | 84379565 | 84379565 | G | A | Missense_Mutation | 1 | |
| MRPS18C | LGG | chr4 | 84379555 | 84379555 | A | C | Silent | 1 | |
| MRPS18C | THCA | chr4 | 84377236 | 84377236 | C | T | Silent | p.A2A | 1 |
| MRPS18C | LIHC | chr4 | 84379528 | 84379528 | A | G | Silent | 1 | |
| MRPS18C | BLCA | chr4 | 84377255 | 84377255 | G | A | Missense_Mutation | p.G9S | 1 |
| MRPS18C | LIHC | chr4 | 84382321 | 84382321 | A | G | Missense_Mutation | p.K134E | 1 |
| Copy number variation (CNV) of MRPS18C * Click on the image to open the original image in a new window. |
 |
| Fusion gene breakpoints (product of the structural variants (SVs)) across MRPS18C * Click on the image to open the UCSC genome browser with custom track showing this image in a new window. |
 |
| Fusion genes with this translation factor from FusionGDB2.0. |
| FusionGDB2 ID | Disease | Sample | Hgene | Hchr | Hbp | Hstrand | Tgene | Tchr | Tbp | Tstrand |
| 37988 | ESCA | TCGA-LN-A9FO | FAM175A | chr4 | 84384646 | - | MRPS18C | chr4 | 84380892 | + |
| 37988 | N/A | AI696129 | FAM175A | chr4 | 84382126 | - | MRPS18C | chr4 | 84382185 | - |
| 37998 | N/A | EC499381 | HSPD1 | chr2 | 198351399 | + | MRPS18C | chr4 | 84378825 | + |
| 80403 | GBM | TCGA-28-5209-01A | MRPS18C | chr4 | 84378111 | + | DLG1 | chr3 | 196796131 | - |
| 96150 | OV | TCGA-13-1511 | MRPS18C | chr4 | 84378111 | + | ENOPH1 | chr4 | 83369072 | + |
| 96150 | OV | TCGA-13-1511 | MRPS18C | chr4 | 84379582 | + | ENOPH1 | chr4 | 83369072 | + |
| 96150 | OV | TCGA-13-1511-01A | MRPS18C | chr4 | 84378111 | + | ENOPH1 | chr4 | 83369073 | + |
| 96150 | OV | TCGA-13-1511-01A | MRPS18C | chr4 | 84379582 | + | ENOPH1 | chr4 | 83369073 | + |
| 55151 | N/A | BX328907 | MRPS18C | chr4 | 84382386 | + | SIGLEC10 | chr19 | 51913817 | - |
Top |
|
| Kaplan-Meier plots with logrank tests of overall survival (OS) |
 |
| Cancer type | Translation factor | Coefficent | Hazard ratio | Wald test pval | Likelihool ratio pval | Logrank test pval | # samples |
Top |
|
| Differential gene expression between female and male. (Wilcoxon test, pval<0.05) |
 |
| Cancer type | Translation factor | pval | adj.p |
Top |
|
| Differential gene expression between young and old age groups (Wilcoxon test, pval<0.05) |
 |
| Cancer type | Translation factor | pval | adj.p |
| LIHC | MRPS18C | 0.000481711865544657 | 0.016 |
| KIRP | MRPS18C | 0.00509254159240066 | 0.16 |
| LAML | MRPS18C | 0.0439379190269481 | 1 |
| BRCA | MRPS18C | 0.0383624687142051 | 1 |
| SKCM | MRPS18C | 0.0435893122580465 | 1 |
| THYM | MRPS18C | 0.0191191376174054 | 0.59 |
Top |
|
| Drugs targeting genes involved in this translation factor. (DrugBank Version 5.1.8 2021-05-08) |
| UniProtAcc | DrugBank ID | Drug name | Drug activity | Drug type | Drug status |
Top |
|
| Diseases associated with this translation factor. (DisGeNet 4.0) |
| Disease ID | Disease Name | # PubMeds | Disease source |
(UTHealth)
Web File Viewing | Emergency Information |Campus Carry|Site Policies