
|
||||||
|

Translation Factor: VTA1 (NCBI Gene ID:51534) |
|
 Gene Summary Gene Summary |
| Gene Information | Gene Name: VTA1 | Gene ID: 51534 | Gene Symbol | VTA1 | Gene ID | 51534 |
| Gene Name | vesicle trafficking 1 | |
| Synonyms | C6orf55|DRG-1|DRG1|HSPC228|LIP5|My012|SBP1 | |
| Cytomap | 6q24.1-q24.2 | |
| Type of Gene | protein-coding | |
| Description | vacuolar protein sorting-associated protein VTA1 homologLYST-interacting protein 5SKD1-binding protein 1Vps20-associated 1 homologdopamine-responsive gene 1 proteinhomolog of mouse SKD1-binding protein 1vesicle (multivesicular body) trafficking 1 | |
| Modification date | 20200313 | |
| UniProtAcc | . | |
| Child GO biological process term(s) under GO:0006412 |
| GO ID | GO term |
| Gene ontology of translaction factor with evidence of Inferred from Direct Assay (IDA) from Entrez |
| Partner | Gene | GO ID | GO term | PubMed ID |
| Inferred gene age of translation factor. |
| Gene | Inferred gene age group among (0 - 67.6], (67.6 - 355.7], (355.7 - 733], (733 - 1119.25], >1119.25 |
Top |
|
| We searched PubMed using 'VTA1[title] AND translation [title] AND human.' |
| Gene | Title | PMID |
Top |
|
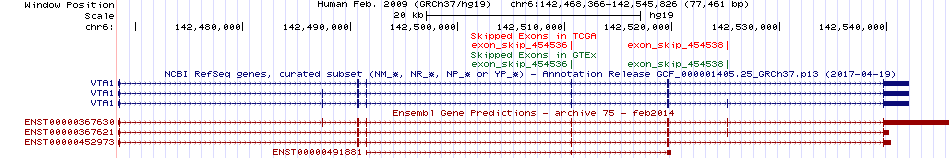
| Skipped exons in TCGA and GTEx based on Ensembl gene isoform structure. * Click on the image to open the UCSC genome browser with custom track showing this image in a new window. For more annotations, please visit our ExonSkipDB. |
 |
| Open reading frame (ORF) analsis of exon skipping events based on Ensembl gene isoform structure. * Click on the break point to see the gene structure around the break point region using the UCSC Genome Browser. |
| ENST | Exon skip start (DNA) | Exon Skip end (DNA) | ORF |
| Exon skipping position in the amino acid sequence. |
| ENST | Exon skip start (DNA) | Exon Skip end (DNA) | Len(transcript seq) | Exon skip start (mRNA) | Exon Skip end (mRNA) | Len(amino acid seq) | Exon skip start (AA) | Exon Skip end (AA) |
| Potentially (partially) lost protein functional features of UniProt. |
| UniProtAcc | Exon skip start (AA) | Exon Skip end (AA) | Function feature start (AA) | Function feature end (AA) | Functional feature type | Functional feature desc. |
Top |
|
| Gene expression level across TCGA pancancer |
| Gene expression level across GTEx pantissue |
| Expression level of gene isoforms across TCGA pancancer |
| Expression level of gene isoforms across GTEx pantissue |
| Cancer(tissue) type-specific expression level of Translation factor using z-score distriution |
| Differential expression between tumor and matched normal (in the cancer types with more than 10 matched samples) |
| Cancer type | Translation factor | FC | adj.pval |
| LUAD | VTA1 | -2.9019417965147 | 0.000126867068943978 |
| COAD | VTA1 | -1.33793411082115 | 0.0106922325588835 |
| KICH | VTA1 | 2.71243564593089 | 5.96046447753906e-08 |
| THCA | VTA1 | 1.22034521330269 | 9.95771220772969e-10 |
Top |
|
| Translation factor expression regulation through miRNA binding |
| Cancer type | Gene | miRNA | TargetScan binding score (Context++ score percentile) | Coefficient | Pvalue |
| Translation factor expression regulation through methylation in the promoter of Translation factor |
| Cancer type | Gene | methyl group b | methyl group a | DEG pval | avg methyl in b | avg methyl in a | avg exp in b | avg exp in a |
| Translation factor expression regulation through methylation in the gene body of Translation factor (positive regulation) |
| Cancer type | Gene | methyl group b | methyl group a | DEG pval | avg methyl in b | avg methyl in a | avg exp in b | avg exp in a |
| Translation factor expression regulation through copy number variation of Translation factor |
| Cancer type | Gene | Coefficient | Pvalue |
Top |
|
| Strongly correlated genes belong to cellular important gene groups with VTA1 (coefficient>0.8, pval<0.05, node color based on FC between tumor and matched normal). Significantly associated important genes in the individual cancer types. * Cell metabolism gene: cell metabolism genes from REACTOME (black edge), IUPHAR: drug target genes from IUPHAR (blue edge), Kinase: human kinase genes (brown edge), CGC: cancer gene census genes (orange edge), TSG: tumor suppresor genes (purple edge), Epifactor: epigenetic factors (light blue edge), TF: transcription factors (green) |
| Cancer type | Gene group | Translation factor | Correlated gene | Coefficient | Pvalue |
Top |
|
| Protein 3D structure Visit iCn3D. |
Top |
|
| Protein-protein interaction networks * Overlap between up-regulated DEGs (log2FC<-1 and adj.P<0.05) and STRING PPI network (center: Translation factor, node: DEGs, edges: weighted by -log2(adj.P)) |
| Overlap between down-regulated DEGs (log2FC>1 and adj.P<0.05) and STRING PPI network (center: Translation factor, node: DEGs, edges: weighted by -log2(adj.P)) |
 * Edge colors based on TCGA cancer types. |
| * Overlap between DEGs (log2FC>1 and adj.P<0.05) and STRING PPI network per cancer (center: Translation factor, node: DEGs, node color: log2FC, edges: weighted by -log2(adj.P)) |
| Cancer type | Translation factor | Interacting protein coding gene | FC | adj.pval |
| Protein-protein interactors with this translation factor (BIOGRID-3.4.160) |
| PPI interactors with VTA1 |
Top |
|
| Clinically associated variants from ClinVar. |
| Gene | Chr | Position | RefSeq | VarSeq | RefSeeq | VarType | Pathogenic | Disease | VarInfo |
| nsSNVs with sample frequency (size of circle) from TCGA 33 cancers. |
| SNVs and Indels |
| Gene | Cancer type | Chromosome | Start | End | RefSeeq | MutSeq | Mutation type | AAchange | # samples |
| Copy number variation (CNV) of VTA1 * Click on the image to open the original image in a new window. |
 |
| Fusion gene breakpoints (product of the structural variants (SVs)) across VTA1 * Click on the image to open the UCSC genome browser with custom track showing this image in a new window. |
 |
| Fusion genes with this translation factor from FusionGDB2.0. |
| FusionGDB2 ID | Disease | Sample | Hgene | Hchr | Hbp | Hstrand | Tgene | Tchr | Tbp | Tstrand |
| 102227 | UVM | TCGA-VD-A8KJ-01A | ADAT2 | chr6 | 143771700 | - | VTA1 | chr6 | 142525122 | + |
| 102227 | N/A | CB048720 | C16orf47 | chr16 | 73506165 | - | VTA1 | chr6 | 142540740 | - |
| 102227 | LIHC | TCGA-CC-5263-01A | GPR126 | chr6 | 142623468 | + | VTA1 | chr6 | 142487365 | + |
| 102227 | LIHC | TCGA-DD-AAW3-01A | GPR126 | chr6 | 142731056 | - | VTA1 | chr6 | 142510563 | + |
| 102227 | LIHC | TCGA-XR-A8TG-01A | GPR126 | chr6 | 142630781 | + | VTA1 | chr6 | 142539635 | + |
| 102227 | STAD | TCGA-BR-A4QI-01A | GPR126 | chr6 | 142691930 | + | VTA1 | chr6 | 142519576 | + |
| 102227 | N/A | CB049567 | MELK | chr9 | 36616406 | + | VTA1 | chr6 | 142519918 | - |
| 102227 | LUAD | TCGA-38-6178-01A | NHSL1 | chr6 | 138750848 | - | VTA1 | chr6 | 142539635 | + |
| 102227 | LIHC | TCGA-CC-5261 | SOBP | chr6 | 107908379 | + | VTA1 | chr6 | 142510562 | + |
| 102227 | N/A | AI799891 | SPAG1 | chr8 | 101235847 | + | VTA1 | chr6 | 142540726 | - |
| 102227 | N/A | AL713658 | TET1 | chr10 | 70451381 | + | VTA1 | chr6 | 142516760 | - |
| 102227 | UCEC | TCGA-EY-A2OO | UNC5C | chr4 | 96256560 | - | VTA1 | chr6 | 142519575 | + |
| 101332 | STAD | TCGA-CD-8525-01A | VTA1 | chr6 | 142468536 | + | AIG1 | chr6 | 143605247 | + |
| 103218 | N/A | CB048721 | VTA1 | chr6 | 142540740 | + | ATP9B | chr18 | 76863288 | - |
| 98575 | Non-Cancer | ERR188198 | VTA1 | chr6 | 142543227 | + | IGLC3 | chr22 | 23247168 | + |
| 98575 | Non-Cancer | ERR188198 | VTA1 | chr6 | 142543227 | + | IGLJ3 | chr22 | 23247168 | + |
| 98575 | SARC | TCGA-FX-A3NK-01A | VTA1 | chr6 | 142491558 | + | PPIL4 | chr6 | 149826840 | - |
| 102227 | N/A | BI492514 | ZNF507 | chr19 | 32855253 | + | VTA1 | chr6 | 142541914 | - |
Top |
|
| Kaplan-Meier plots with logrank tests of overall survival (OS) |
| Cancer type | Translation factor | Coefficent | Hazard ratio | Wald test pval | Likelihool ratio pval | Logrank test pval | # samples |
Top |
|
| Differential gene expression between female and male. (Wilcoxon test, pval<0.05) |
| Cancer type | Translation factor | pval | adj.p |
Top |
|
| Differential gene expression between young and old age groups (Wilcoxon test, pval<0.05) |
| Cancer type | Translation factor | pval | adj.p |
Top |
|
| Drugs targeting genes involved in this translation factor. (DrugBank Version 5.1.8 2021-05-08) |
| UniProtAcc | DrugBank ID | Drug name | Drug activity | Drug type | Drug status |
Top |
|
| Diseases associated with this translation factor. (DisGeNet 4.0) |
| Disease ID | Disease Name | # PubMeds | Disease source |
(UTHealth)
Web File Viewing | Emergency Information |Campus Carry|Site Policies