
|
||||||
|

Translation Factor: DPH5 (NCBI Gene ID:51611) |
|
 Gene Summary Gene Summary |
| Gene Information | Gene Name: DPH5 | Gene ID: 51611 | Gene Symbol | DPH5 | Gene ID | 51611 |
| Gene Name | diphthamide biosynthesis 5 | |
| Synonyms | AD-018|CGI-30|HSPC143|NPD015 | |
| Cytomap | 1p21.2 | |
| Type of Gene | protein-coding | |
| Description | diphthine methyl ester synthaseDPH5 homologdiphthamide biosynthesis methyltransferasediphthine synthaseprotein x 0011 | |
| Modification date | 20200320 | |
| UniProtAcc | Q9H2P9 | |
| Child GO biological process term(s) under GO:0006412 |
| GO ID | GO term |
| GO:0006417 | Regulation of translation |
| GO:0006414 | Translational elongation |
| GO:0006412 | Translation |
| Gene ontology of translaction factor with evidence of Inferred from Direct Assay (IDA) from Entrez |
| Partner | Gene | GO ID | GO term | PubMed ID |
| Inferred gene age of translation factor. |
| Gene | Inferred gene age group among (0 - 67.6], (67.6 - 355.7], (355.7 - 733], (733 - 1119.25], >1119.25 |
Top |
|
| We searched PubMed using 'DPH5[title] AND translation [title] AND human.' |
| Gene | Title | PMID |
| DPH5 | . | . |
Top |
|
| Skipped exons in TCGA and GTEx based on Ensembl gene isoform structure. * Click on the image to open the UCSC genome browser with custom track showing this image in a new window. For more annotations, please visit our ExonSkipDB. |
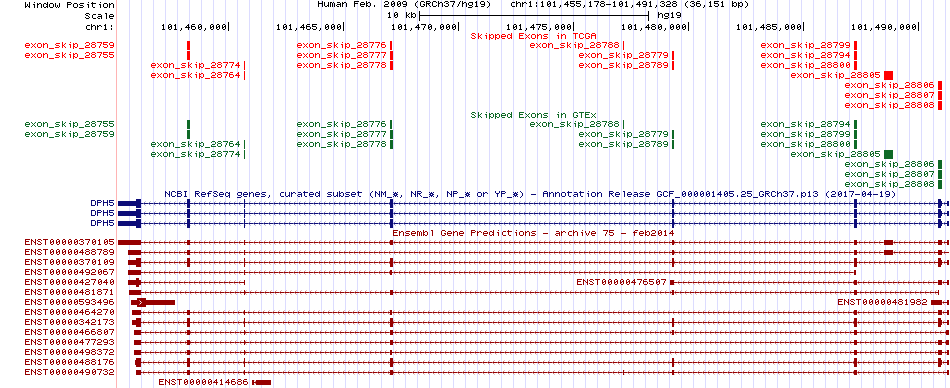 |
| Open reading frame (ORF) analsis of exon skipping events based on Ensembl gene isoform structure. * Click on the break point to see the gene structure around the break point region using the UCSC Genome Browser. |
| ENST | Exon skip start (DNA) | Exon Skip end (DNA) | ORF |
| ENST00000370109 | 101458192 | 101458296 | Frame-shift |
| ENST00000488176 | 101458192 | 101458296 | Frame-shift |
| ENST00000370109 | 101460665 | 101460705 | Frame-shift |
| ENST00000488176 | 101460665 | 101460705 | Frame-shift |
| ENST00000370109 | 101467022 | 101467143 | Frame-shift |
| ENST00000488176 | 101467022 | 101467143 | Frame-shift |
| ENST00000370109 | 101479265 | 101479374 | Frame-shift |
| ENST00000488176 | 101479265 | 101479374 | Frame-shift |
| ENST00000370109 | 101487196 | 101487321 | Frame-shift |
| ENST00000488176 | 101487196 | 101487321 | Frame-shift |
| ENST00000370109 | 101490864 | 101491022 | 3UTR-3CDS |
| ENST00000488176 | 101490864 | 101491022 | 3UTR-3CDS |
| Exon skipping position in the amino acid sequence. |
| ENST | Exon skip start (DNA) | Exon Skip end (DNA) | Len(transcript seq) | Exon skip start (mRNA) | Exon Skip end (mRNA) | Len(amino acid seq) | Exon skip start (AA) | Exon Skip end (AA) |
| Potentially (partially) lost protein functional features of UniProt. |
| UniProtAcc | Exon skip start (AA) | Exon Skip end (AA) | Function feature start (AA) | Function feature end (AA) | Functional feature type | Functional feature desc. |
Top |
|
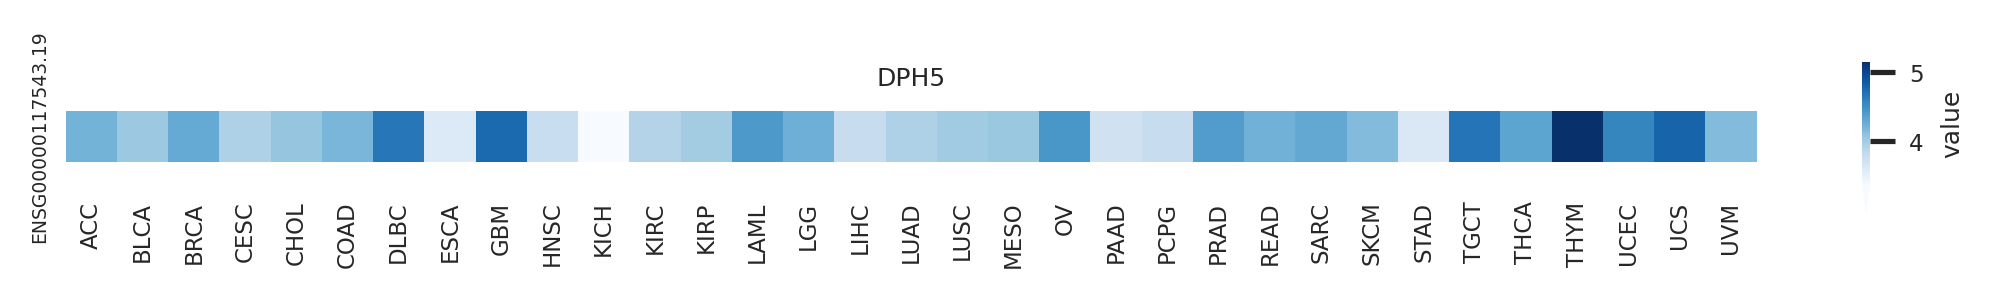
| Gene expression level across TCGA pancancer |
 |
| Gene expression level across GTEx pantissue |
 |
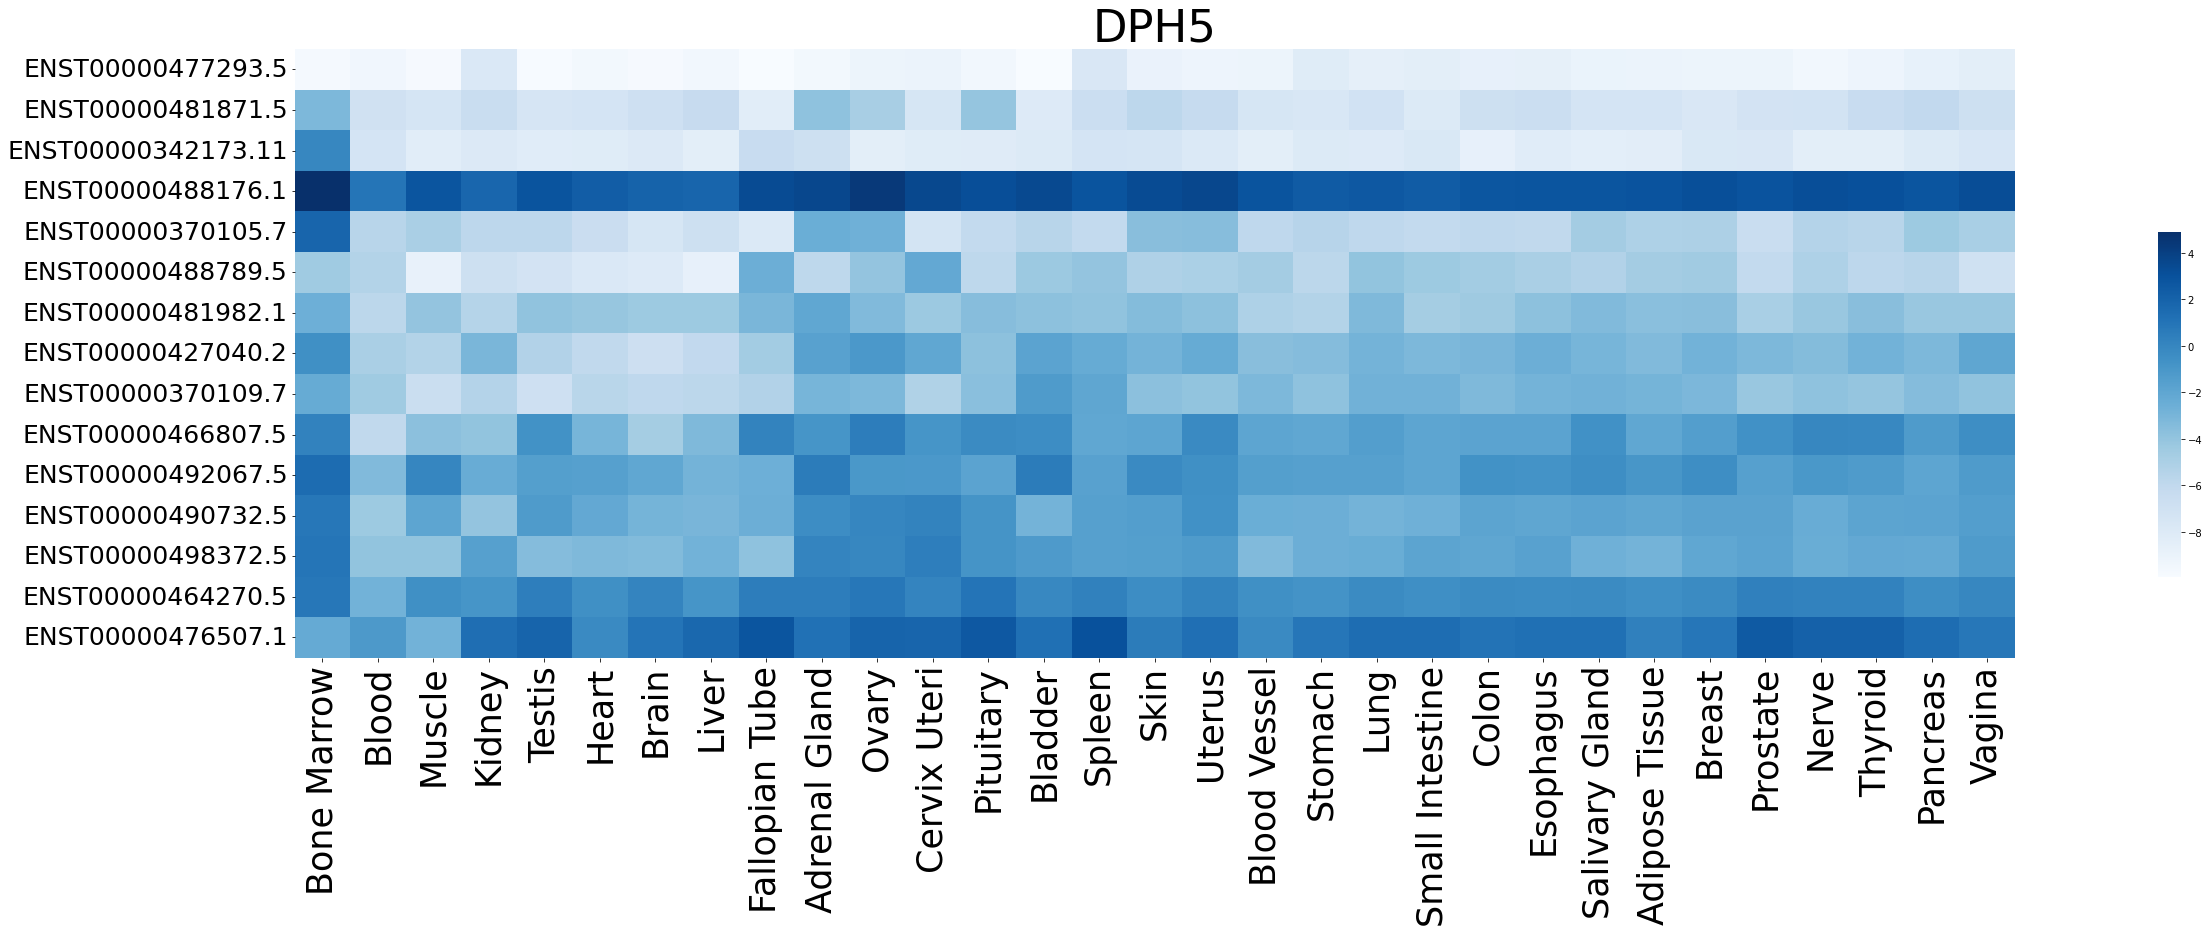
| Expression level of gene isoforms across TCGA pancancer |
 |
| Expression level of gene isoforms across GTEx pantissue |
 |
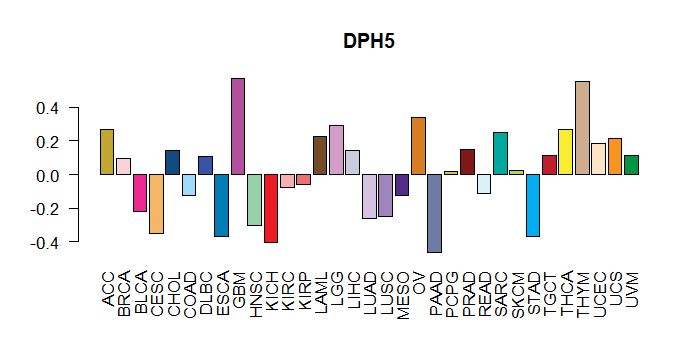
| Cancer(tissue) type-specific expression level of Translation factor using z-score distriution |
 |
| Differential expression between tumor and matched normal (in the cancer types with more than 10 matched samples) |
 |
| Cancer type | Translation factor | FC | adj.pval |
| LUSC | DPH5 | -1.6235156890085 | 0.000679097693381554 |
| HNSC | DPH5 | 1.65799576563523 | 0.000797143226918707 |
| PRAD | DPH5 | 1.05284539715115 | 0.0496995842628905 |
| LUAD | DPH5 | -1.84948986969044 | 6.6826904409067e-05 |
| KICH | DPH5 | 2.78540560574647 | 8.80360603332519e-05 |
Top |
|
| Translation factor expression regulation through miRNA binding |
| Cancer type | Gene | miRNA | TargetScan binding score (Context++ score percentile) | Coefficient | Pvalue |
| Translation factor expression regulation through methylation in the promoter of Translation factor |
 |
| Cancer type | Gene | methyl group b | methyl group a | DEG pval | avg methyl in b | avg methyl in a | avg exp in b | avg exp in a |
| Translation factor expression regulation through methylation in the gene body of Translation factor (positive regulation) |
 |
| Cancer type | Gene | methyl group b | methyl group a | DEG pval | avg methyl in b | avg methyl in a | avg exp in b | avg exp in a |
| Translation factor expression regulation through copy number variation of Translation factor |
 |
| Cancer type | Gene | Coefficient | Pvalue |
| LAML | DPH5 | 0.057670231 | 0.008187127 |
Top |
|
| Strongly correlated genes belong to cellular important gene groups with DPH5 (coefficient>0.8, pval<0.05, node color based on FC between tumor and matched normal). Significantly associated important genes in the individual cancer types. * Cell metabolism gene: cell metabolism genes from REACTOME (black edge), IUPHAR: drug target genes from IUPHAR (blue edge), Kinase: human kinase genes (brown edge), CGC: cancer gene census genes (orange edge), TSG: tumor suppresor genes (purple edge), Epifactor: epigenetic factors (light blue edge), TF: transcription factors (green) |
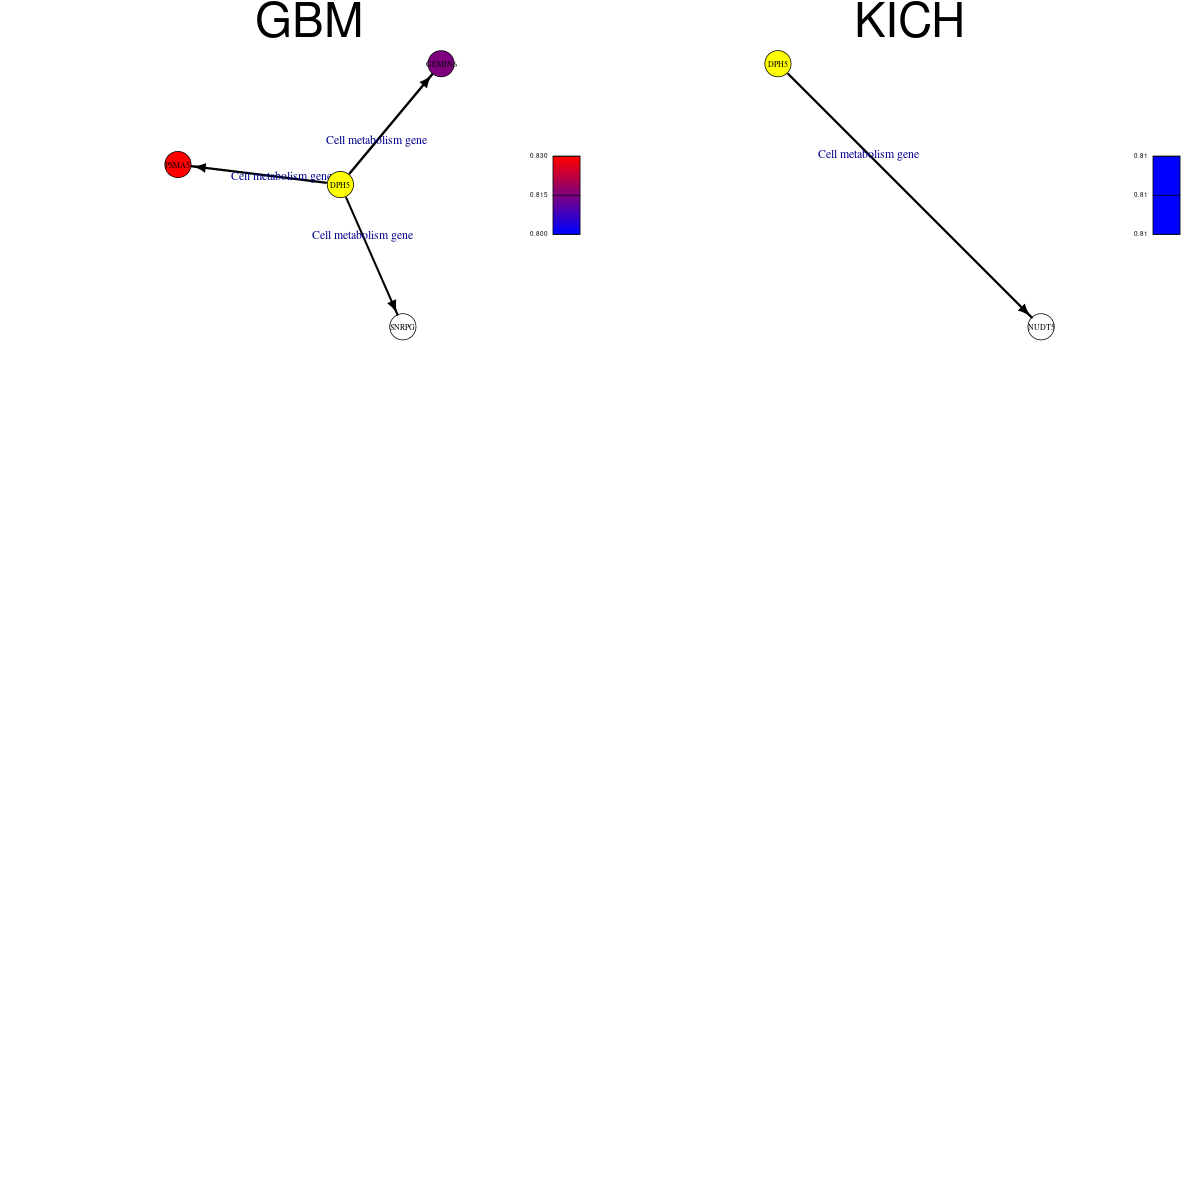 |
| Cancer type | Gene group | Translation factor | Correlated gene | Coefficient | Pvalue |
| GBM | Cell metabolism gene | DPH5 | GEMIN6 | 0.800414938 | 1.26E-39 |
| GBM | Cell metabolism gene | DPH5 | PSMA5 | 0.809171239 | 4.14E-41 |
| GBM | Cell metabolism gene | DPH5 | SNRPG | 0.827160611 | 2.08E-44 |
| KICH | Cell metabolism gene | DPH5 | NUDT5 | 0.811385481 | 1.82E-22 |
Top |
|
| Protein 3D structure Visit iCn3D. |
Top |
|
| Protein-protein interaction networks * Overlap between up-regulated DEGs (log2FC<-1 and adj.P<0.05) and STRING PPI network (center: Translation factor, node: DEGs, edges: weighted by -log2(adj.P)) |
 |
| Overlap between down-regulated DEGs (log2FC>1 and adj.P<0.05) and STRING PPI network (center: Translation factor, node: DEGs, edges: weighted by -log2(adj.P)) |
 |
 * Edge colors based on TCGA cancer types. |
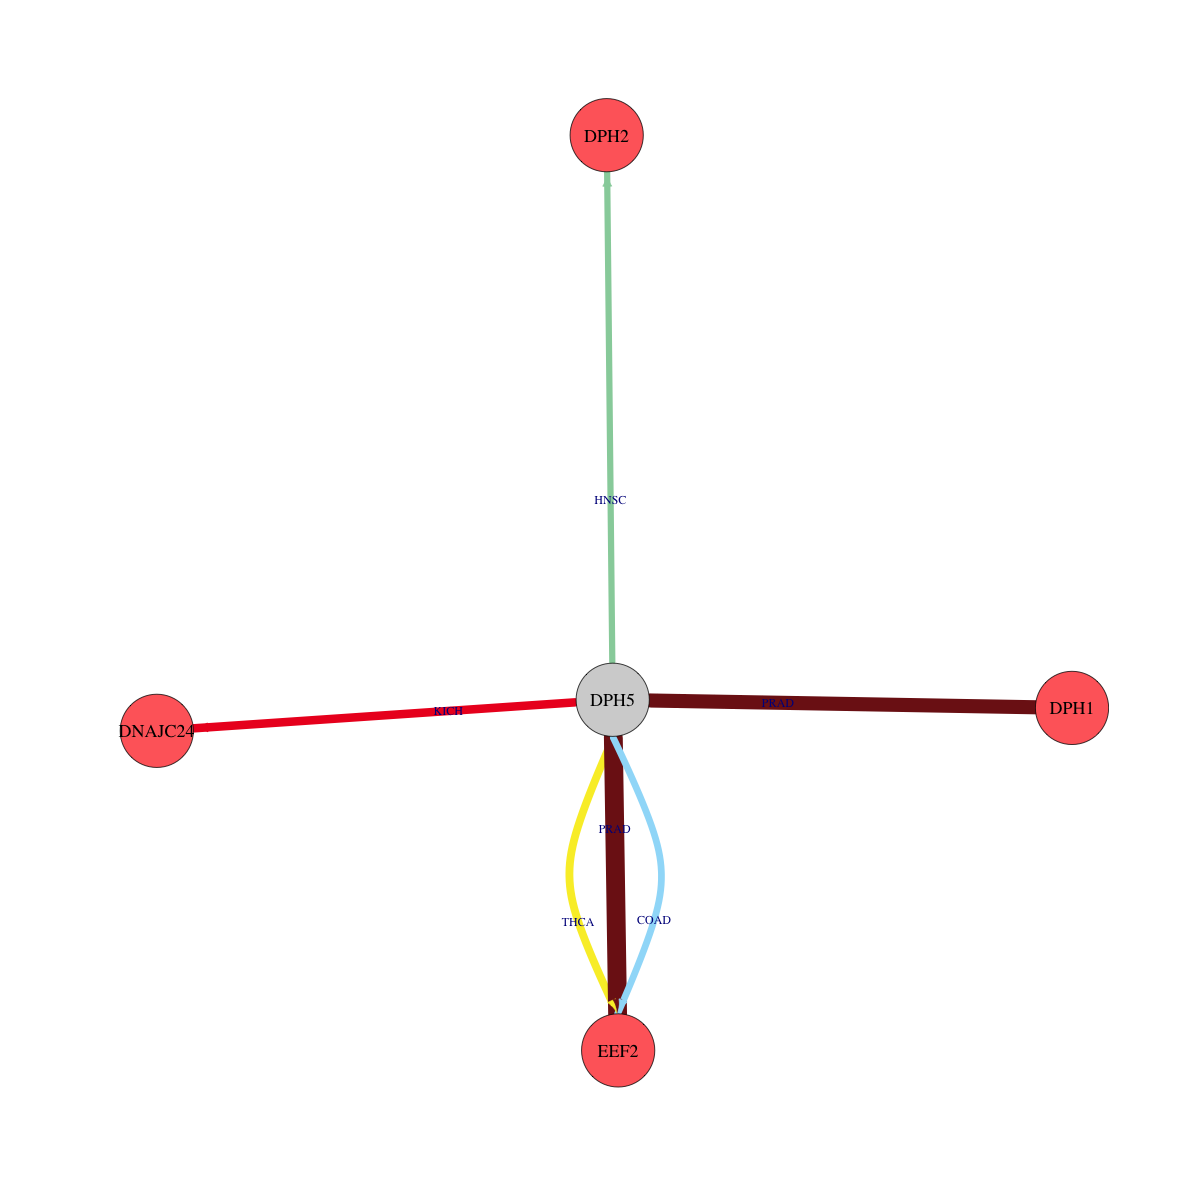
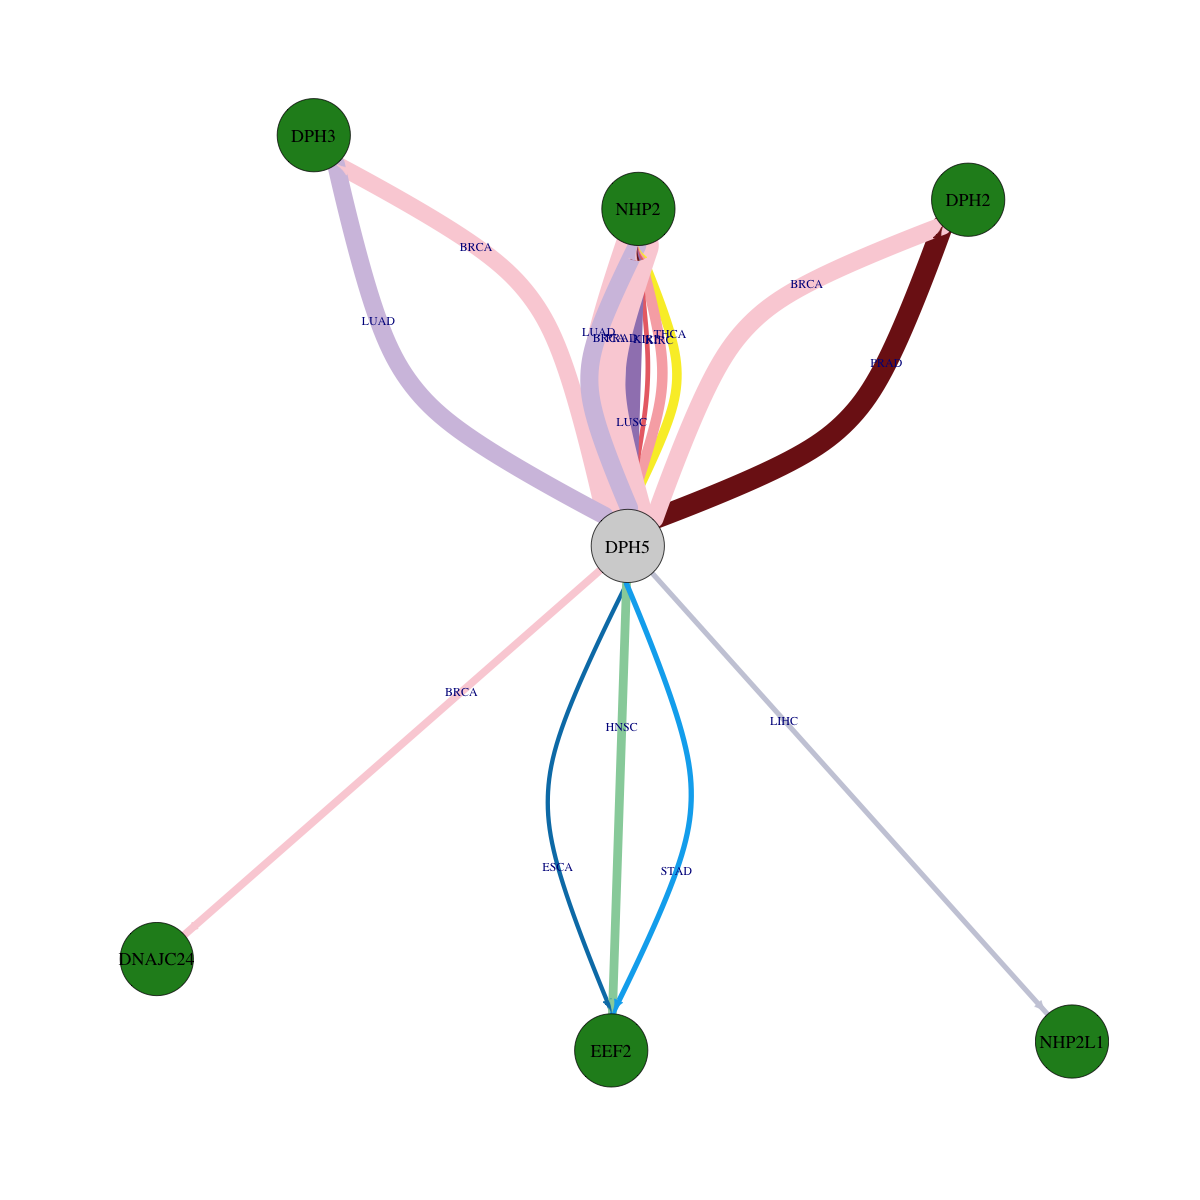
| * Overlap between DEGs (log2FC>1 and adj.P<0.05) and STRING PPI network per cancer (center: Translation factor, node: DEGs, node color: log2FC, edges: weighted by -log2(adj.P)) |
 |
| Cancer type | Translation factor | Interacting protein coding gene | FC | adj.pval |
| THCA | DPH5 | NHP2 | -4.50354225039153 | 0.000144459266043069 |
| HNSC | DPH5 | EEF2 | -1.90805330069302 | 0.000299885096865183 |
| KICH | DPH5 | DNAJC24 | 1.38964695145852 | 0.000376403331756592 |
| THCA | DPH5 | EEF2 | 1.35574858496176 | 0.000711089919756285 |
| BRCA | DPH5 | DNAJC24 | -1.14389652312681 | 0.000902838651961803 |
| COAD | DPH5 | EEF2 | 1.67025113686866 | 0.00197160243988037 |
| HNSC | DPH5 | DPH2 | 1.63786614401166 | 0.00315447678462988 |
| STAD | DPH5 | EEF2 | -1.87846190344448 | 0.00733334058895707 |
| LIHC | DPH5 | NHP2L1 | -1.51481836078682 | 0.00864730753913977 |
| PRAD | DPH5 | NHP2 | -2.3754652899968 | 0.00883849918742049 |
| KIRP | DPH5 | NHP2 | -1.28876621655782 | 0.0124990218318999 |
| ESCA | DPH5 | EEF2 | -3.4598326417414 | 0.0185546875 |
| BRCA | DPH5 | DPH3 | -2.55959741191714 | 1.53711242061404e-07 |
| PRAD | DPH5 | DPH1 | 1.04649113686082 | 2.13559901421379e-06 |
| PRAD | DPH5 | EEF2 | 1.63926479894191 | 2.70126293247147e-08 |
| PRAD | DPH5 | DPH2 | -1.7499736242082 | 3.91792760836218e-09 |
| LUSC | DPH5 | NHP2 | -1.5835906939555 | 5.18084356575054e-07 |
| LUAD | DPH5 | NHP2 | -2.33834300504675 | 5.47570214265305e-08 |
| BRCA | DPH5 | NHP2 | -5.36604889065533 | 5.61653473347207e-18 |
| KIRC | DPH5 | NHP2 | -1.27061943816611 | 5.8006156553143e-05 |
| BRCA | DPH5 | DPH2 | -2.32663867065443 | 6.11363360281251e-08 |
| LUAD | DPH5 | DPH3 | -3.59138499390076 | 7.41012444787115e-08 |
| Protein-protein interactors with this translation factor (BIOGRID-3.4.160) |
| PPI interactors with DPH5 |
| ENO1, MOV10, NXF1, C12orf10, CD2AP, HNRNPL, SFPQ, UFD1L, GCLC, NMD3, PARVA, SPG20, ZYX, KRAS, BICD2, LRRK2, FASN, |
Top |
|
| Clinically associated variants from ClinVar. |
| Gene | Chr | Position | RefSeq | VarSeq | RefSeeq | VarType | Pathogenic | Disease | VarInfo |
| nsSNVs with sample frequency (size of circle) from TCGA 33 cancers. |
 |
| SNVs and Indels |
| Gene | Cancer type | Chromosome | Start | End | RefSeeq | MutSeq | Mutation type | AAchange | # samples |
| DPH5 | HNSC | chr1 | 101490909 | 101490909 | G | A | Silent | p.L31L | 3 |
| DPH5 | PAAD | chr1 | 101456141 | 101456141 | G | A | Silent | p.A227A | 3 |
| DPH5 | PRAD | chr1 | 101487277 | 101487277 | T | C | Silent | p.E60E | 3 |
| DPH5 | UCEC | chr1 | 101467037 | 101467037 | G | A | Missense_Mutation | p.T159I | 3 |
| DPH5 | LUAD | chr1 | 101460684 | 101460684 | G | T | Missense_Mutation | p.S171Y | 2 |
| DPH5 | BLCA | chr1 | 101490988 | 101490988 | G | A | Silent | p.L4L | 2 |
| DPH5 | SKCM | chr1 | 101479281 | 101479281 | G | A | Silent | p.G118G | 2 |
| DPH5 | STAD | chr1 | 101458252 | 101458252 | T | C | Missense_Mutation | p.Q192R | 2 |
| DPH5 | STAD | chr1 | 101456138 | 101456138 | G | A | Silent | p.D228D | 2 |
| DPH5 | ESCA | chr1 | 101456046 | 101456046 | A | - | Frame_Shift_Del | p.I259fs | 2 |
| DPH5 | STAD | chr1 | 101456081 | 101456081 | T | C | Silent | p.E247E | 2 |
| DPH5 | PAAD | chr1 | 101456141 | 101456141 | G | A | Silent | 2 | |
| DPH5 | ESCA | chr1 | 101456097 | 101456097 | G | T | Missense_Mutation | p.T242N | 2 |
| DPH5 | ESCA | chr1 | 101456100 | 101456100 | C | T | Missense_Mutation | p.C241Y | 2 |
| DPH5 | UCEC | chr1 | 101458270 | 101458270 | C | T | Missense_Mutation | p.R186Q | 2 |
| DPH5 | LGG | chr1 | 101458213 | 101458213 | C | A | Missense_Mutation | p.R205I | 2 |
| DPH5 | LIHC | chr1 | 101490900 | 101490900 | A | T | Missense_Mutation | 2 | |
| DPH5 | BLCA | chr1 | 101456177 | 101456177 | C | T | Silent | 1 | |
| DPH5 | READ | chr1 | 101458287 | 101458287 | C | A | Missense_Mutation | p.K180N | 1 |
| DPH5 | ESCA | chr1 | 101456100 | 101456100 | C | T | Missense_Mutation | 1 | |
| DPH5 | SKCM | chr1 | 101456040 | 101456040 | G | A | Missense_Mutation | p.P261L | 1 |
| DPH5 | ESCA | chr1 | 101456051 | 101456051 | G | T | Silent | p.G257G | 1 |
| DPH5 | LUSC | chr1 | 101460686 | 101460686 | C | A | Missense_Mutation | p.Q170H | 1 |
| DPH5 | COAD | chr1 | 101490984 | 101490984 | C | T | Missense_Mutation | p.G6R | 1 |
| DPH5 | HNSC | chr1 | 101456010 | 101456010 | G | A | Missense_Mutation | 1 | |
| DPH5 | LUSC | chr1 | 101487267 | 101487267 | C | G | Missense_Mutation | p.E64Q | 1 |
| DPH5 | COAD | chr1 | 101490997 | 101490997 | C | T | Missense_Mutation | p.M1I | 1 |
| DPH5 | HNSC | chr1 | 101456040 | 101456040 | G | A | Missense_Mutation | 1 | |
| DPH5 | MESO | chr1 | 101479355 | 101479355 | G | T | Missense_Mutation | 1 | |
| DPH5 | ESCA | chr1 | 101455897 | 101455897 | A | - | RNA | NULL | 1 |
| DPH5 | HNSC | chr1 | 101467118 | 101467118 | G | A | Missense_Mutation | p.S132F | 1 |
| DPH5 | OV | chr1 | 101228765 | 101228765 | C | T | Silent | p.E215 | 1 |
| DPH5 | HNSC | chr1 | 101487279 | 101487279 | C | T | Missense_Mutation | p.E60K | 1 |
| DPH5 | STAD | chr1 | 101458257 | 101458257 | T | C | Silent | p.V190V | 1 |
| DPH5 | UCEC | chr1 | 101487287 | 101487287 | T | C | Missense_Mutation | p.D57G | 1 |
| DPH5 | KIRP | chr1 | 101456156 | 101456156 | T | C | Silent | p.L222L | 1 |
| DPH5 | ESCA | chr1 | 101456097 | 101456097 | G | T | Missense_Mutation | 1 | |
| DPH5 | LGG | chr1 | 101458271 | 101458271 | G | A | Missense_Mutation | p.R186W | 1 |
| DPH5 | BLCA | chr1 | 101490988 | 101490988 | G | A | Silent | 1 | |
| DPH5 | PRAD | chr1 | 101479332 | 101479332 | C | A | Silent | p.L101L | 1 |
| DPH5 | ESCA | chr1 | 101456051 | 101456051 | G | T | Silent | 1 | |
| DPH5 | BLCA | chr1 | 101458223 | 101458223 | G | T | Missense_Mutation | 1 | |
| DPH5 | READ | chr1 | 101458208 | 101458208 | G | A | Nonsense_Mutation | p.R207X | 1 |
| DPH5 | ESCA | chr1 | 101456046 | 101456046 | A | - | Frame_Shift_Del | 1 |
| Copy number variation (CNV) of DPH5 * Click on the image to open the original image in a new window. |
 |
| Fusion gene breakpoints (product of the structural variants (SVs)) across DPH5 * Click on the image to open the UCSC genome browser with custom track showing this image in a new window. |
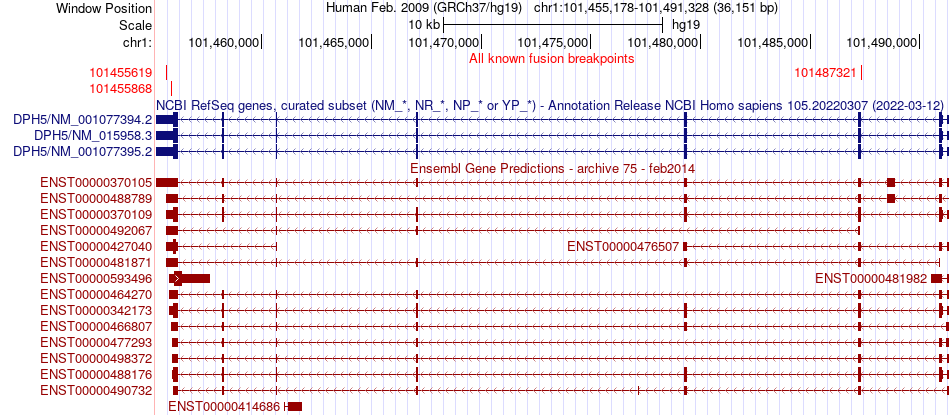 |
| Fusion genes with this translation factor from FusionGDB2.0. |
| FusionGDB2 ID | Disease | Sample | Hgene | Hchr | Hbp | Hstrand | Tgene | Tchr | Tbp | Tstrand |
| 92653 | PRAD | TCGA-EJ-7330-01A | COL11A1 | chr1 | 103352466 | - | DPH5 | chr1 | 101491617 | - |
| 97671 | N/A | BC003660 | DPH5 | chr1 | 101455619 | - | ARSD | chrX | 2824349 | - |
| 97170 | N/A | CA488992 | DPH5 | chr1 | 101455868 | - | DYNC2H1 | chr11 | 103145532 | - |
| 92653 | BRCA | TCGA-AN-A0FJ-01A | EXTL2 | chr1 | 101360189 | - | DPH5 | chr1 | 101487321 | - |
| 92654 | N/A | BQ003023 | TNFRSF1B | chr1 | 12268962 | - | DPH5 | chr1 | 101443342 | - |
Top |
|
| Kaplan-Meier plots with logrank tests of overall survival (OS) |
 |
| Cancer type | Translation factor | Coefficent | Hazard ratio | Wald test pval | Likelihool ratio pval | Logrank test pval | # samples |
Top |
|
| Differential gene expression between female and male. (Wilcoxon test, pval<0.05) |
 |
| Cancer type | Translation factor | pval | adj.p |
| HNSC | DPH5 | 0.00798628050192711 | 0.22 |
| BLCA | DPH5 | 0.011337980355558 | 0.31 |
| LIHC | DPH5 | 0.0130698919441256 | 0.34 |
| THYM | DPH5 | 0.0251662728468352 | 0.63 |
Top |
|
| Differential gene expression between young and old age groups (Wilcoxon test, pval<0.05) |
 |
| Cancer type | Translation factor | pval | adj.p |
| LUSC | DPH5 | 0.0148350849045145 | 0.45 |
| KIRC | DPH5 | 0.0312366012574323 | 0.87 |
| LGG | DPH5 | 0.000863995049920896 | 0.029 |
| LAML | DPH5 | 0.00360930577372296 | 0.12 |
| CESC | DPH5 | 0.0262854457847544 | 0.76 |
| BLCA | DPH5 | 0.00596642821768457 | 0.18 |
Top |
|
| Drugs targeting genes involved in this translation factor. (DrugBank Version 5.1.8 2021-05-08) |
| UniProtAcc | DrugBank ID | Drug name | Drug activity | Drug type | Drug status |
| Q9H2P9 | DB01752 | S-adenosyl-L-homocysteine | Small molecule | Experimental | |
| Q9H2P9 | DB01752 | S-adenosyl-L-homocysteine |
Top |
|
| Diseases associated with this translation factor. (DisGeNet 4.0) |
| Disease ID | Disease Name | # PubMeds | Disease source |
(UTHealth)
Web File Viewing | Emergency Information |Campus Carry|Site Policies