
|
||||||
|

Translation Factor: GTPBP2 (NCBI Gene ID:54676) |
|
 Gene Summary Gene Summary |
| Gene Information | Gene Name: GTPBP2 | Gene ID: 54676 | Gene Symbol | GTPBP2 | Gene ID | 54676 |
| Gene Name | GTP binding protein 2 | |
| Synonyms | JABELS | |
| Cytomap | 6p21.1 | |
| Type of Gene | protein-coding | |
| Description | GTP-binding protein 2 | |
| Modification date | 20200320 | |
| UniProtAcc | Q9BX10 | |
| Child GO biological process term(s) under GO:0006412 |
| GO ID | GO term |
| GO:0006417 | Regulation of translation |
| GO:0008135 | Translation factor activity, RNA binding |
| GO:0006414 | Translational elongation |
| GO:0006412 | Translation |
| Gene ontology of translaction factor with evidence of Inferred from Direct Assay (IDA) from Entrez |
| Partner | Gene | GO ID | GO term | PubMed ID |
| Inferred gene age of translation factor. |
| Gene | Inferred gene age group among (0 - 67.6], (67.6 - 355.7], (355.7 - 733], (733 - 1119.25], >1119.25 |
| GTPBP2 | >1119.25 |
Top |
|
| We searched PubMed using 'GTPBP2[title] AND translation [title] AND human.' |
| Gene | Title | PMID |
| GTPBP2 | . | . |
Top |
|
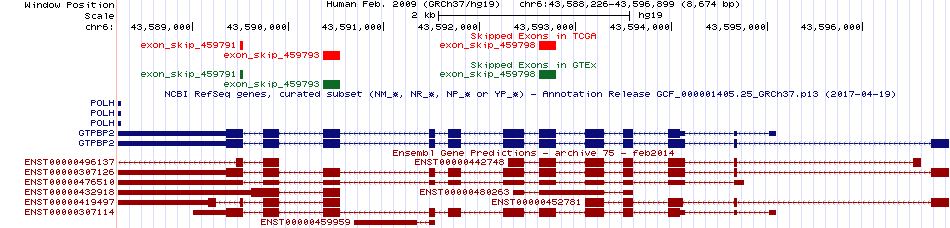
| Skipped exons in TCGA and GTEx based on Ensembl gene isoform structure. * Click on the image to open the UCSC genome browser with custom track showing this image in a new window. For more annotations, please visit our ExonSkipDB. |
 |
| Open reading frame (ORF) analsis of exon skipping events based on Ensembl gene isoform structure. * Click on the break point to see the gene structure around the break point region using the UCSC Genome Browser. |
| ENST | Exon skip start (DNA) | Exon Skip end (DNA) | ORF |
| ENST00000307126 | 43590369 | 43590541 | Frame-shift |
| ENST00000307126 | 43592624 | 43592799 | Frame-shift |
| Exon skipping position in the amino acid sequence. |
| ENST | Exon skip start (DNA) | Exon Skip end (DNA) | Len(transcript seq) | Exon skip start (mRNA) | Exon Skip end (mRNA) | Len(amino acid seq) | Exon skip start (AA) | Exon Skip end (AA) |
| Potentially (partially) lost protein functional features of UniProt. |
| UniProtAcc | Exon skip start (AA) | Exon Skip end (AA) | Function feature start (AA) | Function feature end (AA) | Functional feature type | Functional feature desc. |
Top |
|
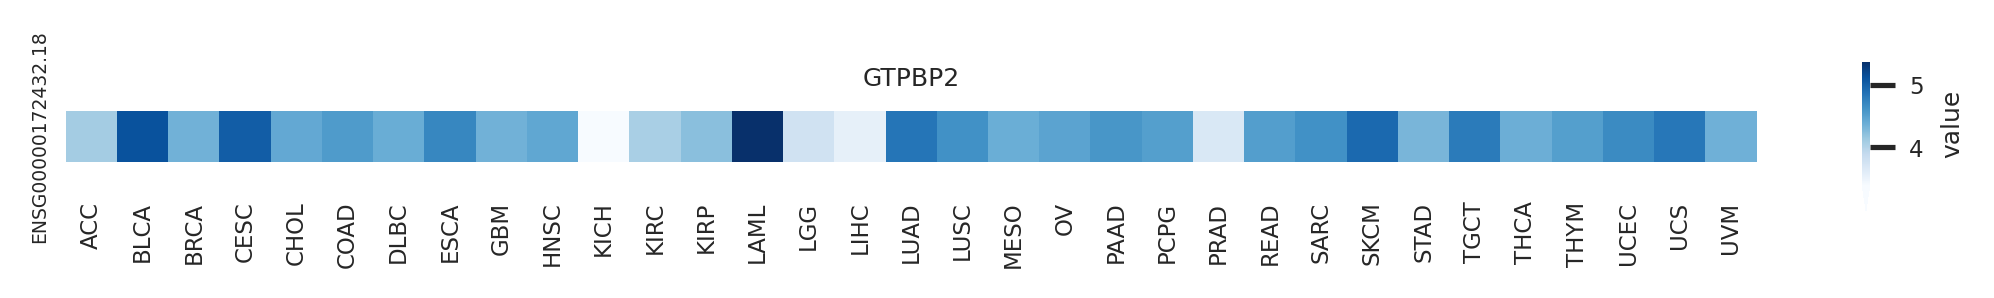
| Gene expression level across TCGA pancancer |
 |
| Gene expression level across GTEx pantissue |
 |
| Expression level of gene isoforms across TCGA pancancer |
 |
| Expression level of gene isoforms across GTEx pantissue |
 |
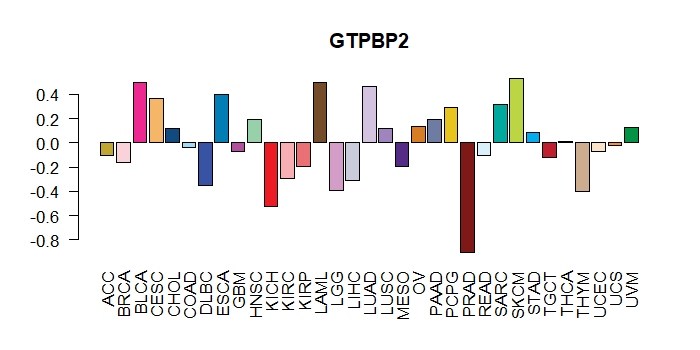
| Cancer(tissue) type-specific expression level of Translation factor using z-score distriution |
 |
| Differential expression between tumor and matched normal (in the cancer types with more than 10 matched samples) |
 |
| Cancer type | Translation factor | FC | adj.pval |
| HNSC | GTPBP2 | -1.53627803072923 | 0.0265030336049676 |
| LIHC | GTPBP2 | -1.41497815140044 | 1.03660595360911e-06 |
| KIRC | GTPBP2 | -1.3476028386786 | 1.44148329893084e-11 |
| KIRP | GTPBP2 | -2.13758174831216 | 6.37955963611603e-08 |
Top |
|
| Translation factor expression regulation through miRNA binding |
| Cancer type | Gene | miRNA | TargetScan binding score (Context++ score percentile) | Coefficient | Pvalue |
| Translation factor expression regulation through methylation in the promoter of Translation factor |
 |
| Cancer type | Gene | methyl group b | methyl group a | DEG pval | avg methyl in b | avg methyl in a | avg exp in b | avg exp in a |
| Translation factor expression regulation through methylation in the gene body of Translation factor (positive regulation) |
 |
| Cancer type | Gene | methyl group b | methyl group a | DEG pval | avg methyl in b | avg methyl in a | avg exp in b | avg exp in a |
| Translation factor expression regulation through copy number variation of Translation factor |
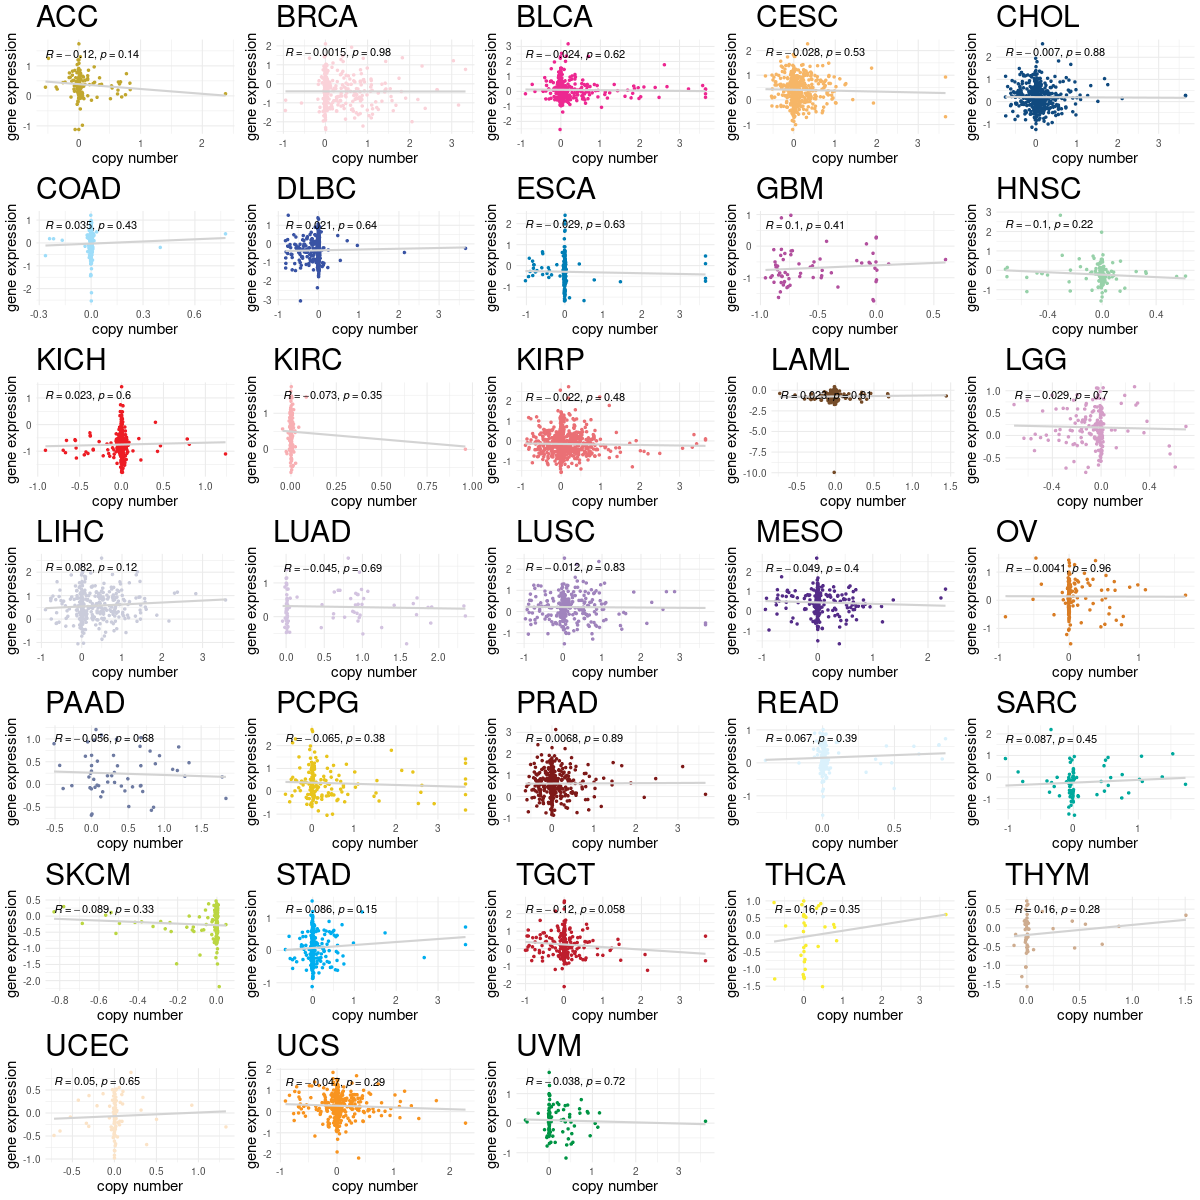 |
| Cancer type | Gene | Coefficient | Pvalue |
Top |
|
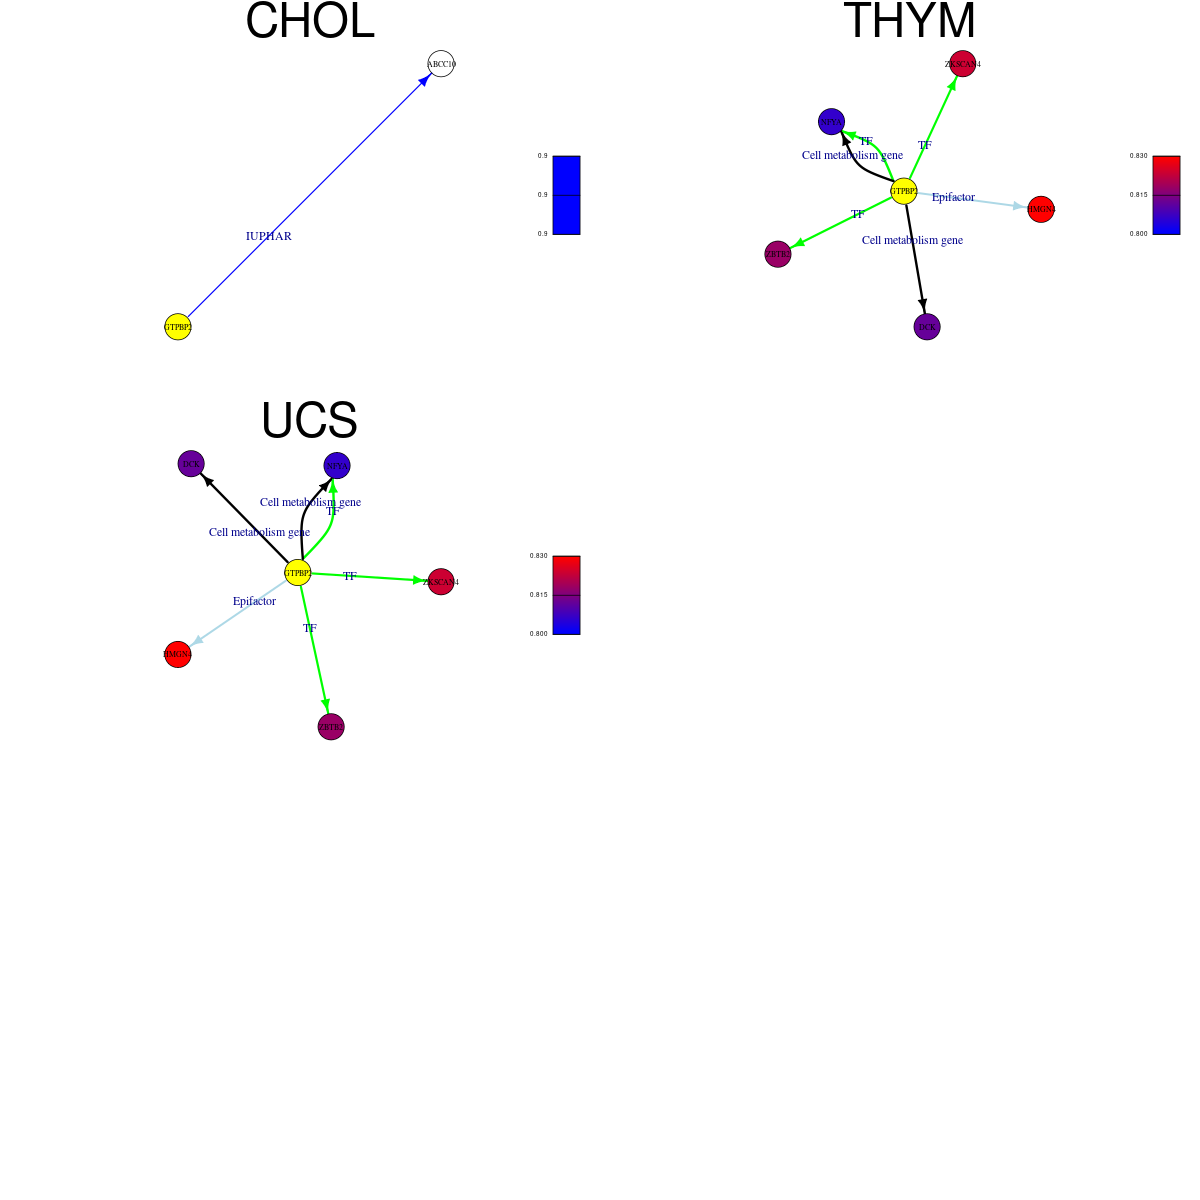
| Strongly correlated genes belong to cellular important gene groups with GTPBP2 (coefficient>0.8, pval<0.05, node color based on FC between tumor and matched normal). Significantly associated important genes in the individual cancer types. * Cell metabolism gene: cell metabolism genes from REACTOME (black edge), IUPHAR: drug target genes from IUPHAR (blue edge), Kinase: human kinase genes (brown edge), CGC: cancer gene census genes (orange edge), TSG: tumor suppresor genes (purple edge), Epifactor: epigenetic factors (light blue edge), TF: transcription factors (green) |
 |
| Cancer type | Gene group | Translation factor | Correlated gene | Coefficient | Pvalue |
| CHOL | IUPHAR | GTPBP2 | ABCC10 | 0.896171472 | 8.98E-17 |
| THYM | Cell metabolism gene | GTPBP2 | NFYA | 0.800419297 | 1.93E-28 |
| THYM | Cell metabolism gene | GTPBP2 | DCK | 0.801601039 | 1.40E-28 |
| THYM | Epifactor | GTPBP2 | HMGN4 | 0.831027405 | 2.35E-32 |
| THYM | TF | GTPBP2 | NFYA | 0.800419297 | 1.93E-28 |
| THYM | TF | GTPBP2 | ZBTB2 | 0.815521903 | 2.79E-30 |
| THYM | TF | GTPBP2 | ZKSCAN4 | 0.818748456 | 1.07E-30 |
| UCS | Cell metabolism gene | GTPBP2 | NFYA | 0.800419297 | 1.93E-28 |
| UCS | Cell metabolism gene | GTPBP2 | DCK | 0.801601039 | 1.40E-28 |
| UCS | Epifactor | GTPBP2 | HMGN4 | 0.831027405 | 2.35E-32 |
| UCS | TF | GTPBP2 | NFYA | 0.800419297 | 1.93E-28 |
| UCS | TF | GTPBP2 | ZBTB2 | 0.815521903 | 2.79E-30 |
| UCS | TF | GTPBP2 | ZKSCAN4 | 0.818748456 | 1.07E-30 |
Top |
|
| Protein 3D structure Visit iCn3D. |
Top |
|
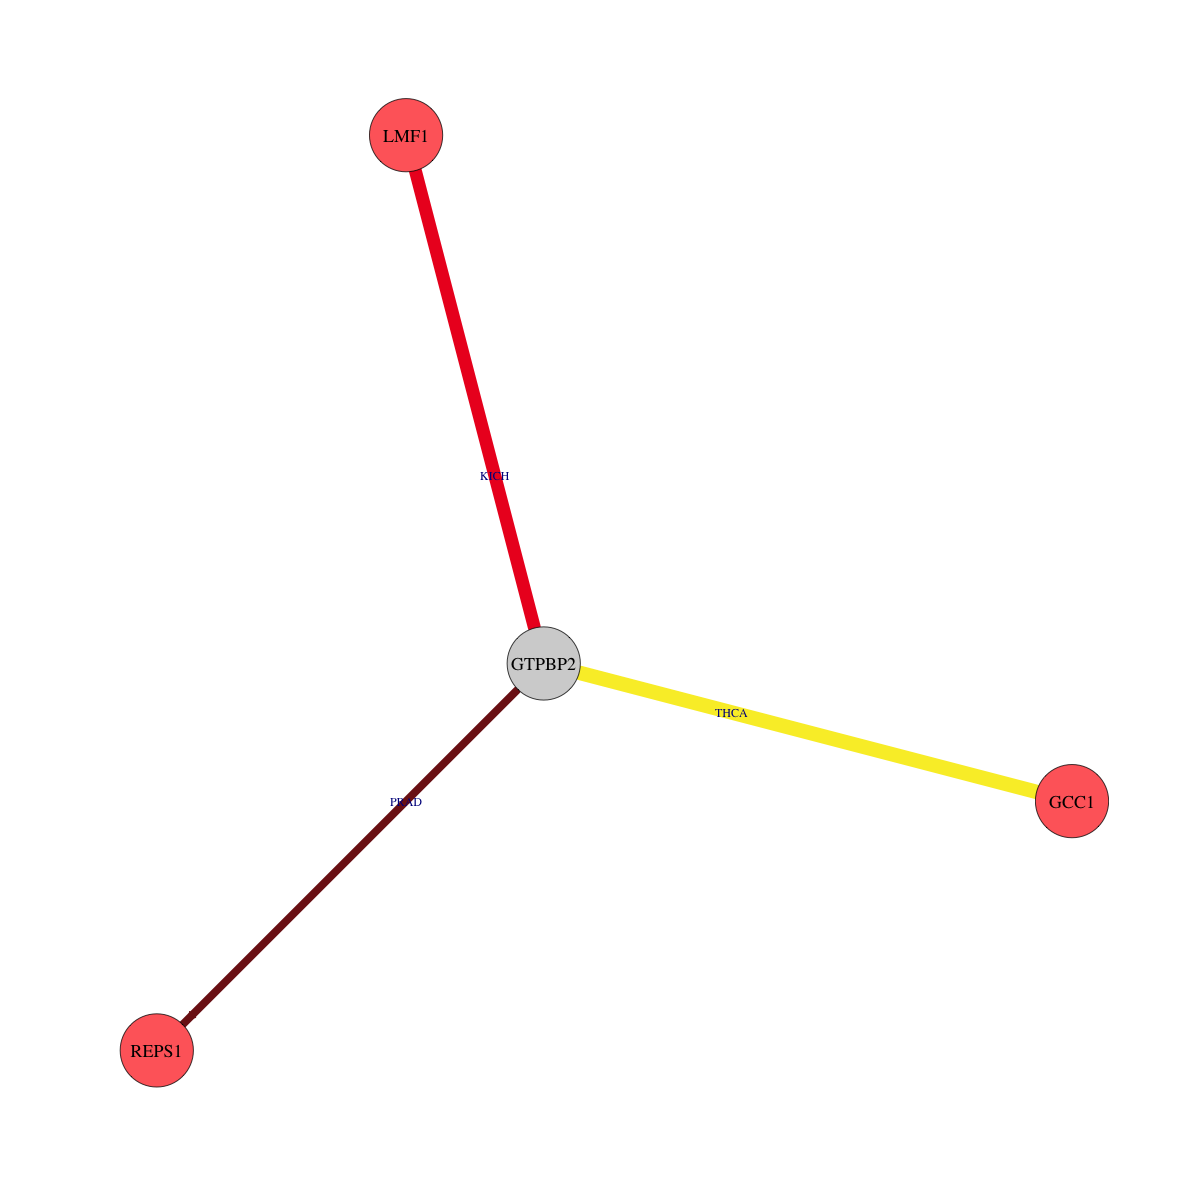
| Protein-protein interaction networks * Overlap between up-regulated DEGs (log2FC<-1 and adj.P<0.05) and STRING PPI network (center: Translation factor, node: DEGs, edges: weighted by -log2(adj.P)) |
 |
| Overlap between down-regulated DEGs (log2FC>1 and adj.P<0.05) and STRING PPI network (center: Translation factor, node: DEGs, edges: weighted by -log2(adj.P)) |
 |
 * Edge colors based on TCGA cancer types. |
| * Overlap between DEGs (log2FC>1 and adj.P<0.05) and STRING PPI network per cancer (center: Translation factor, node: DEGs, node color: log2FC, edges: weighted by -log2(adj.P)) |
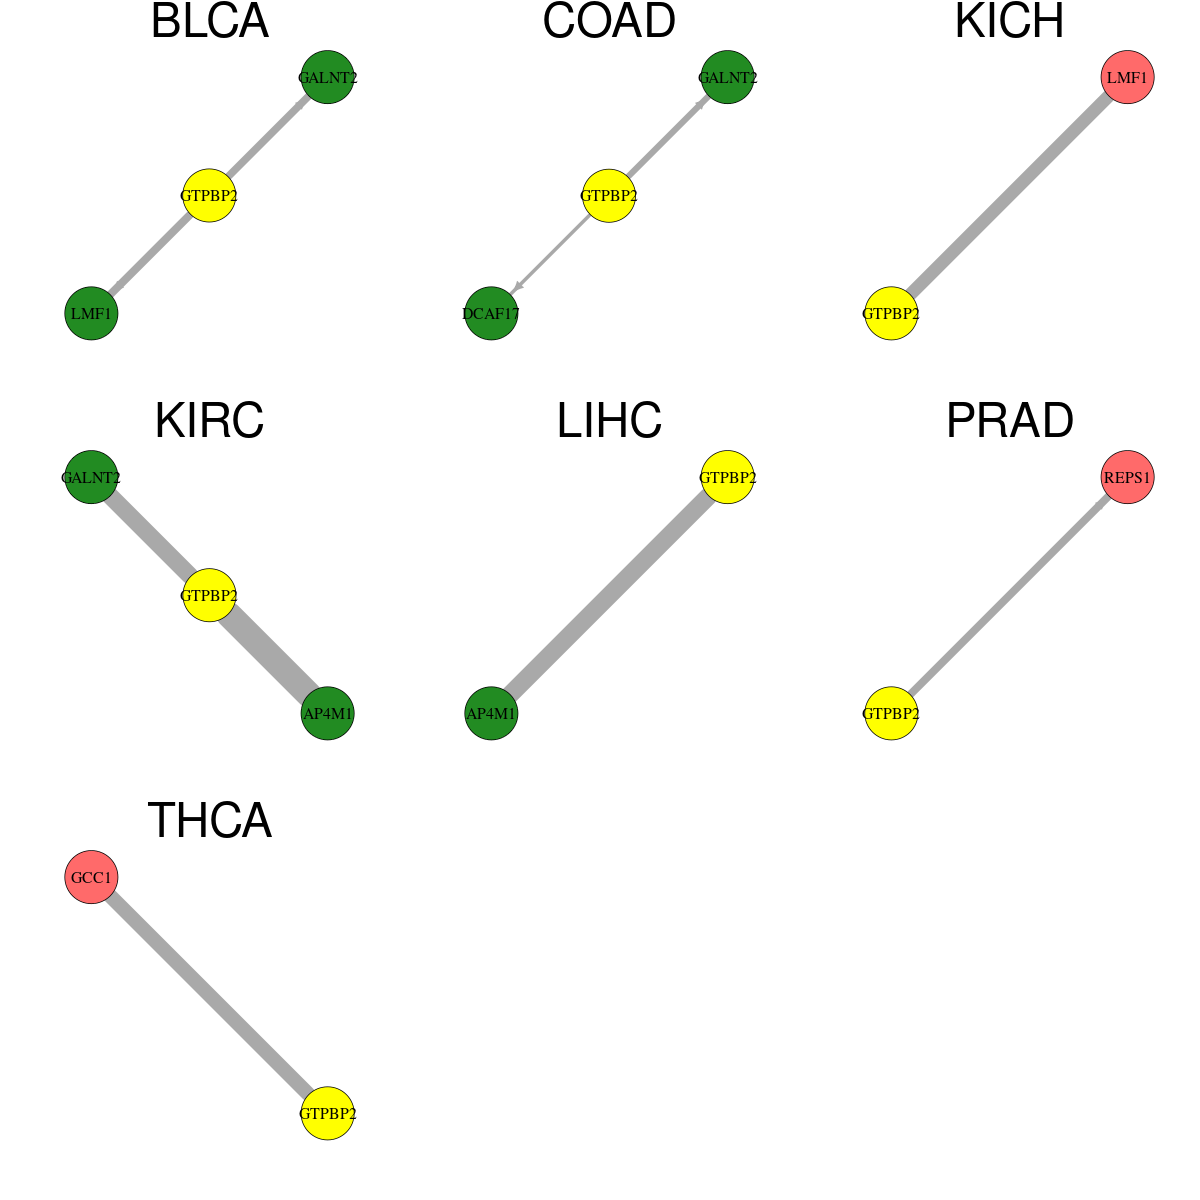 |
| Cancer type | Translation factor | Interacting protein coding gene | FC | adj.pval |
| BLCA | GTPBP2 | LMF1 | -1.01423777162108 | 0.000644683837890625 |
| PRAD | GTPBP2 | REPS1 | 1.60056286392539 | 0.000716413334112081 |
| BLCA | GTPBP2 | GALNT2 | -3.64046800438208 | 0.000965118408203125 |
| COAD | GTPBP2 | GALNT2 | -2.59898345741163 | 0.00322914123535157 |
| COAD | GTPBP2 | DCAF17 | -2.65458454517734 | 0.0381683111190796 |
| KIRC | GTPBP2 | GALNT2 | -2.09650742400863 | 1.19255796894673e-07 |
| THCA | GTPBP2 | GCC1 | 1.83289969742393 | 1.4955103645527e-06 |
| KIRC | GTPBP2 | AP4M1 | -2.78729174318103 | 5.0828992913156e-11 |
| KICH | GTPBP2 | LMF1 | 3.43472596618245 | 6.55651092529297e-06 |
| LIHC | GTPBP2 | AP4M1 | -1.01080418639238 | 6.80736010554701e-08 |
| Protein-protein interactors with this translation factor (BIOGRID-3.4.160) |
| PPI interactors with GTPBP2 |
| IRF5, KDM1A, PRMT5, PRMT6, SUV39H1, DCP2, IFI30, HNRNPU, POLH, RPL10, RAB11A, Junb, Rpl35, Mus81, Rrbp1, GRAMD1B, RNASE3, UBE3D, PMEL, MUC20, CHRM3, PROSER2, IGFBP1, PLEKHO1, IQCF1, PSMB1, PICK1, TXN2, SNRNP70, GPN3, NXF1, GTPBP2, PLEKHF2, CLK2, CUL9, CUL7, PLEKHA4, BRPF3, TRIM66, FASN, LDLR, DDX58, DNAJC12, ZNF467, GPIHBP1, RBMS2, ZNF48, LMNB2, OC90, RPL4, IGFL3, HNRNPCL2, |
Top |
|
| Clinically associated variants from ClinVar. |
| Gene | Chr | Position | RefSeq | VarSeq | RefSeeq | VarType | Pathogenic | Disease | VarInfo |
| nsSNVs with sample frequency (size of circle) from TCGA 33 cancers. |
 |
| SNVs and Indels |
| Gene | Cancer type | Chromosome | Start | End | RefSeeq | MutSeq | Mutation type | AAchange | # samples |
| GTPBP2 | BLCA | chr6 | 43589395 | 43589395 | G | T | Missense_Mutation | 6 | |
| GTPBP2 | KIRC | chr6 | 43592392 | 43592392 | C | T | Missense_Mutation | p.D319N | 5 |
| GTPBP2 | BLCA | chr6 | 43593965 | 43593965 | C | G | Missense_Mutation | p.E132D | 4 |
| GTPBP2 | LIHC | chr6 | 43596730 | 43596730 | G | - | Frame_Shift_Del | p.P57fs | 4 |
| GTPBP2 | LIHC | chr6 | 43590408 | 43590408 | G | A | Silent | 4 | |
| GTPBP2 | ACC | chr6 | 43592287 | 43592287 | C | T | Missense_Mutation | p.D354N | 3 |
| GTPBP2 | BRCA | chr6 | 43593250 | 43593250 | C | G | Missense_Mutation | p.K185N | 3 |
| GTPBP2 | ESCA | chr6 | 43593283 | 43593283 | A | G | Silent | 2 | |
| GTPBP2 | KIRC | chr6 | 43592645 | 43592645 | A | T | Missense_Mutation | p.V287D | 2 |
| GTPBP2 | STAD | chr6 | 43592356 | 43592356 | G | A | Missense_Mutation | 2 | |
| GTPBP2 | BLCA | chr6 | 43592647 | 43592647 | G | A | Silent | p.L286L | 2 |
| GTPBP2 | UCEC | chr6 | 43589779 | 43589779 | G | A | Silent | p.R100C | 2 |
| GTPBP2 | UCEC | chr6 | 43590428 | 43590428 | C | T | Missense_Mutation | p.R470Q | 2 |
| GTPBP2 | SKCM | chr6 | 43592649 | 43592649 | G | A | Missense_Mutation | p.L286F | 2 |
| GTPBP2 | STAD | chr6 | 43592356 | 43592356 | G | A | Missense_Mutation | p.R331C | 2 |
| GTPBP2 | ESCA | chr6 | 43593283 | 43593283 | A | G | Silent | p.R174R | 2 |
| GTPBP2 | CESC | chr6 | 43591721 | 43591721 | G | A | Silent | 2 | |
| GTPBP2 | UCEC | chr6 | 43592647 | 43592647 | G | A | Silent | p.S252L | 2 |
| GTPBP2 | ESCA | chr6 | 43588291 | 43588292 | TA | - | RNA | NULL | 2 |
| GTPBP2 | SKCM | chr6 | 43590398 | 43590398 | C | T | Missense_Mutation | p.G480E | 2 |
| GTPBP2 | STAD | chr6 | 43592340 | 43592340 | A | G | Missense_Mutation | p.V336A | 2 |
| GTPBP2 | CESC | chr6 | 43591477 | 43591477 | G | C | Missense_Mutation | 2 | |
| GTPBP2 | UCEC | chr6 | 43594046 | 43594046 | C | T | Silent | p.G71E | 2 |
| GTPBP2 | SKCM | chr6 | 43590399 | 43590399 | C | T | Missense_Mutation | p.G480R | 2 |
| GTPBP2 | STAD | chr6 | 43589437 | 43589437 | G | A | Missense_Mutation | p.R575W | 2 |
| GTPBP2 | BLCA | chr6 | 43593155 | 43593155 | G | A | Missense_Mutation | p.S217F | 2 |
| GTPBP2 | CESC | chr6 | 43592282 | 43592282 | G | A | Silent | 2 | |
| GTPBP2 | LUAD | chr6 | 43592282 | 43592282 | G | A | Silent | p.A355A | 2 |
| GTPBP2 | UCEC | chr6 | 43594060 | 43594060 | C | T | Splice_Site | e1+1 | 2 |
| GTPBP2 | SKCM | chr6 | 43589866 | 43589866 | G | A | Silent | p.I502I | 2 |
| GTPBP2 | BLCA | chr6 | 43591732 | 43591732 | G | T | Missense_Mutation | p.L392M | 2 |
| GTPBP2 | CESC | chr6 | 43591477 | 43591477 | G | C | Missense_Mutation | p.S431C | 2 |
| GTPBP2 | HNSC | chr6 | 43590532 | 43590532 | G | A | Silent | p.C435C | 2 |
| GTPBP2 | ESCA | chr6 | 43589849 | 43589849 | G | T | Missense_Mutation | p.A508E | 2 |
| GTPBP2 | BLCA | chr6 | 43593257 | 43593257 | G | C | Missense_Mutation | 1 | |
| GTPBP2 | SKCM | chr6 | 43591732 | 43591732 | G | A | Silent | p.L392L | 1 |
| GTPBP2 | BLCA | chr6 | 43589377 | 43589377 | C | T | Missense_Mutation | p.E595K | 1 |
| GTPBP2 | LIHC | chr6 | 43591796 | 43591796 | G | - | Frame_Shift_Del | p.P370fs | 1 |
| GTPBP2 | UCEC | chr6 | 43594046 | 43594046 | C | T | Silent | p.G105G | 1 |
| GTPBP2 | CESC | chr6 | 43588571 | 43588571 | G | C | RNA | NULL | 1 |
| GTPBP2 | READ | chr6 | 43593130 | 43593130 | G | A | Silent | p.F225F | 1 |
| GTPBP2 | BLCA | chr6 | 43589377 | 43589377 | C | T | Missense_Mutation | 1 | |
| GTPBP2 | ESCA | chr6 | 43596716 | 43596717 | - | - | Frame_Shift_Ins | 1 | |
| GTPBP2 | SKCM | chr6 | 43596721 | 43596721 | G | A | Missense_Mutation | p.P60L | 1 |
| GTPBP2 | BLCA | chr6 | 43592644 | 43592644 | G | A | Silent | p.V287V | 1 |
| GTPBP2 | KIRC | chr6 | 43592732 | 43592732 | A | T | Missense_Mutation | p.F258Y | 1 |
| GTPBP2 | LIHC | chr6 | 43596786 | 43596786 | C | - | Frame_Shift_Del | p.G38fs | 1 |
| GTPBP2 | UCEC | chr6 | 43594060 | 43594060 | C | T | Missense_Mutation | p.V101I | 1 |
| GTPBP2 | CESC | chr6 | 43591721 | 43591721 | G | A | Silent | p.L395 | 1 |
| GTPBP2 | SARC | chr6 | 43592462 | 43592462 | G | T | Silent | 1 | |
| GTPBP2 | BLCA | chr6 | 43592644 | 43592644 | G | A | Silent | 1 | |
| GTPBP2 | ESCA | chr6 | 43596716 | 43596717 | - | G | Frame_Shift_Ins | p.E62fs | 1 |
| GTPBP2 | KIRP | chr6 | 43593600 | 43593600 | C | A | Missense_Mutation | p.V134F | 1 |
| GTPBP2 | LIHC | chr6 | 43589488 | 43589488 | G | - | Frame_Shift_Del | p.R558fs | 1 |
| GTPBP2 | COAD | chr6 | 43589787 | 43589787 | C | T | Missense_Mutation | p.V529M | 1 |
| GTPBP2 | SARC | chr6 | 43594141 | 43594141 | G | T | Missense_Mutation | 1 | |
| GTPBP2 | STAD | chr6 | 43593576 | 43593576 | G | A | Nonsense_Mutation | p.R142X | 1 |
| GTPBP2 | BLCA | chr6 | 43592647 | 43592647 | G | A | Silent | 1 | |
| GTPBP2 | ESCA | chr6 | 43593129 | 43593129 | C | G | Missense_Mutation | p.E226Q | 1 |
| GTPBP2 | KIRP | chr6 | 43589884 | 43589884 | C | A | Silent | 1 | |
| GTPBP2 | LIHC | chr6 | 43589783 | 43589783 | C | - | Frame_Shift_Del | p.G530fs | 1 |
| GTPBP2 | BLCA | chr6 | 43596784 | 43596784 | G | A | Missense_Mutation | 1 | |
| GTPBP2 | COAD | chr6 | 43596717 | 43596717 | G | - | Frame_Shift_Del | p.E62fs | 1 |
| GTPBP2 | BLCA | chr6 | 43596784 | 43596784 | G | A | Missense_Mutation | p.P39L | 1 |
| GTPBP2 | LGG | chr6 | 43590374 | 43590374 | C | T | Missense_Mutation | p.R488H | 1 |
| GTPBP2 | LUAD | chr6 | 43593175 | 43593175 | G | A | Silent | p.R210R | 1 |
| GTPBP2 | BLCA | chr6 | 43593965 | 43593965 | C | G | Missense_Mutation | 1 | |
| GTPBP2 | ESCA | chr6 | 43596716 | 43596717 | - | G | Frame_Shift_Ins | p.G62fs | 1 |
| GTPBP2 | LGG | chr6 | 43589768 | 43589768 | G | A | Missense_Mutation | p.T535M | 1 |
| GTPBP2 | LUAD | chr6 | 43589437 | 43589437 | G | T | Silent | p.R575R | 1 |
| GTPBP2 | BLCA | chr6 | 43593155 | 43593155 | G | A | Missense_Mutation | 1 | |
| GTPBP2 | ESCA | chr6 | 43588627 | 43588627 | T | C | RNA | NULL | 1 |
| GTPBP2 | LIHC | chr6 | 43594011 | 43594011 | T | C | Missense_Mutation | 1 | |
| GTPBP2 | ESCA | chr6 | 43589723 | 43589723 | G | A | Missense_Mutation | 1 | |
| GTPBP2 | LGG | chr6 | 43589883 | 43589883 | C | T | Missense_Mutation | p.E497K | 1 |
| GTPBP2 | BLCA | chr6 | 43591732 | 43591732 | G | T | Missense_Mutation | 1 | |
| GTPBP2 | ESCA | chr6 | 43588707 | 43588707 | G | A | RNA | NULL | 1 |
| GTPBP2 | LIHC | chr6 | 43593198 | 43593198 | G | A | Missense_Mutation | p.R203W | 1 |
| GTPBP2 | STAD | chr6 | 43589374 | 43589376 | CTT | - | In_Frame_Del | p.595_596del | 1 |
| GTPBP2 | GBM | chr6 | 43592727 | 43592727 | C | T | Missense_Mutation | 1 | |
| GTPBP2 | CESC | chr6 | 43591721 | 43591721 | G | A | Silent | p.L395L | 1 |
| GTPBP2 | LGG | chr6 | 43589883 | 43589883 | C | T | Missense_Mutation | 1 | |
| GTPBP2 | LUAD | chr6 | 43591806 | 43591806 | C | T | Splice_Site | 1 | |
| GTPBP2 | BLCA | chr6 | 43589890 | 43589890 | C | T | Silent | 1 | |
| GTPBP2 | ESCA | chr6 | 43594099 | 43594099 | G | A | Nonsense_Mutation | p.Q88* | 1 |
| GTPBP2 | SKCM | chr6 | 43589882 | 43589882 | T | G | Missense_Mutation | p.E497A | 1 |
| GTPBP2 | LIHC | chr6 | 43592642 | 43592642 | C | A | Missense_Mutation | p.S288I | 1 |
| GTPBP2 | STAD | chr6 | 43593576 | 43593576 | G | A | Nonsense_Mutation | p.R142* | 1 |
| GTPBP2 | BLCA | chr6 | 43589890 | 43589890 | C | T | Silent | p.V494V | 1 |
| GTPBP2 | HNSC | chr6 | 43588006 | 43588006 | A | - | RNA | 1 | |
| GTPBP2 | LGG | chr6 | 43590374 | 43590374 | C | T | Missense_Mutation | 1 | |
| GTPBP2 | LUSC | chr6 | 43592737 | 43592737 | G | A | Silent | p.I256I | 1 |
| GTPBP2 | ESCA | chr6 | 43596716 | 43596717 | - | G | Frame_Shift_Ins | p.E61fs | 1 |
| GTPBP2 | SKCM | chr6 | 43593277 | 43593277 | G | A | Silent | p.A176A | 1 |
| GTPBP2 | LIHC | chr6 | 43593599 | 43593600 | - | C | Frame_Shift_Ins | p.W134fs | 1 |
| GTPBP2 | STAD | chr6 | 43589374 | 43589376 | CTT | - | In_Frame_Del | p.595_596EA>D | 1 |
| GTPBP2 | BLCA | chr6 | 43594085 | 43594085 | C | T | Silent | p.R92R | 1 |
| GTPBP2 | CESC | chr6 | 43592414 | 43592414 | G | G | Missense_Mutation | 1 | |
| GTPBP2 | LIHC | chr6 | 43594137 | 43594137 | A | G | Missense_Mutation | 1 | |
| GTPBP2 | PAAD | chr6 | 43593543 | 43593543 | G | A | Missense_Mutation | p.P153S | 1 |
| GTPBP2 | BLCA | chr6 | 43594085 | 43594085 | C | T | Silent | 1 | |
| GTPBP2 | SKCM | chr6 | 43592393 | 43592393 | G | A | Silent | p.I318I | 1 |
| GTPBP2 | STAD | chr6 | 43593576 | 43593576 | G | A | Nonsense_Mutation | 1 | |
| GTPBP2 | BLCA | chr6 | 43593257 | 43593257 | G | C | Missense_Mutation | p.S183C | 1 |
| GTPBP2 | CESC | chr6 | 43596854 | 43596854 | C | A | Nonsense_Mutation | p.G16* | 1 |
| GTPBP2 | PCPG | chr6 | 43589788 | 43589788 | G | A | Silent | 1 |
| Copy number variation (CNV) of GTPBP2 * Click on the image to open the original image in a new window. |
 |
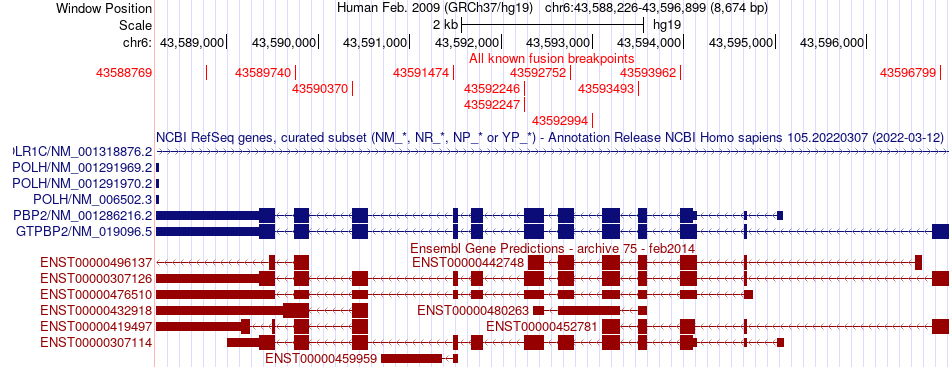
| Fusion gene breakpoints (product of the structural variants (SVs)) across GTPBP2 * Click on the image to open the UCSC genome browser with custom track showing this image in a new window. |
 |
| Fusion genes with this translation factor from FusionGDB2.0. |
| FusionGDB2 ID | Disease | Sample | Hgene | Hchr | Hbp | Hstrand | Tgene | Tchr | Tbp | Tstrand |
| 83836 | N/A | BQ327509 | GTPBP2 | chr6 | 43592752 | + | GTPBP2 | chr6 | 43588769 | + |
| 35311 | BRCA | TCGA-A8-A07J-01A | GTPBP2 | chr6 | 43589740 | - | HIST1H2BJ | chr6 | 27094241 | - |
| 67661 | STAD | TCGA-BR-8486 | GTPBP2 | chr6 | 43592246 | - | POLH | chr6 | 43571628 | + |
| 67661 | STAD | TCGA-BR-8486-01A | GTPBP2 | chr6 | 43592247 | - | POLH | chr6 | 43571629 | + |
| 35311 | Non-Cancer | TCGA-BR-8060-11A | GTPBP2 | chr6 | 43593962 | - | PRICKLE4 | chr6 | 41751868 | + |
| 98036 | STAD | TCGA-BR-8486-01A | GTPBP2 | chr6 | 43590370 | - | RSPH9 | chr6 | 43638526 | + |
| 98036 | STAD | TCGA-BR-8486-01A | GTPBP2 | chr6 | 43591474 | - | RSPH9 | chr6 | 43638526 | + |
| 100602 | SKCM | TCGA-EE-A2MR-06A | GTPBP2 | chr6 | 43593493 | - | USP49 | chr6 | 41766667 | - |
| 102169 | OV | TCGA-29-1778 | GTPBP2 | chr6 | 43592246 | - | VEGFA | chr6 | 43752277 | + |
| 102169 | OV | TCGA-29-1778-01A | GTPBP2 | chr6 | 43592247 | - | VEGFA | chr6 | 43752278 | + |
| 83836 | HNSC | TCGA-MT-A67A | KRT14 | chr17 | 39740509 | - | GTPBP2 | chr6 | 43592994 | - |
| 83841 | N/A | DB445779 | SMAGP | chr12 | 51663905 | - | GTPBP2 | chr6 | 43596799 | - |
Top |
|
| Kaplan-Meier plots with logrank tests of overall survival (OS) |
 |
| Cancer type | Translation factor | Coefficent | Hazard ratio | Wald test pval | Likelihool ratio pval | Logrank test pval | # samples |
Top |
|
| Differential gene expression between female and male. (Wilcoxon test, pval<0.05) |
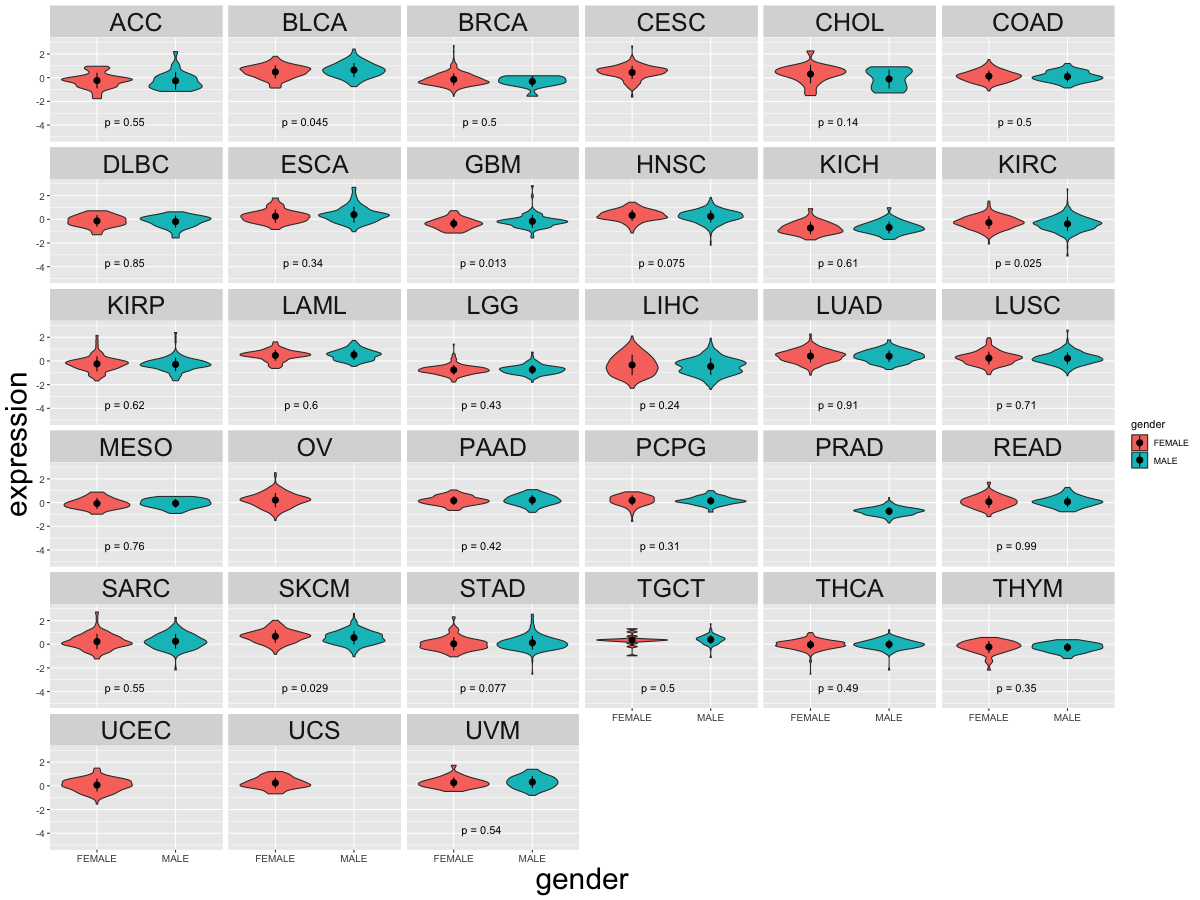 |
| Cancer type | Translation factor | pval | adj.p |
| GBM | GTPBP2 | 0.0129410726721108 | 0.36 |
| KIRC | GTPBP2 | 0.0254032347859674 | 0.69 |
| SKCM | GTPBP2 | 0.028852408270065 | 0.75 |
| BLCA | GTPBP2 | 0.0408102833015935 | 1 |
Top |
|
| Differential gene expression between young and old age groups (Wilcoxon test, pval<0.05) |
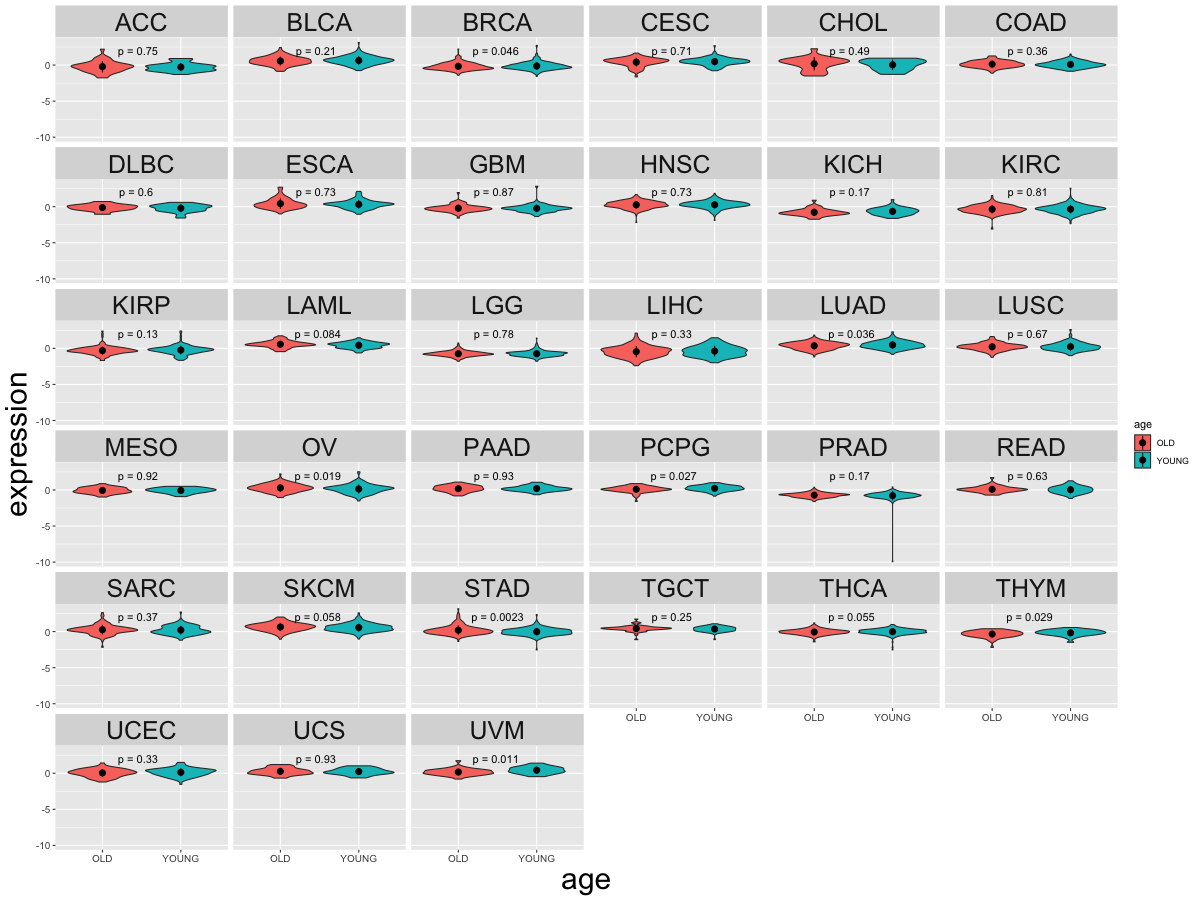 |
| Cancer type | Translation factor | pval | adj.p |
| STAD | GTPBP2 | 0.0022726718988551 | 0.075 |
| LUAD | GTPBP2 | 0.0361398809521637 | 1 |
| BRCA | GTPBP2 | 0.0455381012552555 | 1 |
| UVM | GTPBP2 | 0.0106888618474183 | 0.34 |
| OV | GTPBP2 | 0.0194988187515671 | 0.6 |
| PCPG | GTPBP2 | 0.0265352787733013 | 0.8 |
| THYM | GTPBP2 | 0.029265026131154 | 0.85 |
Top |
|
| Drugs targeting genes involved in this translation factor. (DrugBank Version 5.1.8 2021-05-08) |
| UniProtAcc | DrugBank ID | Drug name | Drug activity | Drug type | Drug status |
Top |
|
| Diseases associated with this translation factor. (DisGeNet 4.0) |
| Disease ID | Disease Name | # PubMeds | Disease source |
| C0008370 | Cholestasis | 1 | CTD_human |
| C0557874 | Global developmental delay | 1 | GENOMICS_ENGLAND |
| C4693848 | JABERI-ELAHI SYNDROME | 1 | GENOMICS_ENGLAND |
(UTHealth)
Web File Viewing | Emergency Information |Campus Carry|Site Policies