
|
||||||
|

Translation Factor: EIF5A2 (NCBI Gene ID:56648) |
|
 Gene Summary Gene Summary |
| Gene Information | Gene Name: EIF5A2 | Gene ID: 56648 | Gene Symbol | EIF5A2 | Gene ID | 56648 |
| Gene Name | eukaryotic translation initiation factor 5A2 | |
| Synonyms | EIF-5A2|eIF5AII | |
| Cytomap | 3q26.2 | |
| Type of Gene | protein-coding | |
| Description | eukaryotic translation initiation factor 5A-2eIF-5A-2eukaryotic initiation factor 5A | |
| Modification date | 20200313 | |
| UniProtAcc | Q9GZV4 | |
| Child GO biological process term(s) under GO:0006412 |
| GO ID | GO term |
| GO:0006417 | Regulation of translation |
| GO:0006415 | Translational termination |
| GO:0008135 | Translation factor activity, RNA binding |
| GO:0045727 | Positive regulation of translation |
| GO:0006414 | Translational elongation |
| GO:0006412 | Translation |
| Gene ontology of translaction factor with evidence of Inferred from Direct Assay (IDA) from Entrez |
| Partner | Gene | GO ID | GO term | PubMed ID |
| Inferred gene age of translation factor. |
| Gene | Inferred gene age group among (0 - 67.6], (67.6 - 355.7], (355.7 - 733], (733 - 1119.25], >1119.25 |
| EIF5A2 | >1119.25 |
Top |
|
| We searched PubMed using 'EIF5A2[title] AND translation [title] AND human.' |
| Gene | Title | PMID |
| EIF5A2 | Expression of eukaryotic translation initiation factor 5A-2 (eIF5A-2) associated with poor survival in gastric cancer | 26282002 |
Top |
|
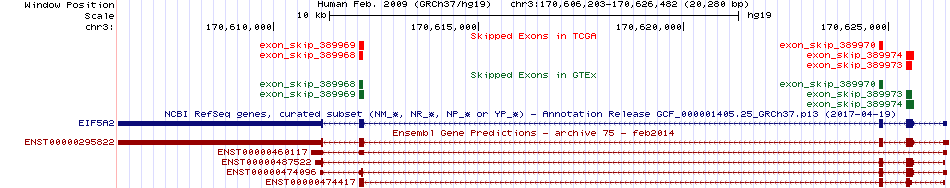
| Skipped exons in TCGA and GTEx based on Ensembl gene isoform structure. * Click on the image to open the UCSC genome browser with custom track showing this image in a new window. For more annotations, please visit our ExonSkipDB. |
 |
| Open reading frame (ORF) analsis of exon skipping events based on Ensembl gene isoform structure. * Click on the break point to see the gene structure around the break point region using the UCSC Genome Browser. |
| ENST | Exon skip start (DNA) | Exon Skip end (DNA) | ORF |
| ENST00000295822 | 170612080 | 170612212 | In-frame |
| ENST00000295822 | 170624777 | 170624882 | In-frame |
| Exon skipping position in the amino acid sequence. |
| ENST | Exon skip start (DNA) | Exon Skip end (DNA) | Len(transcript seq) | Exon skip start (mRNA) | Exon Skip end (mRNA) | Len(amino acid seq) | Exon skip start (AA) | Exon Skip end (AA) |
| ENST00000295822 | 170612080 | 170612212 | 5610 | 457 | 588 | 153 | 90 | 134 |
| ENST00000295822 | 170624777 | 170624882 | 5610 | 352 | 456 | 153 | 55 | 90 |
| Potentially (partially) lost protein functional features of UniProt. |
| UniProtAcc | Exon skip start (AA) | Exon Skip end (AA) | Function feature start (AA) | Function feature end (AA) | Functional feature type | Functional feature desc. |
| Q9GZV4 | 55 | 90 | 2 | 153 | Chain | ID=PRO_0000229764;Note=Eukaryotic translation initiation factor 5A-2 |
| Q9GZV4 | 90 | 134 | 2 | 153 | Chain | ID=PRO_0000229764;Note=Eukaryotic translation initiation factor 5A-2 |
Top |
|
| Gene expression level across TCGA pancancer |
 |
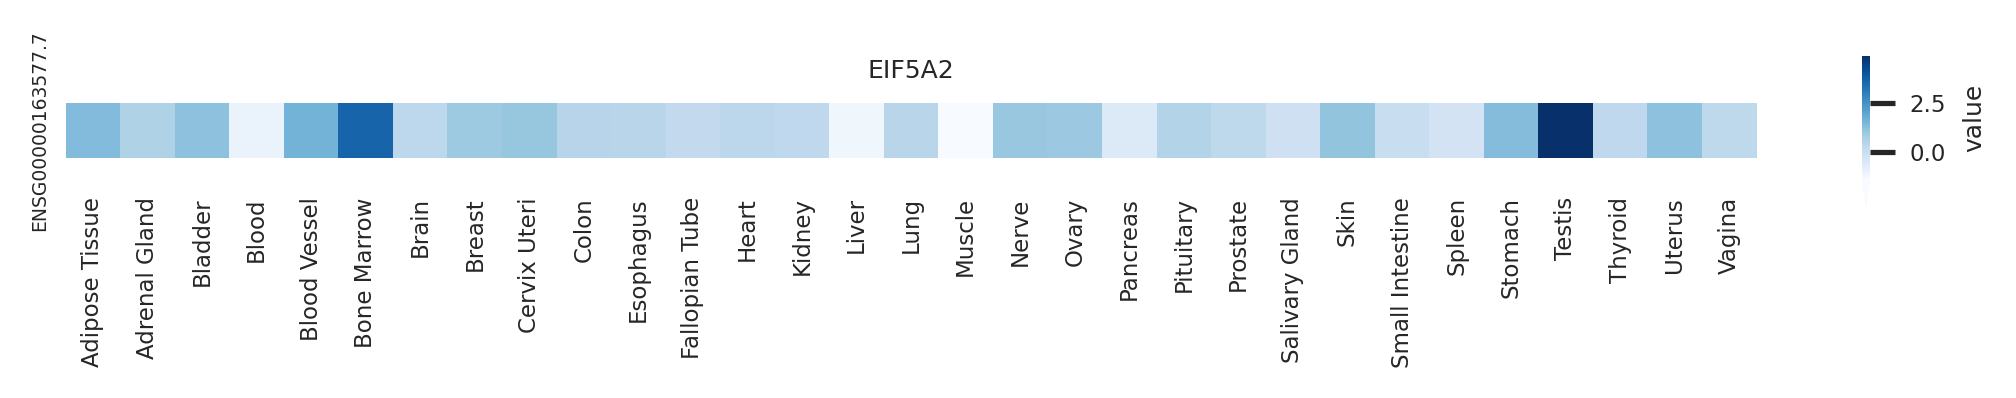
| Gene expression level across GTEx pantissue |
 |
| Expression level of gene isoforms across TCGA pancancer |
 |
| Expression level of gene isoforms across GTEx pantissue |
 |
| Cancer(tissue) type-specific expression level of Translation factor using z-score distriution |
 |
| Differential expression between tumor and matched normal (in the cancer types with more than 10 matched samples) |
 |
| Cancer type | Translation factor | FC | adj.pval |
| PRAD | EIF5A2 | 1.76773292297344 | 0.00192930085721699 |
| KICH | EIF5A2 | 2.29158986097535 | 0.00507164001464844 |
| LUAD | EIF5A2 | -2.4963976518052 | 0.00773628245812536 |
| THCA | EIF5A2 | 1.86994054726467 | 1.93116089157046e-10 |
Top |
|
| Translation factor expression regulation through miRNA binding |
| Cancer type | Gene | miRNA | TargetScan binding score (Context++ score percentile) | Coefficient | Pvalue |
| TGCT | EIF5A2 | hsa-miR-92b-3p | 93 | 0.301363193768257 | 0.00715399203718028 |
| Translation factor expression regulation through methylation in the promoter of Translation factor |
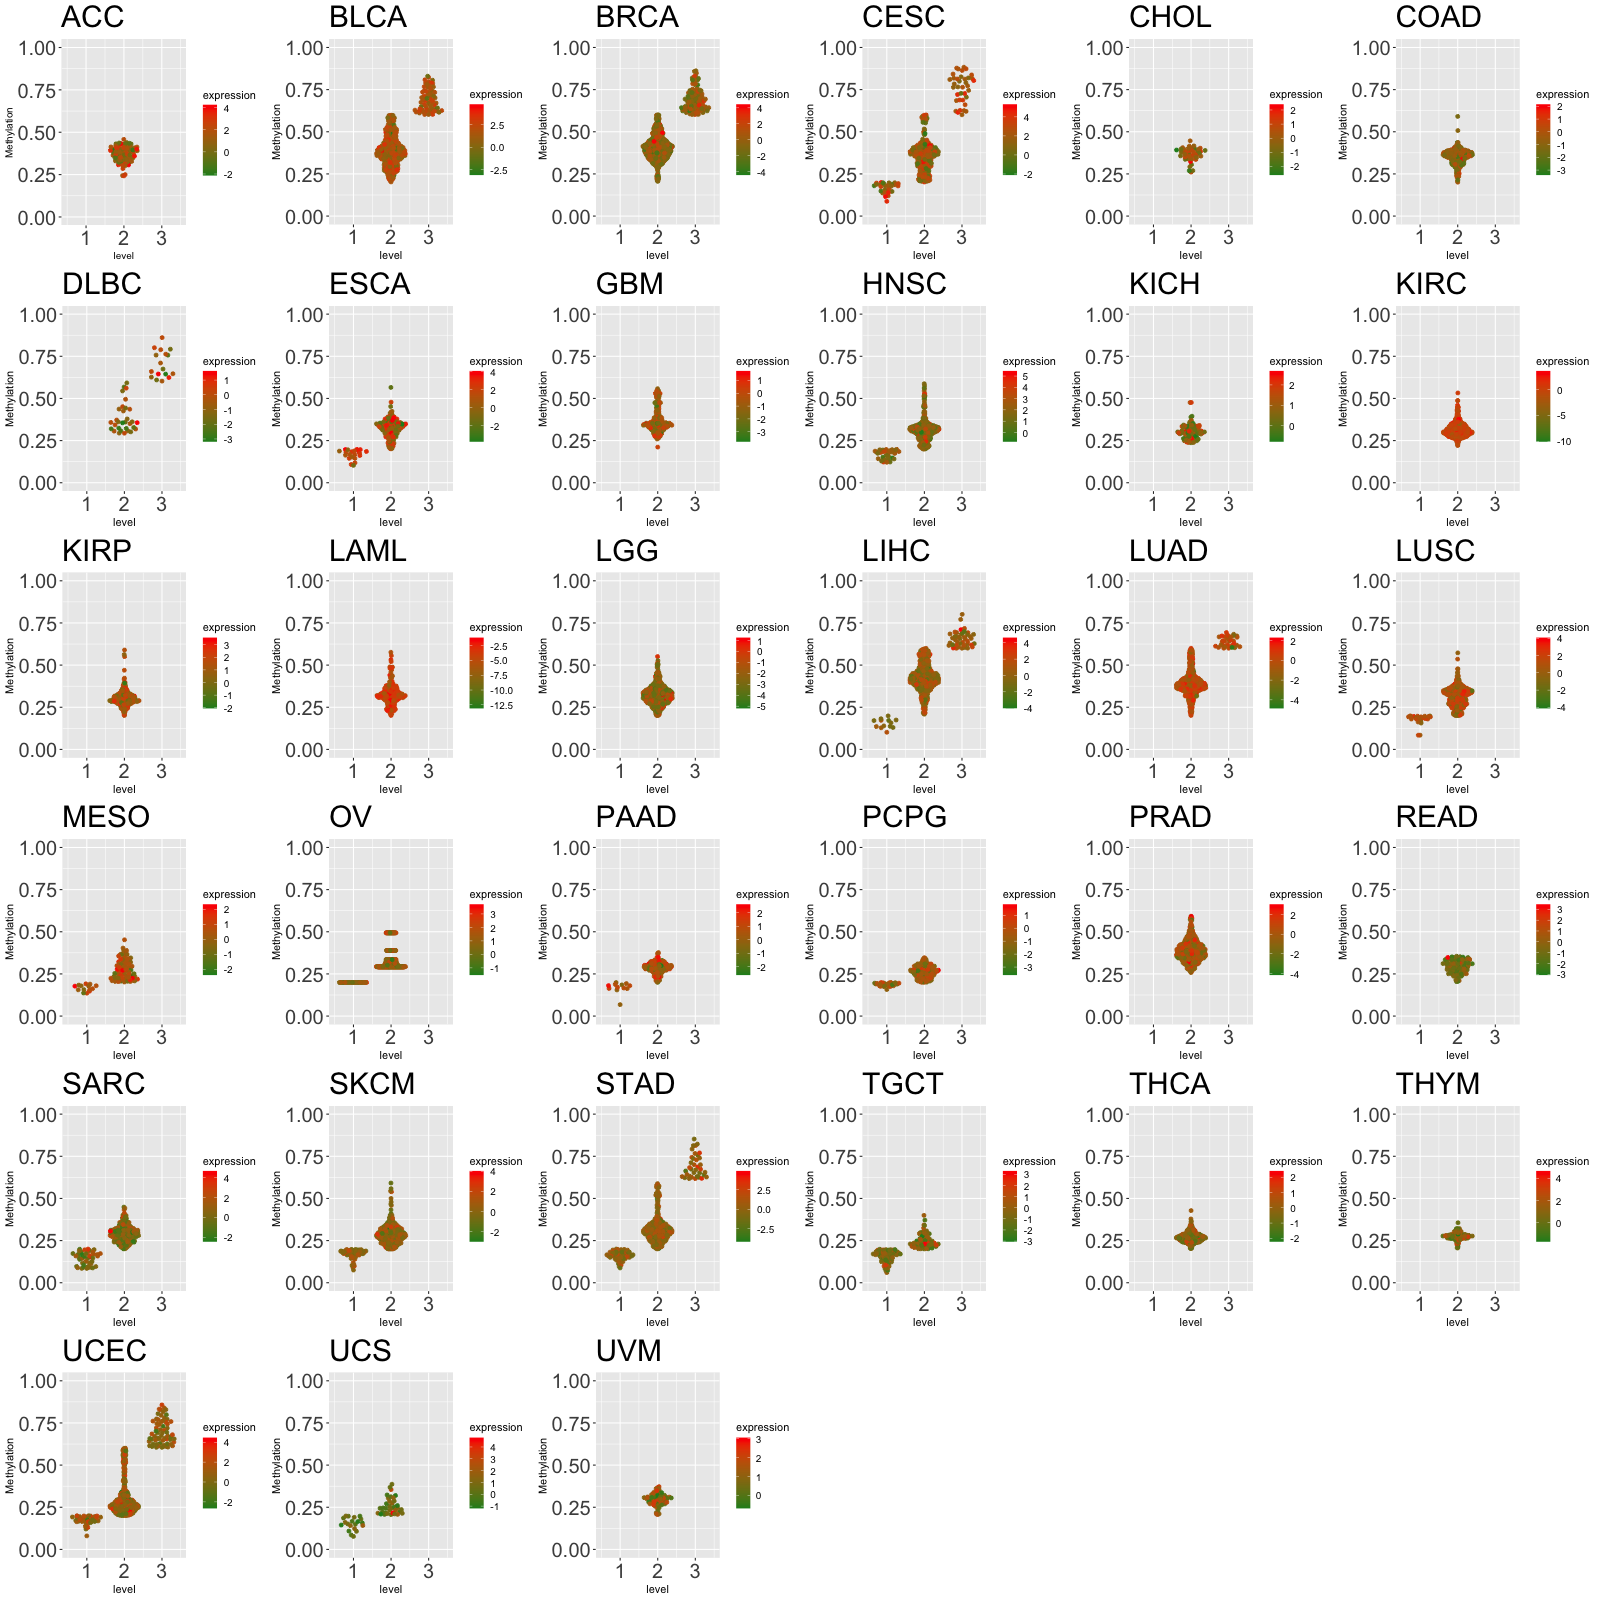 |
| Cancer type | Gene | methyl group b | methyl group a | DEG pval | avg methyl in b | avg methyl in a | avg exp in b | avg exp in a |
| ESCA | EIF5A2 | 1 | 2 | 0.00858341185831073 | 0.166881632653061 | 0.322729454253612 | 1.91010469539353 | 0.85339378046524 |
| LIHC | EIF5A2 | 1 | 2 | 0.0171507547164857 | 0.153844755244755 | 0.425930521212121 | -0.384009590322154 | 0.344740943010918 |
| LIHC | EIF5A2 | 1 | 3 | 0.0186566051039439 | 0.153844755244755 | 0.655841352549889 | -0.384009590322154 | 0.577439190165368 |
| OV | EIF5A2 | 1 | 2 | 0.00312441877114368 | 0.199485714285714 | 0.336454547790339 | 0.742707076344403 | 1.22644112910298 |
| Translation factor expression regulation through methylation in the gene body of Translation factor (positive regulation) |
 |
| Cancer type | Gene | methyl group b | methyl group a | DEG pval | avg methyl in b | avg methyl in a | avg exp in b | avg exp in a |
| Translation factor expression regulation through copy number variation of Translation factor |
 |
| Cancer type | Gene | Coefficient | Pvalue |
| PRAD | EIF5A2 | 0.029082832 | 0.005763815 |
Top |
|
| Strongly correlated genes belong to cellular important gene groups with EIF5A2 (coefficient>0.8, pval<0.05, node color based on FC between tumor and matched normal). Significantly associated important genes in the individual cancer types. * Cell metabolism gene: cell metabolism genes from REACTOME (black edge), IUPHAR: drug target genes from IUPHAR (blue edge), Kinase: human kinase genes (brown edge), CGC: cancer gene census genes (orange edge), TSG: tumor suppresor genes (purple edge), Epifactor: epigenetic factors (light blue edge), TF: transcription factors (green) |
| Cancer type | Gene group | Translation factor | Correlated gene | Coefficient | Pvalue |
Top |
|
| Protein 3D structure Visit iCn3D. |
Top |
|
| Protein-protein interaction networks * Overlap between up-regulated DEGs (log2FC<-1 and adj.P<0.05) and STRING PPI network (center: Translation factor, node: DEGs, edges: weighted by -log2(adj.P)) |
 |
| Overlap between down-regulated DEGs (log2FC>1 and adj.P<0.05) and STRING PPI network (center: Translation factor, node: DEGs, edges: weighted by -log2(adj.P)) |
 |
 * Edge colors based on TCGA cancer types. |
| * Overlap between DEGs (log2FC>1 and adj.P<0.05) and STRING PPI network per cancer (center: Translation factor, node: DEGs, node color: log2FC, edges: weighted by -log2(adj.P)) |
 |
| Cancer type | Translation factor | Interacting protein coding gene | FC | adj.pval |
| LIHC | EIF5A2 | EIF5A | -2.36221705677847 | 0.000122033393260438 |
| THCA | EIF5A2 | EIF5A | -1.78363731048148 | 0.000163107625527599 |
| KICH | EIF5A2 | RPS17 | -9.74128123960814 | 0.000556409358978271 |
| PRAD | EIF5A2 | RPS15 | 2.38682220239643 | 0.000931746432967977 |
| PRAD | EIF5A2 | EEF1G | 1.04301780897756 | 0.00116785923777763 |
| THCA | EIF5A2 | DHPS | -2.2143641551526 | 0.00180184141035168 |
| STAD | EIF5A2 | EIF5A | -3.31350115276852 | 0.00239070039242506 |
| KICH | EIF5A2 | EIF5A | 1.13226408826506 | 0.00308787822723389 |
| ESCA | EIF5A2 | RPL15 | 1.76629417535644 | 0.0048828125 |
| THCA | EIF5A2 | RPLP1 | -1.55724010733009 | 0.00553919070100212 |
| HNSC | EIF5A2 | RPS17 | -1.41932406270792 | 0.00608886057921154 |
| LUSC | EIF5A2 | RPS15 | -1.54018132537089 | 0.00665527288479679 |
| THCA | EIF5A2 | DOHH | -1.77397594528087 | 0.0113302146920605 |
| ESCA | EIF5A2 | EIF5A | -1.53981930599908 | 0.013671875 |
| PRAD | EIF5A2 | DOHH | -1.36546815787639 | 0.0278551491578459 |
| READ | EIF5A2 | DOHH | -2.91730296765426 | 0.03125 |
| COAD | EIF5A2 | RPS13 | 1.30175825100469 | 0.0357243716716767 |
| KIRP | EIF5A2 | EEF1G | -2.05417074227368 | 0.0375871751457453 |
| KIRC | EIF5A2 | RPS17 | -1.14106059335771 | 1.12651178935203e-06 |
| BRCA | EIF5A2 | DHPS | -1.35684185337444 | 1.3885583420074e-06 |
| LUAD | EIF5A2 | EIF5A | -3.54842210612043 | 1.73122747932354e-05 |
| BRCA | EIF5A2 | RPL9 | -3.0134495932037 | 2.59559089925671e-05 |
| PRAD | EIF5A2 | DHPS | 1.82553075697225 | 4.6388445697259e-07 |
| BRCA | EIF5A2 | EIF5A | -1.08858196408792 | 6.35242413482859e-13 |
| KIRC | EIF5A2 | RPS15 | -1.51134139657827 | 6.64395189280361e-09 |
| KIRP | EIF5A2 | RPS15 | -1.53644743209735 | 9.0546440333128e-05 |
| Protein-protein interactors with this translation factor (BIOGRID-3.4.160) |
| PPI interactors with EIF5A2 |
| DHPS, DCC, OPTN, VHL, CUL3, CUL4B, CDK2, RAB30, PTBP2, FAM96B, REL, SDCBP, CDC23, NIF3L1, DOHH, EZR, PPIB, MYCBP, TAGLN2, EWSR1, PIH1D1, HIF1A, HEXIM1, AGR2, NFX1, FBXW8, CCDC8, CUL9, CUL7, GAB2, NEK4, nsp3, FBP1, GINS2, EIF5A, CLEC2B, GINS1, PIK3C2A, ST14, GINS4, TFAP2B, PDCD2L, NAB2, CCNF, |
Top |
|
| Clinically associated variants from ClinVar. |
| Gene | Chr | Position | RefSeq | VarSeq | RefSeeq | VarType | Pathogenic | Disease | VarInfo |
| nsSNVs with sample frequency (size of circle) from TCGA 33 cancers. |
 |
| SNVs and Indels |
| Gene | Cancer type | Chromosome | Start | End | RefSeeq | MutSeq | Mutation type | AAchange | # samples |
| EIF5A2 | STAD | chr3 | 170624844 | 170624844 | T | - | Frame_Shift_Del | p.Y69fs | 4 |
| EIF5A2 | ESCA | chr3 | 170612162 | 170612162 | T | G | Missense_Mutation | p.E107D | 3 |
| EIF5A2 | UCEC | chr3 | 170625563 | 170625563 | A | G | Silent | p.D11 | 2 |
| EIF5A2 | ESCA | chr3 | 170612162 | 170612162 | T | G | Missense_Mutation | 2 | |
| EIF5A2 | UCEC | chr3 | 170625586 | 170625586 | C | T | Missense_Mutation | p.E4K | 2 |
| EIF5A2 | SKCM | chr3 | 170625451 | 170625451 | C | G | Missense_Mutation | p.G49R | 2 |
| EIF5A2 | HNSC | chr3 | 170624851 | 170624851 | C | T | Missense_Mutation | p.G66D | 2 |
| EIF5A2 | STAD | chr3 | 170625513 | 170625513 | T | - | Frame_Shift_Del | p.N28fs | 2 |
| EIF5A2 | LIHC | chr3 | 170612105 | 170612105 | T | - | Frame_Shift_Del | p.K126fs | 2 |
| EIF5A2 | STAD | chr3 | 170625432 | 170625432 | T | C | Missense_Mutation | p.K55R | 2 |
| EIF5A2 | STAD | chr3 | 170624844 | 170624844 | T | - | Frame_Shift_Del | p.K68fs | 2 |
| EIF5A2 | COAD | chr3 | 170624791 | 170624791 | C | A | Missense_Mutation | p.R86I | 2 |
| EIF5A2 | UCEC | chr3 | 170612149 | 170612149 | G | T | Missense_Mutation | p.L112I | 2 |
| EIF5A2 | UCEC | chr3 | 170612213 | 170612213 | C | T | Splice_Site | e3-1 | 2 |
| EIF5A2 | LUAD | chr3 | 170612100 | 170612100 | T | A | Missense_Mutation | p.N128I | 1 |
| EIF5A2 | LUSC | chr3 | 170624845 | 170624845 | T | G | Missense_Mutation | p.K68T | 1 |
| EIF5A2 | HNSC | chr3 | 170625446 | 170625446 | C | A | Missense_Mutation | 1 | |
| EIF5A2 | HNSC | chr3 | 170625446 | 170625446 | C | A | Missense_Mutation | p.K50N | 1 |
| EIF5A2 | STAD | chr3 | 170624844 | 170624844 | T | - | Frame_Shift_Del | 1 | |
| EIF5A2 | LIHC | chr3 | 170612155 | 170612155 | C | T | Missense_Mutation | 1 | |
| EIF5A2 | LIHC | chr3 | 170612144 | 170612144 | T | - | Frame_Shift_Del | p.K113fs | 1 |
| EIF5A2 | COAD | chr3 | 170612158 | 170612158 | G | A | Missense_Mutation | p.R109C | 1 |
| EIF5A2 | LIHC | chr3 | 170611161 | 170611161 | T | - | Frame_Shift_Del | p.K150fs | 1 |
| EIF5A2 | THYM | chr3 | 170624851 | 170624851 | C | T | Missense_Mutation | 1 | |
| EIF5A2 | LUAD | chr3 | 170625555 | 170625555 | G | T | Missense_Mutation | p.A14D | 1 |
| EIF5A2 | ESCA | chr3 | 170611036 | 170611037 | - | A | RNA | NULL | 1 |
| EIF5A2 | LUAD | chr3 | 170624864 | 170624864 | C | G | Missense_Mutation | p.D62H | 1 |
| Copy number variation (CNV) of EIF5A2 * Click on the image to open the original image in a new window. |
 |
| Fusion gene breakpoints (product of the structural variants (SVs)) across EIF5A2 * Click on the image to open the UCSC genome browser with custom track showing this image in a new window. |
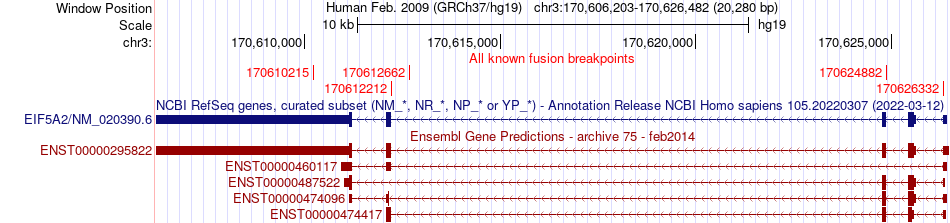 |
| Fusion genes with this translation factor from FusionGDB2.0. |
| FusionGDB2 ID | Disease | Sample | Hgene | Hchr | Hbp | Hstrand | Tgene | Tchr | Tbp | Tstrand |
| 99958 | CESC | TCGA-EK-A2R9-01A | EIF5A2 | chr3 | 170626332 | - | PRKCI | chr3 | 170011171 | + |
| 102165 | N/A | AF262027 | EIF5A2 | chr3 | 170610215 | - | RAD23B | chr9 | 110093684 | + |
| 92693 | PRAD | TCGA-EJ-5501-01A | PARP8 | chr5 | 49963959 | + | EIF5A2 | chr3 | 170624882 | - |
| 92693 | LIHC | TCGA-XR-A8TG-01A | SLC2A2 | chr3 | 170720365 | - | EIF5A2 | chr3 | 170612212 | - |
| 92702 | N/A | EC495694 | TNIK | chr3 | 170785460 | - | EIF5A2 | chr3 | 170612662 | - |
Top |
|
| Kaplan-Meier plots with logrank tests of overall survival (OS) |
 |
| Cancer type | Translation factor | Coefficent | Hazard ratio | Wald test pval | Likelihool ratio pval | Logrank test pval | # samples |
Top |
|
| Differential gene expression between female and male. (Wilcoxon test, pval<0.05) |
 |
| Cancer type | Translation factor | pval | adj.p |
| TGCT | EIF5A2 | 0.00601461417704709 | 0.16 |
| BLCA | EIF5A2 | 0.0142110776691666 | 0.37 |
| LGG | EIF5A2 | 0.02649739527616 | 0.66 |
| SKCM | EIF5A2 | 0.0283258271905349 | 0.68 |
| KIRP | EIF5A2 | 1.87986618414903e-06 | 5.3e-05 |
Top |
|
| Differential gene expression between young and old age groups (Wilcoxon test, pval<0.05) |
 |
| Cancer type | Translation factor | pval | adj.p |
| TGCT | EIF5A2 | 0.034301221412599 | 1 |
| LIHC | EIF5A2 | 0.00152472937327566 | 0.049 |
| BRCA | EIF5A2 | 0.000352710908839854 | 0.012 |
| MESO | EIF5A2 | 0.0335921509484974 | 1 |
Top |
|
| Drugs targeting genes involved in this translation factor. (DrugBank Version 5.1.8 2021-05-08) |
| UniProtAcc | DrugBank ID | Drug name | Drug activity | Drug type | Drug status |
Top |
|
| Diseases associated with this translation factor. (DisGeNet 4.0) |
| Disease ID | Disease Name | # PubMeds | Disease source |
(UTHealth)
Web File Viewing | Emergency Information |Campus Carry|Site Policies