
|
||||||
|

Translation Factor: RPL22 (NCBI Gene ID:6146) |
|
 Gene Summary Gene Summary |
| Gene Information | Gene Name: RPL22 | Gene ID: 6146 | Gene Symbol | RPL22 | Gene ID | 6146 |
| Gene Name | ribosomal protein L22 | |
| Synonyms | EAP|HBP15|HBP15/L22|L22 | |
| Cytomap | 1p36.31 | |
| Type of Gene | protein-coding | |
| Description | 60S ribosomal protein L22EBER-associated proteinEpstein-Barr virus small RNA-associated proteinEpstein-Barr-encoded RNA-associated proteinheparin-binding protein 15heparin-binding protein HBp15large ribosomal subunit protein eL22 | |
| Modification date | 20200313 | |
| UniProtAcc | P35268 | |
| Child GO biological process term(s) under GO:0006412 |
| GO ID | GO term |
| GO:0006417 | Regulation of translation |
| GO:0005840 | Ribosome |
| GO:0002181 | Cytoplasmic translation |
| GO:0006412 | Translation |
| Gene ontology of translaction factor with evidence of Inferred from Direct Assay (IDA) from Entrez |
| Partner | Gene | GO ID | GO term | PubMed ID |
| Inferred gene age of translation factor. |
| Gene | Inferred gene age group among (0 - 67.6], (67.6 - 355.7], (355.7 - 733], (733 - 1119.25], >1119.25 |
| RPL22 | >1119.25 |
Top |
|
| We searched PubMed using 'RPL22[title] AND translation [title] AND human.' |
| Gene | Title | PMID |
| RPL22 | . | . |
Top |
|
| Skipped exons in TCGA and GTEx based on Ensembl gene isoform structure. * Click on the image to open the UCSC genome browser with custom track showing this image in a new window. For more annotations, please visit our ExonSkipDB. |
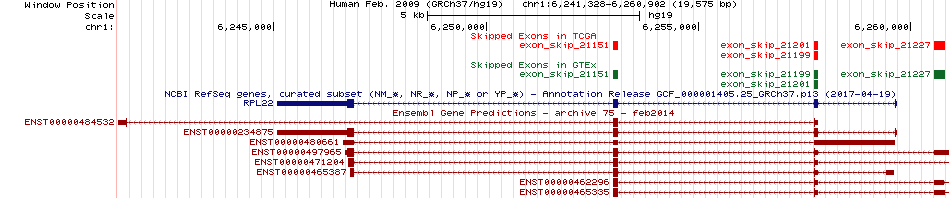 |
| Open reading frame (ORF) analsis of exon skipping events based on Ensembl gene isoform structure. * Click on the break point to see the gene structure around the break point region using the UCSC Genome Browser. |
| ENST | Exon skip start (DNA) | Exon Skip end (DNA) | ORF |
| ENST00000234875 | 6252989 | 6253114 | Frame-shift |
| ENST00000234875 | 6257711 | 6257816 | In-frame |
| Exon skipping position in the amino acid sequence. |
| ENST | Exon skip start (DNA) | Exon Skip end (DNA) | Len(transcript seq) | Exon skip start (mRNA) | Exon Skip end (mRNA) | Len(amino acid seq) | Exon skip start (AA) | Exon Skip end (AA) |
| ENST00000234875 | 6257711 | 6257816 | 2095 | 52 | 156 | 128 | 4 | 39 |
| Potentially (partially) lost protein functional features of UniProt. |
| UniProtAcc | Exon skip start (AA) | Exon Skip end (AA) | Function feature start (AA) | Function feature end (AA) | Functional feature type | Functional feature desc. |
| P35268 | 4 | 39 | 2 | 128 | Chain | ID=PRO_0000215501;Note=60S ribosomal protein L22 |
Top |
|
| Gene expression level across TCGA pancancer |
 |
| Gene expression level across GTEx pantissue |
 |
| Expression level of gene isoforms across TCGA pancancer |
 |
| Expression level of gene isoforms across GTEx pantissue |
 |
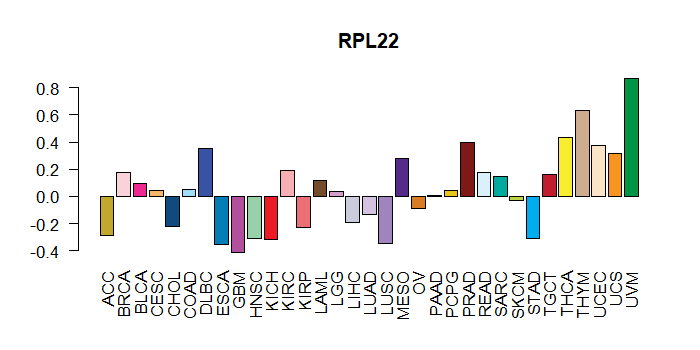
| Cancer(tissue) type-specific expression level of Translation factor using z-score distriution |
 |
| Differential expression between tumor and matched normal (in the cancer types with more than 10 matched samples) |
 |
| Cancer type | Translation factor | FC | adj.pval |
| LIHC | RPL22 | 1.69944741480638 | 0.00235963995691637 |
| BLCA | RPL22 | -1.66398106452175 | 0.002838134765625 |
| UCEC | RPL22 | -1.25950871113125 | 0.046875 |
| BRCA | RPL22 | -2.59980502511221 | 6.9057331042677e-19 |
| KIRP | RPL22 | 1.74965489233405 | 7.71600753068924e-06 |
Top |
|
| Translation factor expression regulation through miRNA binding |
| Cancer type | Gene | miRNA | TargetScan binding score (Context++ score percentile) | Coefficient | Pvalue |
| Translation factor expression regulation through methylation in the promoter of Translation factor |
 |
| Cancer type | Gene | methyl group b | methyl group a | DEG pval | avg methyl in b | avg methyl in a | avg exp in b | avg exp in a |
| Translation factor expression regulation through methylation in the gene body of Translation factor (positive regulation) |
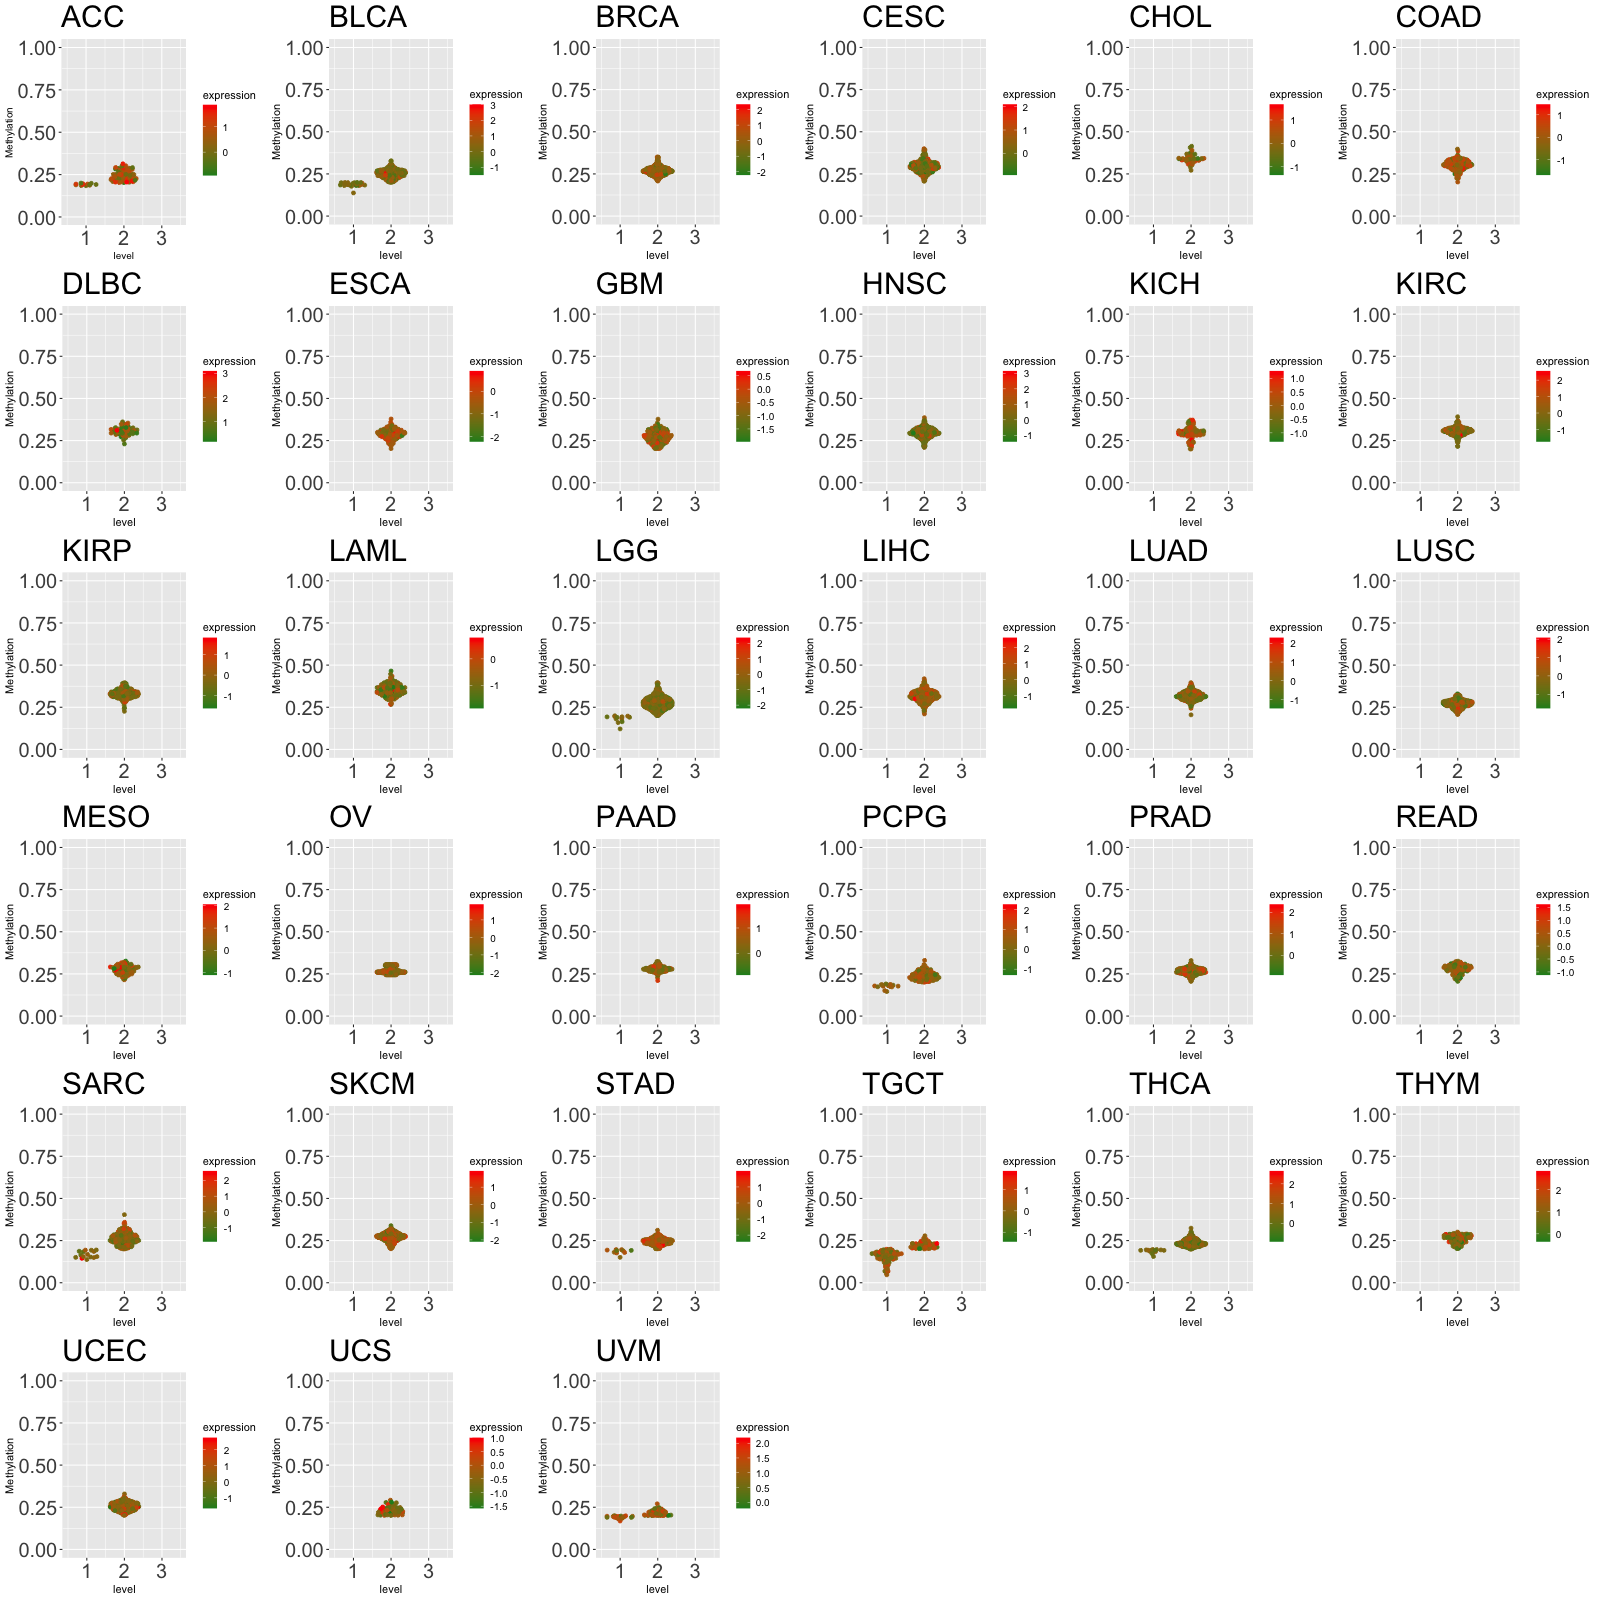 |
| Cancer type | Gene | methyl group b | methyl group a | DEG pval | avg methyl in b | avg methyl in a | avg exp in b | avg exp in a |
| BLCA | RPL22 | 2 | 1 | 0.0258770629874811 | 0.211087414965986 | 0.166966753246753 | -0.273103727136922 | -0.113176788361561 |
| READ | RPL22 | 2 | 1 | 0.0266890470412189 | 0.218915454545455 | 0.1818485 | -0.13873276238759 | -0.311428216932983 |
| Translation factor expression regulation through copy number variation of Translation factor |
 |
| Cancer type | Gene | Coefficient | Pvalue |
| UVM | RPL22 | -0.190575418 | 0.000919024 |
| CESC | RPL22 | 0.086158015 | 0.000999362 |
| LAML | RPL22 | 0.038052073 | 0.009563394 |
Top |
|
| Strongly correlated genes belong to cellular important gene groups with RPL22 (coefficient>0.8, pval<0.05, node color based on FC between tumor and matched normal). Significantly associated important genes in the individual cancer types. * Cell metabolism gene: cell metabolism genes from REACTOME (black edge), IUPHAR: drug target genes from IUPHAR (blue edge), Kinase: human kinase genes (brown edge), CGC: cancer gene census genes (orange edge), TSG: tumor suppresor genes (purple edge), Epifactor: epigenetic factors (light blue edge), TF: transcription factors (green) |
 |
| Cancer type | Gene group | Translation factor | Correlated gene | Coefficient | Pvalue |
| DLBC | Cell metabolism gene | RPL22 | PFDN5 | 0.800257925 | 8.78E-12 |
| DLBC | Cell metabolism gene | RPL22 | POLR2F | 0.811907856 | 2.52E-12 |
| DLBC | Cell metabolism gene | RPL22 | NME2 | 0.816850014 | 1.45E-12 |
| DLBC | Cell metabolism gene | RPL22 | FAU | 0.852774639 | 1.44E-14 |
| DLBC | Cell metabolism gene | RPL22 | SNRPD2 | 0.867290766 | 1.55E-15 |
| DLBC | CGC | RPL22 | NACA | 0.8212201 | 8.73E-13 |
| DLBC | Epifactor | RPL22 | FBL | 0.86725766 | 1.56E-15 |
| DLBC | TF | RPL22 | NME2 | 0.816850014 | 1.45E-12 |
| DLBC | TSG | RPL22 | PARK7 | 0.809707037 | 3.21E-12 |
| DLBC | TSG | RPL22 | GNB2L1 | 0.819226932 | 1.10E-12 |
| LAML | Cell metabolism gene | RPL22 | TIMM9 | 0.828475505 | 6.44E-45 |
| PRAD | CGC | RPL22 | NACA | 0.817019476 | 3.83E-133 |
| THYM | Cell metabolism gene | RPL22 | PFDN5 | 0.803425695 | 8.55E-29 |
| THYM | Cell metabolism gene | RPL22 | FAU | 0.845114189 | 1.97E-34 |
| THYM | Epifactor | RPL22 | DMAP1 | 0.804214307 | 6.89E-29 |
| THYM | IUPHAR | RPL22 | CSNK2B | 0.801811792 | 1.33E-28 |
| THYM | TSG | RPL22 | GLTSCR2 | 0.825022951 | 1.58E-31 |
| THYM | TSG | RPL22 | GNB2L1 | 0.830081562 | 3.19E-32 |
| UCS | Cell metabolism gene | RPL22 | PFDN5 | 0.803425695 | 8.55E-29 |
| UCS | Cell metabolism gene | RPL22 | FAU | 0.845114189 | 1.97E-34 |
| UCS | Epifactor | RPL22 | DMAP1 | 0.804214307 | 6.89E-29 |
| UCS | IUPHAR | RPL22 | CSNK2B | 0.801811792 | 1.33E-28 |
| UCS | TSG | RPL22 | GLTSCR2 | 0.825022951 | 1.58E-31 |
| UCS | TSG | RPL22 | GNB2L1 | 0.830081562 | 3.19E-32 |
| UVM | Cell metabolism gene | RPL22 | SEC11A | 0.802711621 | 3.44E-19 |
Top |
|
| Protein 3D structure Visit iCn3D. |
Top |
|
| Protein-protein interaction networks * Overlap between up-regulated DEGs (log2FC<-1 and adj.P<0.05) and STRING PPI network (center: Translation factor, node: DEGs, edges: weighted by -log2(adj.P)) |
 |
| Overlap between down-regulated DEGs (log2FC>1 and adj.P<0.05) and STRING PPI network (center: Translation factor, node: DEGs, edges: weighted by -log2(adj.P)) |
 |
 * Edge colors based on TCGA cancer types. |
| * Overlap between DEGs (log2FC>1 and adj.P<0.05) and STRING PPI network per cancer (center: Translation factor, node: DEGs, node color: log2FC, edges: weighted by -log2(adj.P)) |
 |
| Cancer type | Translation factor | Interacting protein coding gene | FC | adj.pval |
| KIRP | RPL22 | RPL18A | -1.51651392808885 | 0.00016188295558095 |
| KICH | RPL22 | RPS27A | 1.75396693785956 | 0.000187873840332031 |
| KIRP | RPL22 | RPS16 | -1.35957043617517 | 0.00019507110118866 |
| COAD | RPL22 | RPS3 | 1.48730375143014 | 0.000411599874496461 |
| KIRP | RPL22 | RPS11 | -1.01861570565103 | 0.00105937570333481 |
| LIHC | RPL22 | RPL8 | -4.84588284974558 | 0.00110314154326131 |
| PRAD | RPL22 | RPL18A | 1.40600175748499 | 0.00205137828390396 |
| KICH | RPL22 | RPL19 | 1.36901182894089 | 0.00250792503356934 |
| KICH | RPL22 | RPS12 | 1.26997381758431 | 0.00308787822723389 |
| LUAD | RPL22 | RPL19 | -1.31398026615725 | 0.00993159558412698 |
| THCA | RPL22 | RPS16 | -6.16322798156577 | 0.0115764821363307 |
| BLCA | RPL22 | RPS12 | -1.47804673440421 | 0.0204124450683594 |
| BLCA | RPL22 | RPS27A | -1.04747470069188 | 0.0258216857910156 |
| HNSC | RPL22 | RPS3 | -4.73505819095135 | 0.0273726439852453 |
| COAD | RPL22 | RPS11 | 1.35307548998204 | 0.0312207043170929 |
| LUSC | RPL22 | RPL19 | -2.14669889516666 | 0.044366810398747 |
| KIRC | RPL22 | RPL19 | -2.73485271276676 | 1.33980982873695e-10 |
| BRCA | RPL22 | RPS12 | -4.91239327478244 | 1.85340619742495e-09 |
| KIRP | RPL22 | RPL37 | -1.17421621947139 | 2.26888805627823e-05 |
| KIRC | RPL22 | RPL35 | -1.06475238059392 | 2.72286325678163e-08 |
| KIRC | RPL22 | RPL8 | -1.18252459971773 | 5.64962994208288e-07 |
| KIRP | RPL22 | RPL8 | -1.53003692350119 | 6.0301274061203e-05 |
| KIRC | RPL22 | RPS16 | -1.66149869889384 | 7.8509870430991e-09 |
| BRCA | RPL22 | RPS27A | -4.28512148200424 | 7.8788217967112e-14 |
| KIRC | RPL22 | RPL37 | -2.87198822058464 | 8.03913394748564e-12 |
| KIRP | RPL22 | RPL35 | -1.52981101975496 | 9.0546440333128e-05 |
| KIRC | RPL22 | RPS3 | -1.29560847926387 | 9.05905681935088e-10 |
| KIRC | RPL22 | RPL18A | -4.43079304960843 | 9.2516163152192e-11 |
| Protein-protein interactors with this translation factor (BIOGRID-3.4.160) |
| PPI interactors with RPL22 |
| NSFL1C, CSE1L, CDC42, UBC, POU5F1, CD4, CALM1, EBNA-LP, MAPK14, RAD21, HDGF, ARRB1, ARRB2, NFX1, CUL3, CUL4A, CUL5, CUL2, CDK2, CUL1, COPS5, CAND1, PRAME, RPL15, RPL18, RPL19, RPL24, RPL37A, RPL14, RPS23, RPL11, RPL13, RPL4, RPS11, RPS13, RPS8, RPL6, RPL21, RPL27A, RPL5, RPL23A, RPS16, RPL7, RPL18A, RPS3A, RPL30, RPS26, RPS4X, RPS3, RPL7A, RPS6, RPS2, RPLP0, RPSA, RPS17, RPS24, RPS19, RPL23, RPL31, RPL12, RPL10A, RPS27A, RPS21, RPL17, ILF3, HNRNPM, RPS27L, RPL10L, STRAP, RPLP0P6, HSP90AA4P, DHX15, ESR1, SMURF1, VCAM1, FN1, IL7R, UBL4A, ITGA4, PAN2, CD81, IGSF8, ICAM1, SRPK2, TARDBP, PARK2, ARFGAP1, GTF3C4, HEXB, AURKA, CEP57, CEP76, TUBG1, VCP, HUWE1, PHF6, CCDC8, EED, RNF2, EGFR, LUZP4, WDR76, HNRNPU, LUC7L2, RPL10, RPL13A, ATP1B3, RPL38, RPL8, RPS12, RPS20, RPS5, RPL26, RPL26L1, RPL27, RPL3, RPL34, RPL35, RPL35A, RPL36, RPL9, RPLP2, RPS10, RPS14, RPS15, RPS15A, RPS18, RPS25, LOC101929876, RPS27, RPS7, RPS9, AHSA1, MYH9, NPM1, THOC5, NOP56, CBX8, Actb, Eif3a, Eif3e, Ktn1, Coro1c, Rpl35, Srp72, Rrbp1, Ccdc9, Flnb, MCM2, Ksr1, RC3H1, CDC73, NCL, CYLD, TRIM25, BMP4, PRPF8, PIH1D1, EFTUD2, CHD3, CHD4, TNF, SDCBP, SDCBP2, BAG4, FAM188B, MDM2, SPDL1, RIOK1, HEXIM1, MEPCE, LARP7, PPT1, HERC2, UBE3A, AGR2, RECQL4, REST, ZFP36L2, MYC, Prkab1, GRWD1, METTL14, KIAA1429, PSME3, EIF4B, RC3H2, PHB, RBX1, USP14, NR2C2, PPP1CC, AGRN, KRAS, DYNLT1, VRK1, HIST1H4A, SNRNP70, Dppa3, ITFG1, ARAF, HMGB1, BIRC3, STAU1, WWP2, RPL22, THAP1, DDIT4L, SURF6, ZCCHC10, AP2M1, FGF11, BEND7, STAC3, HIST1H2BN, CT45A1, ARIH2, PLEKHA4, PINK1, FANCD2, PTEN, HCVgp1, ZC3H18, FGFR1, HCK, MAPK1, PTPN6, H1FOO, M, nsp13, nsp4, nsp6, ORF3a, NEK4, DUX4, CIT, ANLN, AURKB, CHMP4B, ECT2, KIF14, KIF20A, KIF23, PRC1, INS, NINL, Apc2, RBM39, FBP1, LGALS9, RIN3, TOP3B, FBXL19, OGT, UFL1, DDRGK1, DHFRL1, TRIM37, SLC26A4-AS1, FZR1, WDR5, NUDCD2, CEBPZ, ZBTB24, SREK1, NIP7, DDX21, SNAPC1, VANGL2, NOC3L, NOC2L, BOP1, KNOP1, DDX24, WDR89, ZCCHC17, SRRM2, URB1, PRKRA, UBTF, DDX31, CENPB, RSBN1L, DDX27, NMNAT1, ZC3H10, GTPBP4, RRP1B, RPL32, DDX51, YBX1, ZNF48, GNL2, EPB41L5, SIN3B, DHX30, BBX, CWC22, BRIX1, TNRC18, SNAPC4, NAF1, RBM28, FTSJ3, VANGL1, NVL, SPRTN, BTF3, FBXW7, MRFAP1, CCNF, N, |
Top |
|
| Clinically associated variants from ClinVar. |
| Gene | Chr | Position | RefSeq | VarSeq | RefSeeq | VarType | Pathogenic | Disease | VarInfo |
| nsSNVs with sample frequency (size of circle) from TCGA 33 cancers. |
 |
| SNVs and Indels |
| Gene | Cancer type | Chromosome | Start | End | RefSeeq | MutSeq | Mutation type | AAchange | # samples |
| RPL22 | ACC | chr1 | 6257785 | 6257785 | T | - | Frame_Shift_Del | p.K15fs | 82 |
| RPL22 | ACC | chr1 | 6257785 | 6257785 | T | - | Frame_Shift_Del | p.K16fs | 13 |
| RPL22 | CESC | chr1 | 6257785 | 6257785 | T | - | Frame_Shift_Del | 12 | |
| RPL22 | BLCA | chr1 | 6257784 | 6257785 | - | T | Frame_Shift_Ins | p.K15fs | 8 |
| RPL22 | LUAD | chr1 | 6253091 | 6253091 | G | C | Missense_Mutation | p.I47M | 7 |
| RPL22 | LIHC | chr1 | 6246852 | 6246852 | T | - | Frame_Shift_Del | p.K89fs | 6 |
| RPL22 | BRCA | chr1 | 6246831 | 6246831 | T | G | Silent | p.L96 | 3 |
| RPL22 | UCEC | chr1 | 6246817 | 6246817 | C | T | Missense_Mutation | p.R101H | 2 |
| RPL22 | KIRP | chr1 | 6246873 | 6246873 | A | T | Nonsense_Mutation | p.Y82X | 2 |
| RPL22 | SKCM | chr1 | 6253107 | 6253107 | A | G | Missense_Mutation | p.F42S | 2 |
| RPL22 | UCEC | chr1 | 6246853 | 6246853 | T | G | Missense_Mutation | p.K89T | 2 |
| RPL22 | KIRP | chr1 | 6246873 | 6246873 | A | T | Nonsense_Mutation | p.Y82* | 2 |
| RPL22 | UCEC | chr1 | 6246855 | 6246855 | T | G | Missense_Mutation | p.K88N | 2 |
| RPL22 | UCEC | chr1 | 6257713 | 6257713 | A | T | Missense_Mutation | p.F39Y | 2 |
| RPL22 | UCEC | chr1 | 6257784 | 6257785 | - | T | Frame_Shift_Ins | p.K16fs | 2 |
| RPL22 | ACC | chr1 | 6246838 | 6246840 | TTC | - | In_Frame_Del | p.94_94del | 2 |
| RPL22 | STAD | chr1 | 6246818 | 6246818 | G | A | Missense_Mutation | p.R101C | 2 |
| RPL22 | HNSC | chr1 | 6253065 | 6253065 | A | G | Missense_Mutation | p.L56P | 2 |
| RPL22 | STAD | chr1 | 6257785 | 6257786 | TT | - | Frame_Shift_Del | p.15_15del | 2 |
| RPL22 | KIRC | chr1 | 6246862 | 6246862 | A | G | Missense_Mutation | p.L86P | 2 |
| RPL22 | BLCA | chr1 | 6257784 | 6257785 | - | - | Frame_Shift_Ins | 2 | |
| RPL22 | STAD | chr1 | 6253081 | 6253081 | C | T | Missense_Mutation | p.G51R | 2 |
| RPL22 | KIRC | chr1 | 6246851 | 6246852 | - | T | Frame_Shift_Ins | p.Y90fs | 2 |
| RPL22 | KIRC | chr1 | 6246851 | 6246852 | - | T | Frame_Shift_Ins | p.F90fs | 2 |
| RPL22 | SKCM | chr1 | 6253066 | 6253066 | G | A | Missense_Mutation | p.L56F | 2 |
| RPL22 | SKCM | chr1 | 6253009 | 6253009 | C | A | Nonsense_Mutation | p.E75X | 1 |
| RPL22 | COAD | chr1 | 6246851 | 6246851 | A | G | Missense_Mutation | p.Y90H | 1 |
| RPL22 | KIRP | chr1 | 6246873 | 6246873 | A | T | Nonsense_Mutation | 1 | |
| RPL22 | SKCM | chr1 | 6253009 | 6253009 | C | A | Nonsense_Mutation | p.E75* | 1 |
| RPL22 | ESCA | chr1 | 6253011 | 6253011 | G | T | Missense_Mutation | 1 | |
| RPL22 | LGG | chr1 | 6257818 | 6257818 | T | A | Splice_Site | . | 1 |
| RPL22 | SKCM | chr1 | 6246833 | 6246833 | G | A | Silent | p.L96L | 1 |
| RPL22 | HNSC | chr1 | 6253065 | 6253065 | A | G | Missense_Mutation | 1 | |
| RPL22 | LIHC | chr1 | 6253019 | 6253019 | G | T | Silent | 1 | |
| RPL22 | SKCM | chr1 | 6252996 | 6252996 | G | A | Missense_Mutation | p.S79F | 1 |
| RPL22 | HNSC | chr1 | 6253099 | 6253099 | C | T | Missense_Mutation | 1 | |
| RPL22 | LIHC | chr1 | 6257754 | 6257754 | G | T | Nonsense_Mutation | p.C25X | 1 |
| RPL22 | STAD | chr1 | 6246818 | 6246818 | G | A | Missense_Mutation | 1 | |
| RPL22 | HNSC | chr1 | 6253099 | 6253099 | C | T | Missense_Mutation | p.E45K | 1 |
| RPL22 | LIHC | chr1 | 6257754 | 6257754 | G | T | Nonsense_Mutation | p.C25* | 1 |
| RPL22 | ACC | chr1 | 6246838 | 6246840 | TTC | - | In_Frame_Del | p.KN93del | 1 |
| RPL22 | OV | chr1 | 6169417 | 6169417 | G | A | Missense_Mutation | p.R97C | 1 |
| RPL22 | STAD | chr1 | 6257728 | 6257728 | A | C | Missense_Mutation | p.M34R | 1 |
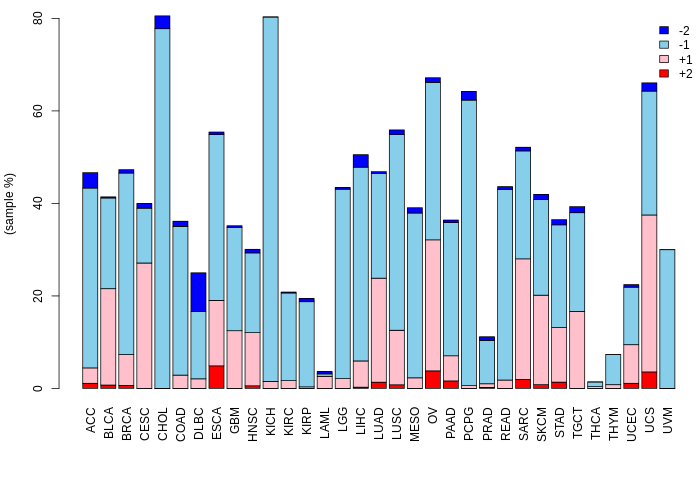
| Copy number variation (CNV) of RPL22 * Click on the image to open the original image in a new window. |
 |
| Fusion gene breakpoints (product of the structural variants (SVs)) across RPL22 * Click on the image to open the UCSC genome browser with custom track showing this image in a new window. |
 |
| Fusion genes with this translation factor from FusionGDB2.0. |
| FusionGDB2 ID | Disease | Sample | Hgene | Hchr | Hbp | Hstrand | Tgene | Tchr | Tbp | Tstrand |
| 100420 | BRCA | TCGA-AN-A0FT | ACOT7 | chr1 | 6387358 | - | RPL22 | chr1 | 6253114 | - |
| 100420 | LGG | TCGA-DU-A5TT | ACOT7 | chr1 | 6387358 | - | RPL22 | chr1 | 6246876 | - |
| 100420 | N/A | N66339 | AFAP1L2 | chr10 | 116109312 | - | RPL22 | chr1 | 6245094 | + |
| 100420 | STAD | TCGA-HU-A4HB-01A | AHI1 | chr6 | 135811761 | - | RPL22 | chr1 | 6257816 | - |
| 100420 | N/A | FN138778 | DLG2 | chr11 | 85189546 | + | RPL22 | chr1 | 6246260 | - |
| 100420 | N/A | BU858788 | MAP3K2 | chr2 | 128062363 | - | RPL22 | chr1 | 6246465 | - |
| 100420 | N/A | AA420829 | MECOM | chr3 | 169201808 | + | RPL22 | chr1 | 6246675 | + |
| 100420 | N/A | EC559899 | RADIL | chr7 | 4905334 | - | RPL22 | chr1 | 6257817 | - |
| 100420 | SKCM | TCGA-D3-A3MV-06A | RCC1 | chr1 | 28834672 | + | RPL22 | chr1 | 6257816 | - |
| 98723 | STAD | TCGA-BR-A452 | RPL22 | chr1 | 6252989 | - | ACOT7 | chr1 | 6324755 | - |
| 98723 | STAD | TCGA-BR-A4QI-01A | RPL22 | chr1 | 6252990 | - | ACOT7 | chr1 | 6324755 | - |
| 76164 | N/A | BM013571 | RPL22 | chr1 | 6246675 | - | CPA2 | chr7 | 129923133 | - |
| 101264 | N/A | CR738829 | RPL22 | chr1 | 6245384 | - | DLC1 | chr8 | 12941285 | - |
| 89764 | PRAD | TCGA-KK-A5A1-01A | RPL22 | chr1 | 6257712 | - | DNAJC11 | chr1 | 6714099 | - |
| 100803 | N/A | BF338721 | RPL22 | chr1 | 6246675 | - | ERG | chr21 | 39818145 | + |
| 101735 | ESCA | TCGA-2H-A9GK | RPL22 | chr1 | 6252989 | - | MECOM | chr3 | 169099312 | - |
| 102124 | N/A | BG574777 | RPL22 | chr1 | 6246675 | - | MKL1 | chr22 | 41006067 | - |
| 84752 | N/A | BF846664 | RPL22 | chr1 | 6246042 | + | PCSK6 | chr15 | 101871293 | - |
| 98891 | COAD | TCGA-A6-2679-01A | RPL22 | chr1 | 6257713 | - | PDE6A | chr5 | 149246804 | - |
| 95065 | HNSC | TCGA-CV-7434 | RPL22 | chr1 | 6252989 | - | PHF16 | chrX | 46844284 | + |
| 84283 | N/A | BF185866 | RPL22 | chr1 | 6246852 | - | PPARGC1A | chr4 | 23976453 | - |
| 76164 | N/A | BG576945 | RPL22 | chr1 | 6246677 | - | PPP3CA | chr4 | 102197050 | - |
| 94215 | SARC | TCGA-DX-AB2X-01A | RPL22 | chr1 | 6257712 | - | PRDM16 | chr1 | 3342145 | + |
| 101261 | OV | TCGA-23-1118-01A | RPL22 | chr1 | 6246763 | - | PTMA | chr2 | 232576638 | + |
| 97174 | LUSC | TCGA-68-8251-01A | RPL22 | chr1 | 6257712 | - | RER1 | chr1 | 2327223 | + |
| 101411 | N/A | CD579559 | RPL22 | chr1 | 6246475 | - | RFC3 | chr13 | 34437089 | - |
| 76164 | LIHC | TCGA-EP-A2KA | RPL22 | chr1 | 6252989 | - | RNF207 | chr1 | 6278348 | + |
| 76164 | LIHC | TCGA-EP-A2KA-01A | RPL22 | chr1 | 6252990 | - | RNF207 | chr1 | 6278349 | + |
| 76164 | N/A | EC516024 | RPL22 | chr1 | 6257713 | - | RPL22P19 | chr12 | 125420352 | - |
| 92890 | ESCA | TCGA-VR-AA4D | RPL22 | chr1 | 6252989 | - | SLMAP | chr3 | 57908615 | + |
| 96490 | N/A | AA879157 | RPL22 | chr1 | 6246675 | - | STK10 | chr5 | 171528473 | + |
| 100932 | N/A | BD309585 | RPL22 | chr1 | 6245165 | - | SYNE1 | chr6 | 152636356 | - |
| 97100 | N/A | BD264640 | RPL22 | chr1 | 6246397 | + | TP53BP1 | chr15 | 43785339 | - |
| 76164 | LUSC | TCGA-60-2703 | RPL22 | chr1 | 6252989 | - | UBE2D3 | chr4 | 103747793 | - |
| 100420 | STAD | TCGA-HU-A4GH-01A | TBL2 | chr7 | 72992750 | - | RPL22 | chr1 | 6246876 | - |
| 100420 | STAD | TCGA-D7-6527 | TXNL4B | chr16 | 72122885 | - | RPL22 | chr1 | 6257816 | - |
| 100421 | KICH | TCGA-KO-8404 | ZBTB38 | chr3 | 141087646 | + | RPL22 | chr1 | 6257816 | - |
Top |
|
| Kaplan-Meier plots with logrank tests of overall survival (OS) |
 |
| Cancer type | Translation factor | Coefficent | Hazard ratio | Wald test pval | Likelihool ratio pval | Logrank test pval | # samples |
Top |
|
| Differential gene expression between female and male. (Wilcoxon test, pval<0.05) |
 |
| Cancer type | Translation factor | pval | adj.p |
| THYM | RPL22 | 0.0202969846704409 | 0.57 |
| SARC | RPL22 | 0.0254745401955233 | 0.69 |
Top |
|
| Differential gene expression between young and old age groups (Wilcoxon test, pval<0.05) |
 |
| Cancer type | Translation factor | pval | adj.p |
| KICH | RPL22 | 0.0361979454462499 | 1 |
| GBM | RPL22 | 0.0254865540856316 | 0.79 |
| LGG | RPL22 | 1.83116450201151e-07 | 6e-06 |
| BRCA | RPL22 | 0.0016620319551077 | 0.053 |
Top |
|
| Drugs targeting genes involved in this translation factor. (DrugBank Version 5.1.8 2021-05-08) |
| UniProtAcc | DrugBank ID | Drug name | Drug activity | Drug type | Drug status |
Top |
|
| Diseases associated with this translation factor. (DisGeNet 4.0) |
| Disease ID | Disease Name | # PubMeds | Disease source |
(UTHealth)
Web File Viewing | Emergency Information |Campus Carry|Site Policies