
|
||||||
|

Translation Factor: RPL36AL (NCBI Gene ID:6166) |
|
 Gene Summary Gene Summary |
| Gene Information | Gene Name: RPL36AL | Gene ID: 6166 | Gene Symbol | RPL36AL | Gene ID | 6166 |
| Gene Name | ribosomal protein L36a like | |
| Synonyms | RPL36A | |
| Cytomap | 14q21.3 | |
| Type of Gene | protein-coding | |
| Description | 60S ribosomal protein L36a-likelarge ribosomal subunit protein eL42-likeribosomal protein HL44 | |
| Modification date | 20200313 | |
| UniProtAcc | Q969Q0 | |
| Child GO biological process term(s) under GO:0006412 |
| GO ID | GO term |
| GO:0005840 | Ribosome |
| GO:0006412 | Translation |
| Gene ontology of translaction factor with evidence of Inferred from Direct Assay (IDA) from Entrez |
| Partner | Gene | GO ID | GO term | PubMed ID |
| Inferred gene age of translation factor. |
| Gene | Inferred gene age group among (0 - 67.6], (67.6 - 355.7], (355.7 - 733], (733 - 1119.25], >1119.25 |
| RPL36AL | >1119.25 |
Top |
|
| We searched PubMed using 'RPL36AL[title] AND translation [title] AND human.' |
| Gene | Title | PMID |
| RPL36AL | The CCA-end of P-tRNA Contacts Both the Human RPL36AL and the A-site Bound Translation Termination Factor eRF1 at the Peptidyl Transferase Center of the Human 80S Ribosome | 25191528 |
Top |
|
| Skipped exons in TCGA and GTEx based on Ensembl gene isoform structure. * Click on the image to open the UCSC genome browser with custom track showing this image in a new window. For more annotations, please visit our ExonSkipDB. |
 |
| Open reading frame (ORF) analsis of exon skipping events based on Ensembl gene isoform structure. * Click on the break point to see the gene structure around the break point region using the UCSC Genome Browser. |
| ENST | Exon skip start (DNA) | Exon Skip end (DNA) | ORF |
| Exon skipping position in the amino acid sequence. |
| ENST | Exon skip start (DNA) | Exon Skip end (DNA) | Len(transcript seq) | Exon skip start (mRNA) | Exon Skip end (mRNA) | Len(amino acid seq) | Exon skip start (AA) | Exon Skip end (AA) |
| Potentially (partially) lost protein functional features of UniProt. |
| UniProtAcc | Exon skip start (AA) | Exon Skip end (AA) | Function feature start (AA) | Function feature end (AA) | Functional feature type | Functional feature desc. |
Top |
|
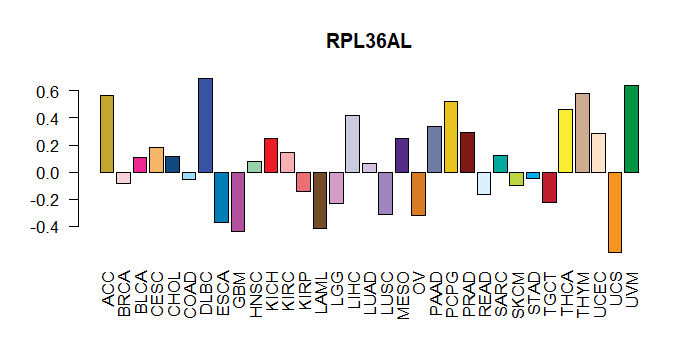
| Gene expression level across TCGA pancancer |
 |
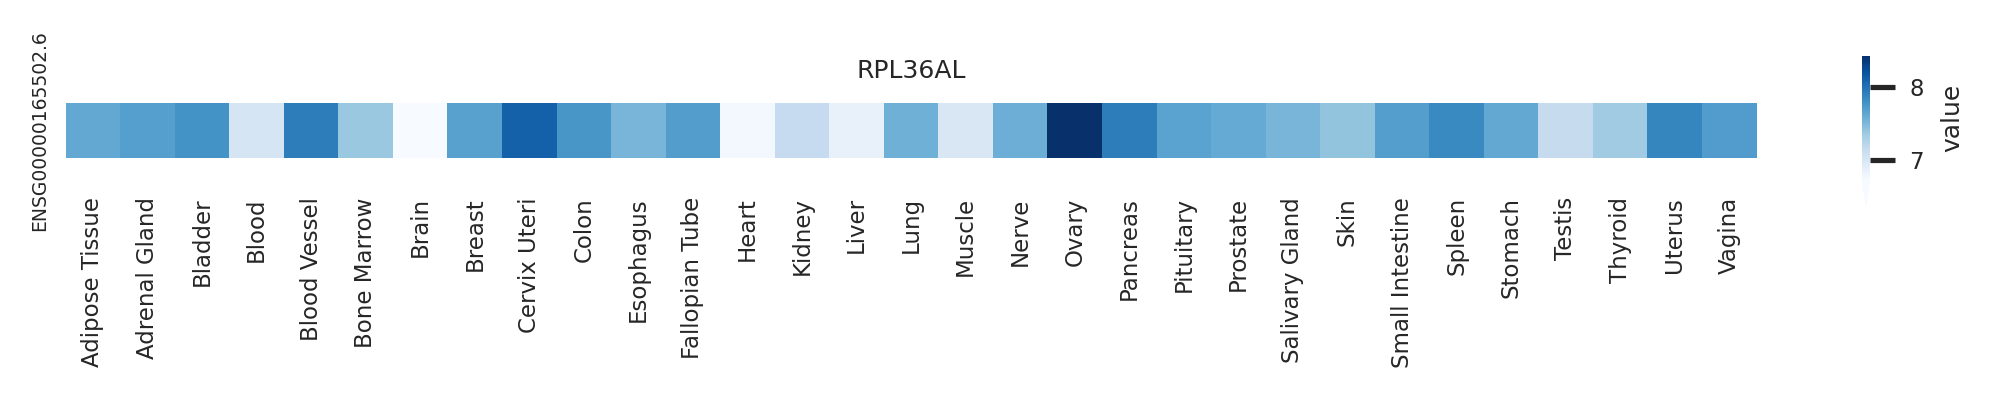
| Gene expression level across GTEx pantissue |
 |
| Expression level of gene isoforms across TCGA pancancer |
 |
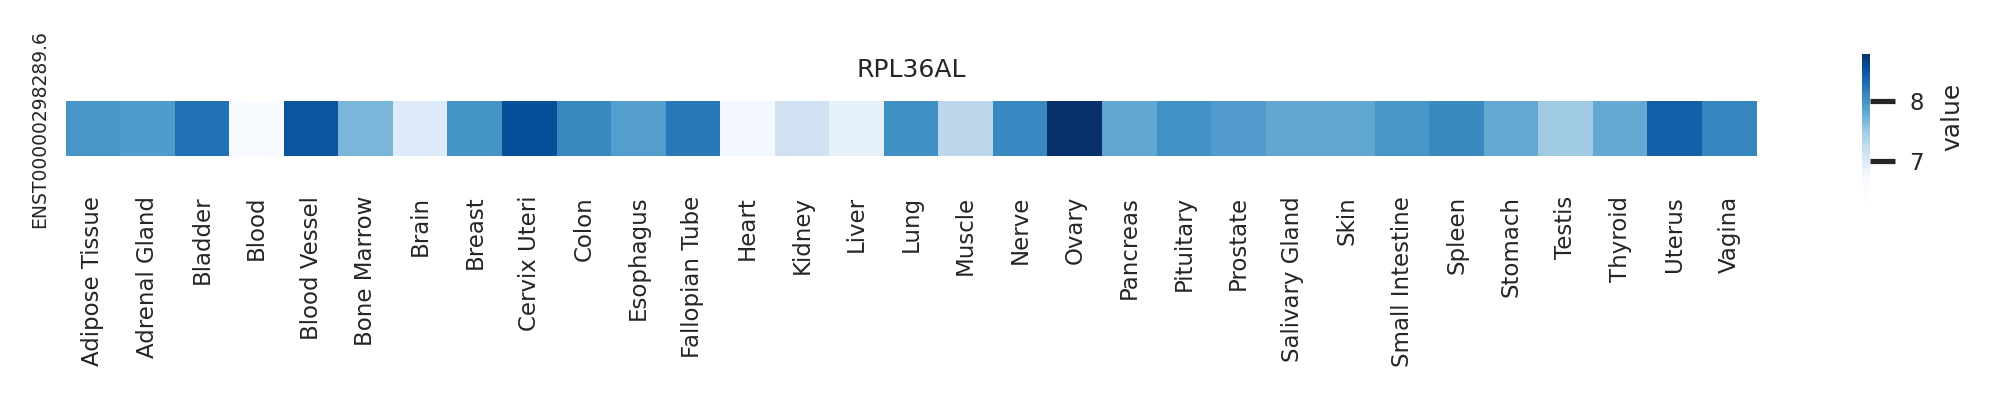
| Expression level of gene isoforms across GTEx pantissue |
 |
| Cancer(tissue) type-specific expression level of Translation factor using z-score distriution |
 |
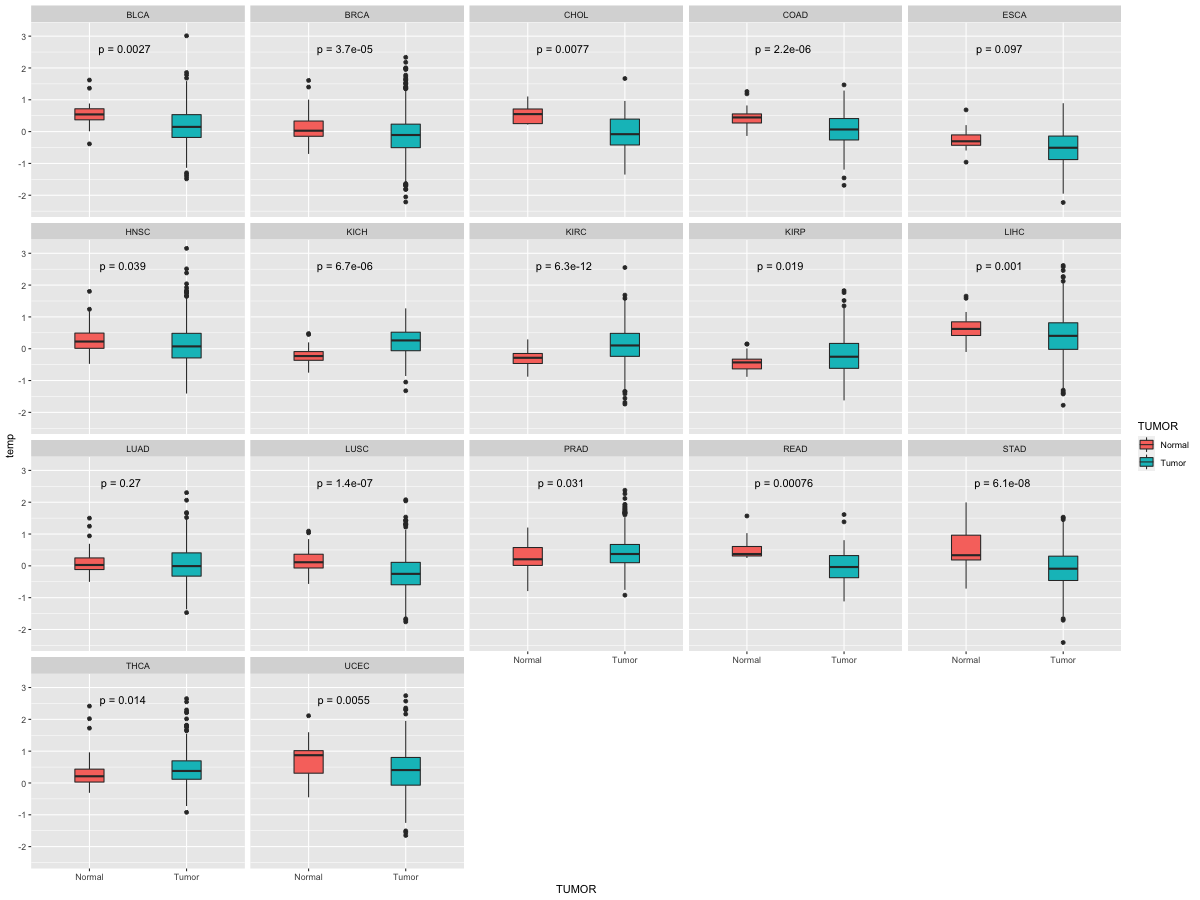
| Differential expression between tumor and matched normal (in the cancer types with more than 10 matched samples) |
 |
| Cancer type | Translation factor | FC | adj.pval |
| KIRC | RPL36AL | -6.25347183174259 | 0.000902380264885279 |
| BLCA | RPL36AL | -2.15718404153454 | 0.00391769409179688 |
| LIHC | RPL36AL | -1.01636355951308 | 0.00667634152888414 |
| COAD | RPL36AL | -4.57155487583486 | 0.00938254594802858 |
| ESCA | RPL36AL | 1.49722244666217 | 0.0322265625 |
| UCEC | RPL36AL | -1.24834751809083 | 0.046875 |
Top |
|
| Translation factor expression regulation through miRNA binding |
| Cancer type | Gene | miRNA | TargetScan binding score (Context++ score percentile) | Coefficient | Pvalue |
| Translation factor expression regulation through methylation in the promoter of Translation factor |
 |
| Cancer type | Gene | methyl group b | methyl group a | DEG pval | avg methyl in b | avg methyl in a | avg exp in b | avg exp in a |
| Translation factor expression regulation through methylation in the gene body of Translation factor (positive regulation) |
 |
| Cancer type | Gene | methyl group b | methyl group a | DEG pval | avg methyl in b | avg methyl in a | avg exp in b | avg exp in a |
| Translation factor expression regulation through copy number variation of Translation factor |
 |
| Cancer type | Gene | Coefficient | Pvalue |
| LGG | RPL36AL | 0.091884279 | 0.020303779 |
| ESCA | RPL36AL | -0.04347671 | 0.04321187 |
Top |
|
| Strongly correlated genes belong to cellular important gene groups with RPL36AL (coefficient>0.8, pval<0.05, node color based on FC between tumor and matched normal). Significantly associated important genes in the individual cancer types. * Cell metabolism gene: cell metabolism genes from REACTOME (black edge), IUPHAR: drug target genes from IUPHAR (blue edge), Kinase: human kinase genes (brown edge), CGC: cancer gene census genes (orange edge), TSG: tumor suppresor genes (purple edge), Epifactor: epigenetic factors (light blue edge), TF: transcription factors (green) |
 |
| Cancer type | Gene group | Translation factor | Correlated gene | Coefficient | Pvalue |
| DLBC | Cell metabolism gene | RPL36AL | B3GAT3 | 0.804213657 | 5.80E-12 |
| DLBC | Cell metabolism gene | RPL36AL | PSMB4 | 0.8080678 | 3.84E-12 |
| DLBC | Cell metabolism gene | RPL36AL | PSMD13 | 0.809650144 | 3.23E-12 |
| DLBC | Cell metabolism gene | RPL36AL | MED27 | 0.811252142 | 2.71E-12 |
| DLBC | Cell metabolism gene | RPL36AL | PSMC1 | 0.811425466 | 2.66E-12 |
| DLBC | Cell metabolism gene | RPL36AL | PHPT1 | 0.812634588 | 2.33E-12 |
| DLBC | Cell metabolism gene | RPL36AL | ACOT8 | 0.814998368 | 1.79E-12 |
| DLBC | Cell metabolism gene | RPL36AL | TOMM7 | 0.81681702 | 1.45E-12 |
| DLBC | Cell metabolism gene | RPL36AL | POLR2I | 0.818370131 | 1.22E-12 |
| DLBC | Cell metabolism gene | RPL36AL | SAT2 | 0.818699177 | 1.17E-12 |
| DLBC | Cell metabolism gene | RPL36AL | PSMC5 | 0.827240404 | 4.26E-13 |
| DLBC | Cell metabolism gene | RPL36AL | TIMM9 | 0.830225551 | 2.95E-13 |
| DLBC | Cell metabolism gene | RPL36AL | PSMD4 | 0.836759383 | 1.29E-13 |
| DLBC | Cell metabolism gene | RPL36AL | PSMB3 | 0.839081626 | 9.52E-14 |
| DLBC | Cell metabolism gene | RPL36AL | DPM2 | 0.839101947 | 9.49E-14 |
| DLBC | Cell metabolism gene | RPL36AL | PHKG2 | 0.857316034 | 7.36E-15 |
| DLBC | Cell metabolism gene | RPL36AL | POLE4 | 0.865691225 | 2.01E-15 |
| DLBC | Cell metabolism gene | RPL36AL | DGUOK | 0.869040654 | 1.17E-15 |
| DLBC | Cell metabolism gene | RPL36AL | FAU | 0.874790162 | 4.44E-16 |
| DLBC | Cell metabolism gene | RPL36AL | PFDN5 | 0.896518092 | 7.05E-18 |
| DLBC | CGC | RPL36AL | TFPT | 0.814524804 | 1.88E-12 |
| DLBC | CGC | RPL36AL | SDHAF2 | 0.844053842 | 4.89E-14 |
| DLBC | Epifactor | RPL36AL | TFPT | 0.814524804 | 1.88E-12 |
| DLBC | Epifactor | RPL36AL | BRMS1 | 0.848551852 | 2.63E-14 |
| DLBC | Epifactor | RPL36AL | ZNHIT1 | 0.862533855 | 3.31E-15 |
| DLBC | Epifactor | RPL36AL | TAF10 | 0.86639163 | 1.80E-15 |
| DLBC | IUPHAR | RPL36AL | PHKG2 | 0.857316034 | 7.36E-15 |
| DLBC | Kinase | RPL36AL | PHKG2 | 0.857316034 | 7.36E-15 |
| DLBC | TF | RPL36AL | THAP7 | 0.823950926 | 6.32E-13 |
| DLBC | TF | RPL36AL | THAP3 | 0.824976304 | 5.59E-13 |
| DLBC | TSG | RPL36AL | BRMS1 | 0.848551852 | 2.63E-14 |
| DLBC | TSG | RPL36AL | GADD45GIP1 | 0.85241454 | 1.51E-14 |
| DLBC | TSG | RPL36AL | TSSC4 | 0.8555816 | 9.53E-15 |
| MESO | Cell metabolism gene | RPL36AL | TIMM9 | 0.814287075 | 8.78E-22 |
| PRAD | Cell metabolism gene | RPL36AL | PFDN5 | 0.800942675 | 3.59E-124 |
| THYM | Cell metabolism gene | RPL36AL | GFER | 0.802309367 | 1.16E-28 |
| THYM | Cell metabolism gene | RPL36AL | SEC61G | 0.803699017 | 7.94E-29 |
| THYM | Cell metabolism gene | RPL36AL | IDH3G | 0.804959823 | 5.61E-29 |
| THYM | Cell metabolism gene | RPL36AL | SNRPD3 | 0.806054341 | 4.15E-29 |
| THYM | Cell metabolism gene | RPL36AL | POLR2H | 0.80687688 | 3.30E-29 |
| THYM | Cell metabolism gene | RPL36AL | TIMM50 | 0.815786795 | 2.58E-30 |
| THYM | Cell metabolism gene | RPL36AL | TIMM13 | 0.816640541 | 2.00E-30 |
| THYM | Cell metabolism gene | RPL36AL | GUK1 | 0.820865578 | 5.66E-31 |
| THYM | Cell metabolism gene | RPL36AL | ACOT8 | 0.821129472 | 5.23E-31 |
| THYM | Cell metabolism gene | RPL36AL | TIMM8B | 0.824392546 | 1.92E-31 |
| THYM | Cell metabolism gene | RPL36AL | PSMC1 | 0.825896752 | 1.20E-31 |
| THYM | Cell metabolism gene | RPL36AL | TIMM9 | 0.828937151 | 4.60E-32 |
| THYM | Cell metabolism gene | RPL36AL | PSMB7 | 0.831852491 | 1.80E-32 |
| THYM | Cell metabolism gene | RPL36AL | DPM2 | 0.833728367 | 9.73E-33 |
| THYM | Cell metabolism gene | RPL36AL | PSMB3 | 0.834138206 | 8.50E-33 |
| THYM | Cell metabolism gene | RPL36AL | TOMM7 | 0.83564586 | 5.15E-33 |
| THYM | Cell metabolism gene | RPL36AL | SLC27A5 | 0.838665703 | 1.86E-33 |
| THYM | Cell metabolism gene | RPL36AL | PSMB1 | 0.840267879 | 1.08E-33 |
| THYM | Cell metabolism gene | RPL36AL | APRT | 0.840351558 | 1.05E-33 |
| THYM | Cell metabolism gene | RPL36AL | SSR2 | 0.843394816 | 3.63E-34 |
| THYM | Cell metabolism gene | RPL36AL | DPM3 | 0.844078463 | 2.85E-34 |
| THYM | Cell metabolism gene | RPL36AL | POLR2I | 0.848022627 | 6.93E-35 |
| THYM | Cell metabolism gene | RPL36AL | POLR2J | 0.857137723 | 2.25E-36 |
| THYM | Cell metabolism gene | RPL36AL | SNRPD2 | 0.861578468 | 3.89E-37 |
| THYM | Cell metabolism gene | RPL36AL | PGLS | 0.864465771 | 1.20E-37 |
| THYM | Cell metabolism gene | RPL36AL | POLR2F | 0.865563725 | 7.63E-38 |
| THYM | Cell metabolism gene | RPL36AL | FAU | 0.887484745 | 3.45E-42 |
| THYM | Cell metabolism gene | RPL36AL | PFDN5 | 0.896269923 | 3.44E-44 |
| THYM | CGC | RPL36AL | TFPT | 0.835767152 | 4.95E-33 |
| THYM | Epifactor | RPL36AL | INO80E | 0.806554563 | 3.61E-29 |
| THYM | Epifactor | RPL36AL | FBL | 0.816491072 | 2.09E-30 |
| THYM | Epifactor | RPL36AL | C17orf49 | 0.825656945 | 1.30E-31 |
| THYM | Epifactor | RPL36AL | PRPF31 | 0.826754635 | 9.18E-32 |
| THYM | Epifactor | RPL36AL | BRMS1 | 0.832308272 | 1.55E-32 |
| THYM | Epifactor | RPL36AL | TFPT | 0.835767152 | 4.95E-33 |
| THYM | Epifactor | RPL36AL | SIRT6 | 0.837099508 | 3.17E-33 |
| THYM | Epifactor | RPL36AL | ZNHIT1 | 0.860809152 | 5.30E-37 |
| THYM | Epifactor | RPL36AL | TAF10 | 0.860847549 | 5.22E-37 |
| THYM | Epifactor | RPL36AL | CCDC101 | 0.861797317 | 3.56E-37 |
| THYM | IUPHAR | RPL36AL | MMP24 | 0.810972823 | 1.04E-29 |
| THYM | IUPHAR | RPL36AL | SIRT3 | 0.813318455 | 5.30E-30 |
| THYM | IUPHAR | RPL36AL | SIRT6 | 0.837099508 | 3.17E-33 |
| THYM | IUPHAR | RPL36AL | SLC27A5 | 0.838665703 | 1.86E-33 |
| THYM | IUPHAR | RPL36AL | PSMB1 | 0.840267879 | 1.08E-33 |
| THYM | TF | RPL36AL | ZNF428 | 0.810000987 | 1.37E-29 |
| THYM | TF | RPL36AL | THAP7 | 0.810328616 | 1.25E-29 |
| THYM | TF | RPL36AL | ZNF32 | 0.821666001 | 4.44E-31 |
| THYM | TF | RPL36AL | THAP3 | 0.821681433 | 4.42E-31 |
| THYM | TF | RPL36AL | DRAP1 | 0.822061029 | 3.93E-31 |
| THYM | TF | RPL36AL | ZNF524 | 0.850884017 | 2.42E-35 |
| THYM | TSG | RPL36AL | GLTSCR2 | 0.813261341 | 5.38E-30 |
| THYM | TSG | RPL36AL | SIRT3 | 0.813318455 | 5.30E-30 |
| THYM | TSG | RPL36AL | TSSC4 | 0.820118883 | 7.10E-31 |
| THYM | TSG | RPL36AL | BRMS1 | 0.832308272 | 1.55E-32 |
| THYM | TSG | RPL36AL | SIRT6 | 0.837099508 | 3.17E-33 |
| THYM | TSG | RPL36AL | NPRL2 | 0.841287906 | 7.57E-34 |
| THYM | TSG | RPL36AL | GNB2L1 | 0.843405456 | 3.61E-34 |
| THYM | TSG | RPL36AL | GABARAP | 0.849919253 | 3.46E-35 |
| THYM | TSG | RPL36AL | GADD45GIP1 | 0.862694935 | 2.48E-37 |
| UCS | Cell metabolism gene | RPL36AL | GFER | 0.802309367 | 1.16E-28 |
| UCS | Cell metabolism gene | RPL36AL | SEC61G | 0.803699017 | 7.94E-29 |
| UCS | Cell metabolism gene | RPL36AL | IDH3G | 0.804959823 | 5.61E-29 |
| UCS | Cell metabolism gene | RPL36AL | SNRPD3 | 0.806054341 | 4.15E-29 |
| UCS | Cell metabolism gene | RPL36AL | POLR2H | 0.80687688 | 3.30E-29 |
| UCS | Cell metabolism gene | RPL36AL | TIMM50 | 0.815786795 | 2.58E-30 |
| UCS | Cell metabolism gene | RPL36AL | TIMM13 | 0.816640541 | 2.00E-30 |
| UCS | Cell metabolism gene | RPL36AL | GUK1 | 0.820865578 | 5.66E-31 |
| UCS | Cell metabolism gene | RPL36AL | ACOT8 | 0.821129472 | 5.23E-31 |
| UCS | Cell metabolism gene | RPL36AL | TIMM8B | 0.824392546 | 1.92E-31 |
| UCS | Cell metabolism gene | RPL36AL | PSMC1 | 0.825896752 | 1.20E-31 |
| UCS | Cell metabolism gene | RPL36AL | TIMM9 | 0.828937151 | 4.60E-32 |
| UCS | Cell metabolism gene | RPL36AL | PSMB7 | 0.831852491 | 1.80E-32 |
| UCS | Cell metabolism gene | RPL36AL | DPM2 | 0.833728367 | 9.73E-33 |
| UCS | Cell metabolism gene | RPL36AL | PSMB3 | 0.834138206 | 8.50E-33 |
| UCS | Cell metabolism gene | RPL36AL | TOMM7 | 0.83564586 | 5.15E-33 |
| UCS | Cell metabolism gene | RPL36AL | SLC27A5 | 0.838665703 | 1.86E-33 |
| UCS | Cell metabolism gene | RPL36AL | PSMB1 | 0.840267879 | 1.08E-33 |
| UCS | Cell metabolism gene | RPL36AL | APRT | 0.840351558 | 1.05E-33 |
| UCS | Cell metabolism gene | RPL36AL | SSR2 | 0.843394816 | 3.63E-34 |
| UCS | Cell metabolism gene | RPL36AL | DPM3 | 0.844078463 | 2.85E-34 |
| UCS | Cell metabolism gene | RPL36AL | POLR2I | 0.848022627 | 6.93E-35 |
| UCS | Cell metabolism gene | RPL36AL | POLR2J | 0.857137723 | 2.25E-36 |
| UCS | Cell metabolism gene | RPL36AL | SNRPD2 | 0.861578468 | 3.89E-37 |
| UCS | Cell metabolism gene | RPL36AL | PGLS | 0.864465771 | 1.20E-37 |
| UCS | Cell metabolism gene | RPL36AL | POLR2F | 0.865563725 | 7.63E-38 |
| UCS | Cell metabolism gene | RPL36AL | FAU | 0.887484745 | 3.45E-42 |
| UCS | Cell metabolism gene | RPL36AL | PFDN5 | 0.896269923 | 3.44E-44 |
| UCS | CGC | RPL36AL | TFPT | 0.835767152 | 4.95E-33 |
| UCS | Epifactor | RPL36AL | INO80E | 0.806554563 | 3.61E-29 |
| UCS | Epifactor | RPL36AL | FBL | 0.816491072 | 2.09E-30 |
| UCS | Epifactor | RPL36AL | C17orf49 | 0.825656945 | 1.30E-31 |
| UCS | Epifactor | RPL36AL | PRPF31 | 0.826754635 | 9.18E-32 |
| UCS | Epifactor | RPL36AL | BRMS1 | 0.832308272 | 1.55E-32 |
| UCS | Epifactor | RPL36AL | TFPT | 0.835767152 | 4.95E-33 |
| UCS | Epifactor | RPL36AL | SIRT6 | 0.837099508 | 3.17E-33 |
| UCS | Epifactor | RPL36AL | ZNHIT1 | 0.860809152 | 5.30E-37 |
| UCS | Epifactor | RPL36AL | TAF10 | 0.860847549 | 5.22E-37 |
| UCS | Epifactor | RPL36AL | CCDC101 | 0.861797317 | 3.56E-37 |
| UCS | IUPHAR | RPL36AL | MMP24 | 0.810972823 | 1.04E-29 |
| UCS | IUPHAR | RPL36AL | SIRT3 | 0.813318455 | 5.30E-30 |
| UCS | IUPHAR | RPL36AL | SIRT6 | 0.837099508 | 3.17E-33 |
| UCS | IUPHAR | RPL36AL | SLC27A5 | 0.838665703 | 1.86E-33 |
| UCS | IUPHAR | RPL36AL | PSMB1 | 0.840267879 | 1.08E-33 |
| UCS | TF | RPL36AL | ZNF428 | 0.810000987 | 1.37E-29 |
| UCS | TF | RPL36AL | THAP7 | 0.810328616 | 1.25E-29 |
| UCS | TF | RPL36AL | ZNF32 | 0.821666001 | 4.44E-31 |
| UCS | TF | RPL36AL | THAP3 | 0.821681433 | 4.42E-31 |
| UCS | TF | RPL36AL | DRAP1 | 0.822061029 | 3.93E-31 |
| UCS | TF | RPL36AL | ZNF524 | 0.850884017 | 2.42E-35 |
| UCS | TSG | RPL36AL | GLTSCR2 | 0.813261341 | 5.38E-30 |
| UCS | TSG | RPL36AL | SIRT3 | 0.813318455 | 5.30E-30 |
| UCS | TSG | RPL36AL | TSSC4 | 0.820118883 | 7.10E-31 |
| UCS | TSG | RPL36AL | BRMS1 | 0.832308272 | 1.55E-32 |
| UCS | TSG | RPL36AL | SIRT6 | 0.837099508 | 3.17E-33 |
| UCS | TSG | RPL36AL | NPRL2 | 0.841287906 | 7.57E-34 |
| UCS | TSG | RPL36AL | GNB2L1 | 0.843405456 | 3.61E-34 |
| UCS | TSG | RPL36AL | GABARAP | 0.849919253 | 3.46E-35 |
| UCS | TSG | RPL36AL | GADD45GIP1 | 0.862694935 | 2.48E-37 |
Top |
|
| Protein 3D structure Visit iCn3D. |
Top |
|
| Protein-protein interaction networks * Overlap between up-regulated DEGs (log2FC<-1 and adj.P<0.05) and STRING PPI network (center: Translation factor, node: DEGs, edges: weighted by -log2(adj.P)) |
 |
| Overlap between down-regulated DEGs (log2FC>1 and adj.P<0.05) and STRING PPI network (center: Translation factor, node: DEGs, edges: weighted by -log2(adj.P)) |
 |
 * Edge colors based on TCGA cancer types. |
| * Overlap between DEGs (log2FC>1 and adj.P<0.05) and STRING PPI network per cancer (center: Translation factor, node: DEGs, node color: log2FC, edges: weighted by -log2(adj.P)) |
 |
| Cancer type | Translation factor | Interacting protein coding gene | FC | adj.pval |
| BLCA | RPL36AL | RPL10A | -6.44657805140652 | 0.000164031982421875 |
| KICH | RPL36AL | RPS17 | -9.74128123960814 | 0.000556409358978271 |
| PRAD | RPL36AL | RPL12 | 1.03140367520778 | 0.0008447947014615 |
| PRAD | RPL36AL | RPS15 | 2.38682220239643 | 0.000931746432967977 |
| KIRP | RPL36AL | RPS11 | -1.01861570565103 | 0.00105937570333481 |
| KICH | RPL36AL | RPL19 | 1.36901182894089 | 0.00250792503356934 |
| HNSC | RPL36AL | RPS17 | -1.41932406270792 | 0.00608886057921154 |
| LUSC | RPL36AL | RPS15 | -1.54018132537089 | 0.00665527288479679 |
| LUAD | RPL36AL | RPL19 | -1.31398026615725 | 0.00993159558412698 |
| BLCA | RPL36AL | RPL12 | -3.6124920986454 | 0.012359619140625 |
| KICH | RPL36AL | RPL10A | 1.57107790372051 | 0.0124664902687073 |
| HNSC | RPL36AL | RPL12 | 1.31949815918867 | 0.0149245594448075 |
| THCA | RPL36AL | FAU | 1.18509450470262 | 0.0152379297688856 |
| KIRP | RPL36AL | FAU | -1.04355048353271 | 0.0309218638576567 |
| COAD | RPL36AL | RPS11 | 1.35307548998204 | 0.0312207043170929 |
| LUSC | RPL36AL | RPL19 | -2.14669889516666 | 0.044366810398747 |
| KIRC | RPL36AL | RPS17 | -1.14106059335771 | 1.12651178935203e-06 |
| KIRP | RPL36AL | RPL12 | -2.07599071662134 | 1.26352533698082e-05 |
| KIRC | RPL36AL | FAU | -2.50135425883801 | 1.33253564327251e-08 |
| KIRC | RPL36AL | RPL19 | -2.73485271276676 | 1.33980982873695e-10 |
| LUAD | RPL36AL | RPL30 | -1.98579595284099 | 1.50488235365288e-05 |
| KIRC | RPL36AL | RPL35A | -2.33246813425378 | 3.7449081319937e-09 |
| BRCA | RPL36AL | RPL12 | -2.15215406494599 | 4.57396841975666e-06 |
| THCA | RPL36AL | RPL12 | 1.7343782363164 | 5.23308492993332e-06 |
| KIRC | RPL36AL | RPL10A | -2.3455028090226 | 5.61779186490163e-09 |
| KIRC | RPL36AL | RPL11 | -5.47536848868151 | 6.13619476098216e-10 |
| KIRC | RPL36AL | RPS15 | -1.51134139657827 | 6.64395189280361e-09 |
| KIRC | RPL36AL | RPL12 | -2.90541430500864 | 8.74519390827313e-10 |
| KIRP | RPL36AL | RPS15 | -1.53644743209735 | 9.0546440333128e-05 |
| LUSC | RPL36AL | RPL30 | -2.27386662283158 | 9.09971457907932e-05 |
| KIRC | RPL36AL | RPL30 | -1.65763742142219 | 9.40007073737459e-12 |
| Protein-protein interactors with this translation factor (BIOGRID-3.4.160) |
| PPI interactors with RPL36AL |
| GSK3B, C7orf25, TAF1D, ESR1, ESR2, UBL4A, KRTAP10-7, HIST1H1A, RPL10A, RPL14, ZNF22, DRICH1, DHX8, NPM1, ZC3H3, NAP1L1, MRPS30, RPL35A, RPL27A, RPL3, RPS15, RPS27, HSPB2, KIF11, CDH1, CDC14B, DUSP11, FAN1, PTP4A1, RBM34, HIST1H1T, E4F1, SET, ZNF71, ZNF490, RBM4, IKZF5, RPL37A, BHLHA15, RSBN1, RPS7, RPS14, ZBTB48, PDGFB, CDX1, RPL7, MDK, CLEC3A, CCDC59, MRPL10, PTPN6, RNGTT, TRIM25, LNX1, GSK3A, PYHIN1, RIOK1, HEXIM1, MEPCE, LARP7, AGR2, NRAS, RC3H1, RC3H2, NR2C2, SNRNP70, WWP2, OBSL1, PLEKHA4, HCVgp1, ZC3H18, SH3GL3, E, M, nsp13, nsp14, nsp4, nsp5, nsp6, ORF3a, ORF7a, S, ANLN, ECT2, KIF14, KIF20A, PRC1, MKI67, MAFB, NR3C1, CIAO1, NF2, SUV420H2, TRIM37, UFL1, DDRGK1, SKA3, ZBTB2, LLPH, LYAR, VPRBP, PDCD11, HNRNPCL1, RPL4, PRKRA, MRPL18, KRR1, ADARB1, H1FNT, SRSF5, RPS19, RPS3, HIST1H1B, ZBTB47, RPL11, RPL7A, RPL13A, NOP2, NOTCH2, FGF13, CCDC137, SRP14, DGKZ, YBX2, RPL26L1, MAGEB2, RPL19, RPL23A, SHCBP1, LRP1B, LTBP2, YBX1, KAL1, SDAD1, GNL3, RPS16, MRPL13, ILF3, RPL35, DDX21, EZH1, LIN28B, RPL26, RPL28, TNFRSF1B, RPSAP58, HIST1H2AM, TRIM41, UTP23, HIST1H1D, FGF17, LIN28A, THAP3, FGFBP1, RPS13, RPS10, SORL1, RPL31, SEMA3C, H2AFB2, ABT1, RBM28, RPL36, H2AFB3, GNL2, SRPK3, PURG, COL2A1, SETD6, RPF1, RPLP0, MPHOSPH10, NIFK, MRPL40, ZNF768, NUDT13, AATF, MRPL53, MRPL30, MRPL51, ZFP91, WDR53, RBM4B, LUC7L, ZC3H10, C1orf35, MRPS2, LTV1, ZNF574, HJURP, NDUFAF5, GADD45GIP1, LRRC1, MRPL3, RRP12, GLYR1, NOP10, RPS6, FTSJ1, REXO4, MRPS24, KRI1, MRPS34, RPS8, GAR1, RPS4Y2, SURF6, MRPS25, KNOP1, UTP3, PRR3, SNX7, H2AFZ, MRPS7, HIST1H1E, MAS1L, CTCF, MRPL16, RPL17, RPL15, DDX24, NPM3, MAK16, RPL27, PPM1G, DICER1, HIST1H2AE, MRPL52, FTL, RPL18A, C8orf33, MRPS5, MRPS9, MRPS11, LARP1B, KBTBD7, CBX6, POP1, ZC3HAV1, ZCRB1, CHERP, IPO7, PTCD3, STAU1, U2SURP, RPL8, MRPS10, UBE2O, IPO5, ZNF512, RPL30, NRD1, OR2A4, MAP7D1, MRPL28, LARP1, MDM2, MRPL35, MRPL46, RPL5, MRPS26, NAP1L4, OSBPL3, KBTBD6, APOBEC3D, SRSF12, RPS27A, MRPL24, DGCR8, NOL10, MRPS33, BTF3, PRPF6, Hnrnpf, Rbm14, Nufip2, NHLH1, KLF15, KLF3, KLF16, KLF8, |
Top |
|
| Clinically associated variants from ClinVar. |
| Gene | Chr | Position | RefSeq | VarSeq | RefSeeq | VarType | Pathogenic | Disease | VarInfo |
| nsSNVs with sample frequency (size of circle) from TCGA 33 cancers. |
 |
| SNVs and Indels |
| Gene | Cancer type | Chromosome | Start | End | RefSeeq | MutSeq | Mutation type | AAchange | # samples |
| RPL36AL | ESCA | chr14 | 50085611 | 50085611 | T | C | Missense_Mutation | p.E71G | 2 |
| RPL36AL | THCA | chr14 | 50085726 | 50085726 | A | C | Missense_Mutation | p.L33V | 2 |
| RPL36AL | ESCA | chr14 | 50085611 | 50085611 | T | C | Missense_Mutation | 2 | |
| RPL36AL | UCEC | chr14 | 50085520 | 50085520 | G | A | Silent | p.G101 | 2 |
| RPL36AL | UCEC | chr14 | 50085653 | 50085653 | C | T | Missense_Mutation | p.R57Q | 2 |
| RPL36AL | UVM | chr14 | 50085633 | 50085633 | T | C | Missense_Mutation | 2 | |
| RPL36AL | UVM | chr14 | 50085633 | 50085633 | T | C | Missense_Mutation | p.K64E | 2 |
| RPL36AL | SKCM | chr14 | 50085510 | 50085510 | G | T | Missense_Mutation | p.Q105K | 1 |
| RPL36AL | THCA | chr14 | 50085726 | 50085726 | A | C | Missense_Mutation | 1 | |
| RPL36AL | THCA | chr14 | 50085726 | 50085726 | A | C | Missense_Mutation | p.Q33E | 1 |
| RPL36AL | THYM | chr14 | 50085586 | 50085586 | G | T | Silent | 1 | |
| RPL36AL | ESCA | chr14 | 50085611 | 50085611 | T | C | Missense_Mutation | p.K71R | 1 |
| RPL36AL | THYM | chr14 | 50085586 | 50085586 | G | T | Silent | p.K79K | 1 |
| RPL36AL | LIHC | chr14 | 50085753 | 50085753 | T | C | Missense_Mutation | 1 | |
| RPL36AL | LUAD | chr14 | 50085644 | 50085644 | G | C | Missense_Mutation | p.A60G | 1 |
| RPL36AL | MESO | chr14 | 50085831 | 50085831 | C | A | Missense_Mutation | 1 | |
| RPL36AL | PRAD | chr14 | 50085776 | 50085776 | C | T | Missense_Mutation | p.G16D | 1 |
| RPL36AL | UVM | chr14 | 50085633 | 50085633 | T | C | Missense_Mutation | p.M64V | 1 |
| RPL36AL | SKCM | chr14 | 50085802 | 50085802 | G | A | Silent | p.T7T | 1 |
| Copy number variation (CNV) of RPL36AL * Click on the image to open the original image in a new window. |
 |
| Fusion gene breakpoints (product of the structural variants (SVs)) across RPL36AL * Click on the image to open the UCSC genome browser with custom track showing this image in a new window. |
 |
| Fusion genes with this translation factor from FusionGDB2.0. |
| FusionGDB2 ID | Disease | Sample | Hgene | Hchr | Hbp | Hstrand | Tgene | Tchr | Tbp | Tstrand |
| 97558 | N/A | FN171668 | AHCYL1 | chr1 | 110564371 | - | RPL36AL | chr14 | 50085436 | - |
| 97558 | N/A | BI494273 | RELL1 | chr4 | 37632648 | + | RPL36AL | chr14 | 50085406 | + |
| 76608 | BLCA | TCGA-DK-A2I2-01A | RPL36AL | chr14 | 50087280 | - | MAP4K5 | chr14 | 50923312 | - |
| 96651 | N/A | BI494274 | RPL36AL | chr14 | 50085406 | - | UGGT2 | chr13 | 96631795 | + |
| 97558 | UCEC | TCGA-AP-A5FX-01A | RPS29 | chr14 | 50052668 | - | RPL36AL | chr14 | 50085858 | - |
| 97559 | N/A | BF878159 | USP4 | chr3 | 49321802 | + | RPL36AL | chr14 | 50085758 | - |
Top |
|
| Kaplan-Meier plots with logrank tests of overall survival (OS) |
 |
| Cancer type | Translation factor | Coefficent | Hazard ratio | Wald test pval | Likelihool ratio pval | Logrank test pval | # samples |
Top |
|
| Differential gene expression between female and male. (Wilcoxon test, pval<0.05) |
 |
| Cancer type | Translation factor | pval | adj.p |
| BLCA | RPL36AL | 0.00608662629032561 | 0.17 |
| STAD | RPL36AL | 0.0245962297187371 | 0.66 |
Top |
|
| Differential gene expression between young and old age groups (Wilcoxon test, pval<0.05) |
 |
| Cancer type | Translation factor | pval | adj.p |
| LIHC | RPL36AL | 0.0108239225394136 | 0.36 |
| LUAD | RPL36AL | 0.0110748275827441 | 0.36 |
| CESC | RPL36AL | 0.0407172397860567 | 1 |
| PCPG | RPL36AL | 0.0341586886066028 | 1 |
Top |
|
| Drugs targeting genes involved in this translation factor. (DrugBank Version 5.1.8 2021-05-08) |
| UniProtAcc | DrugBank ID | Drug name | Drug activity | Drug type | Drug status |
Top |
|
| Diseases associated with this translation factor. (DisGeNet 4.0) |
| Disease ID | Disease Name | # PubMeds | Disease source |
(UTHealth)
Web File Viewing | Emergency Information |Campus Carry|Site Policies