
|
||||||
|

Translation Factor: RPL41 (NCBI Gene ID:6171) |
|
 Gene Summary Gene Summary |
| Gene Information | Gene Name: RPL41 | Gene ID: 6171 | Gene Symbol | RPL41 | Gene ID | 6171 |
| Gene Name | ribosomal protein L41 | |
| Synonyms | L41 | |
| Cytomap | 12q13.2 | |
| Type of Gene | protein-coding | |
| Description | 60S ribosomal protein L41HG12 proteinhomologue of yeast ribosomal protein YL41large ribosomal subunit protein eL41 | |
| Modification date | 20200313 | |
| UniProtAcc | P62945 | |
| Child GO biological process term(s) under GO:0006412 |
| GO ID | GO term |
| GO:0005840 | Ribosome |
| GO:0002181 | Cytoplasmic translation |
| GO:0006412 | Translation |
| Gene ontology of translaction factor with evidence of Inferred from Direct Assay (IDA) from Entrez |
| Partner | Gene | GO ID | GO term | PubMed ID |
| Hgene | RPL41 | GO:0002181 | cytoplasmic translation | 25957688 |
| Inferred gene age of translation factor. |
| Gene | Inferred gene age group among (0 - 67.6], (67.6 - 355.7], (355.7 - 733], (733 - 1119.25], >1119.25 |
Top |
|
| We searched PubMed using 'RPL41[title] AND translation [title] AND human.' |
| Gene | Title | PMID |
| RPL41 | . | . |
Top |
|
| Skipped exons in TCGA and GTEx based on Ensembl gene isoform structure. * Click on the image to open the UCSC genome browser with custom track showing this image in a new window. For more annotations, please visit our ExonSkipDB. |
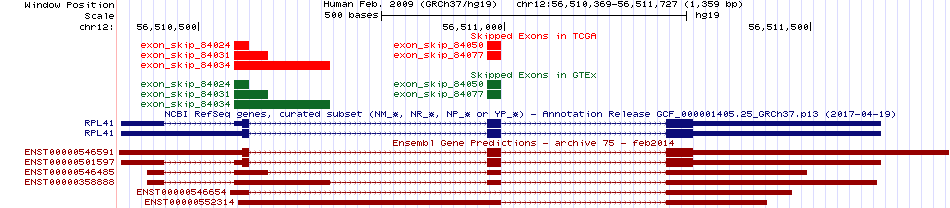 |
| Open reading frame (ORF) analsis of exon skipping events based on Ensembl gene isoform structure. * Click on the break point to see the gene structure around the break point region using the UCSC Genome Browser. |
| ENST | Exon skip start (DNA) | Exon Skip end (DNA) | ORF |
| ENST00000501597 | 56510558 | 56510583 | 5CDS-5UTR |
| ENST00000501597 | 56510972 | 56510995 | Frame-shift |
| Exon skipping position in the amino acid sequence. |
| ENST | Exon skip start (DNA) | Exon Skip end (DNA) | Len(transcript seq) | Exon skip start (mRNA) | Exon Skip end (mRNA) | Len(amino acid seq) | Exon skip start (AA) | Exon Skip end (AA) |
| Potentially (partially) lost protein functional features of UniProt. |
| UniProtAcc | Exon skip start (AA) | Exon Skip end (AA) | Function feature start (AA) | Function feature end (AA) | Functional feature type | Functional feature desc. |
Top |
|
| Gene expression level across TCGA pancancer |
 |
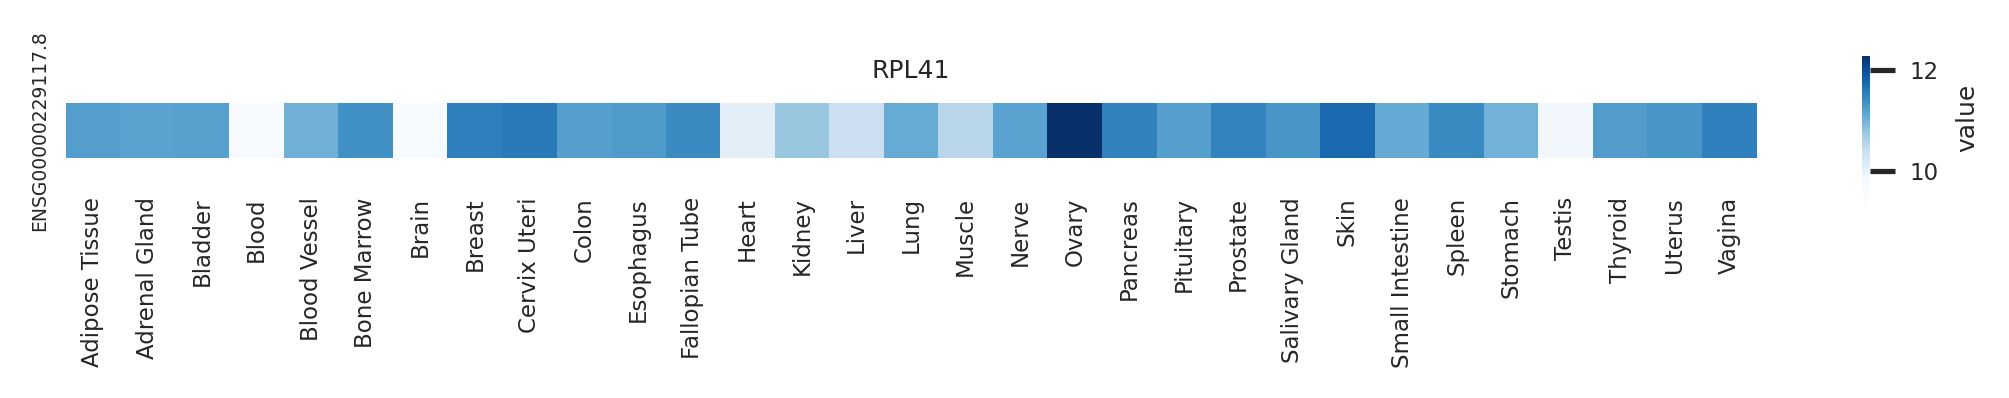
| Gene expression level across GTEx pantissue |
 |
| Expression level of gene isoforms across TCGA pancancer |
 |
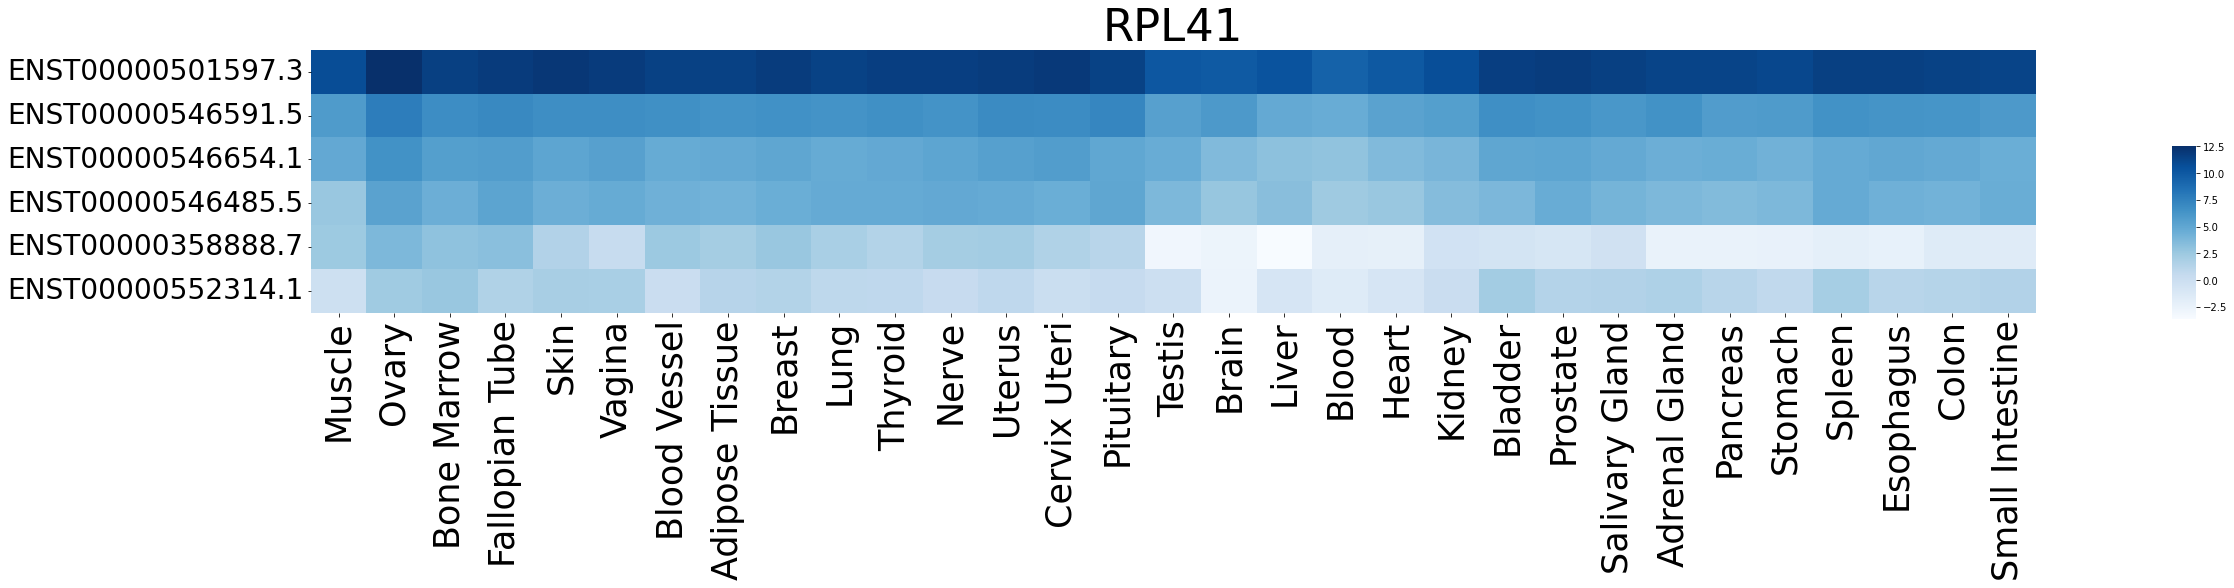
| Expression level of gene isoforms across GTEx pantissue |
 |
| Cancer(tissue) type-specific expression level of Translation factor using z-score distriution |
 |
| Differential expression between tumor and matched normal (in the cancer types with more than 10 matched samples) |
 |
| Cancer type | Translation factor | FC | adj.pval |
| STAD | RPL41 | -2.14934386855632 | 0.000397900585085154 |
Top |
|
| Translation factor expression regulation through miRNA binding |
| Cancer type | Gene | miRNA | TargetScan binding score (Context++ score percentile) | Coefficient | Pvalue |
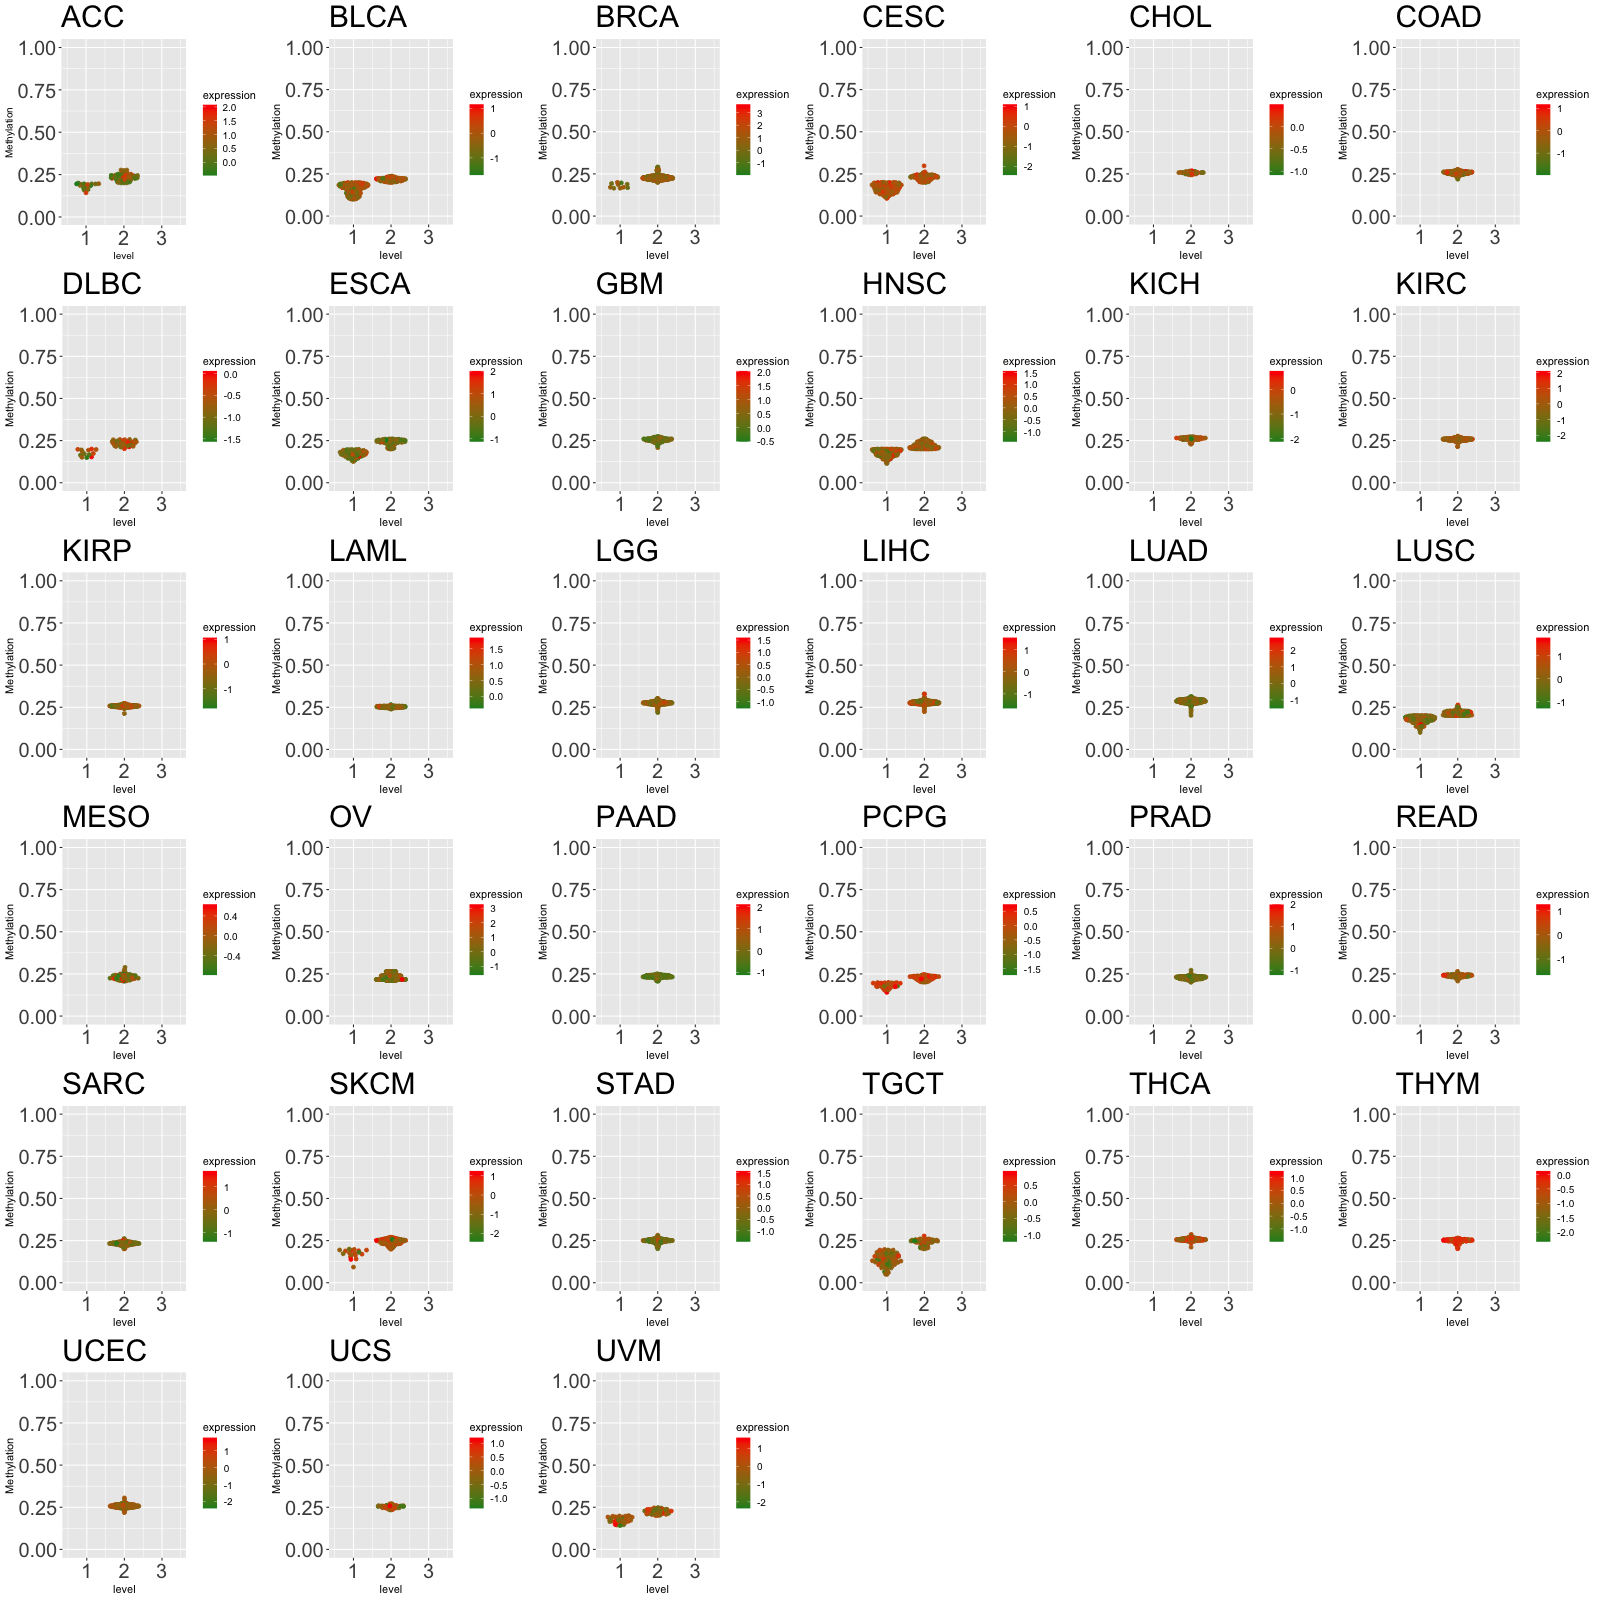
| Translation factor expression regulation through methylation in the promoter of Translation factor |
 |
| Cancer type | Gene | methyl group b | methyl group a | DEG pval | avg methyl in b | avg methyl in a | avg exp in b | avg exp in a |
| Translation factor expression regulation through methylation in the gene body of Translation factor (positive regulation) |
 |
| Cancer type | Gene | methyl group b | methyl group a | DEG pval | avg methyl in b | avg methyl in a | avg exp in b | avg exp in a |
| Translation factor expression regulation through copy number variation of Translation factor |
 |
| Cancer type | Gene | Coefficient | Pvalue |
| UCEC | RPL41 | 0.097803784 | 0.021697189 |
| READ | RPL41 | 0.073667189 | 0.02232349 |
| LIHC | RPL41 | 0.054086958 | 0.027937389 |
Top |
|
| Strongly correlated genes belong to cellular important gene groups with RPL41 (coefficient>0.8, pval<0.05, node color based on FC between tumor and matched normal). Significantly associated important genes in the individual cancer types. * Cell metabolism gene: cell metabolism genes from REACTOME (black edge), IUPHAR: drug target genes from IUPHAR (blue edge), Kinase: human kinase genes (brown edge), CGC: cancer gene census genes (orange edge), TSG: tumor suppresor genes (purple edge), Epifactor: epigenetic factors (light blue edge), TF: transcription factors (green) |
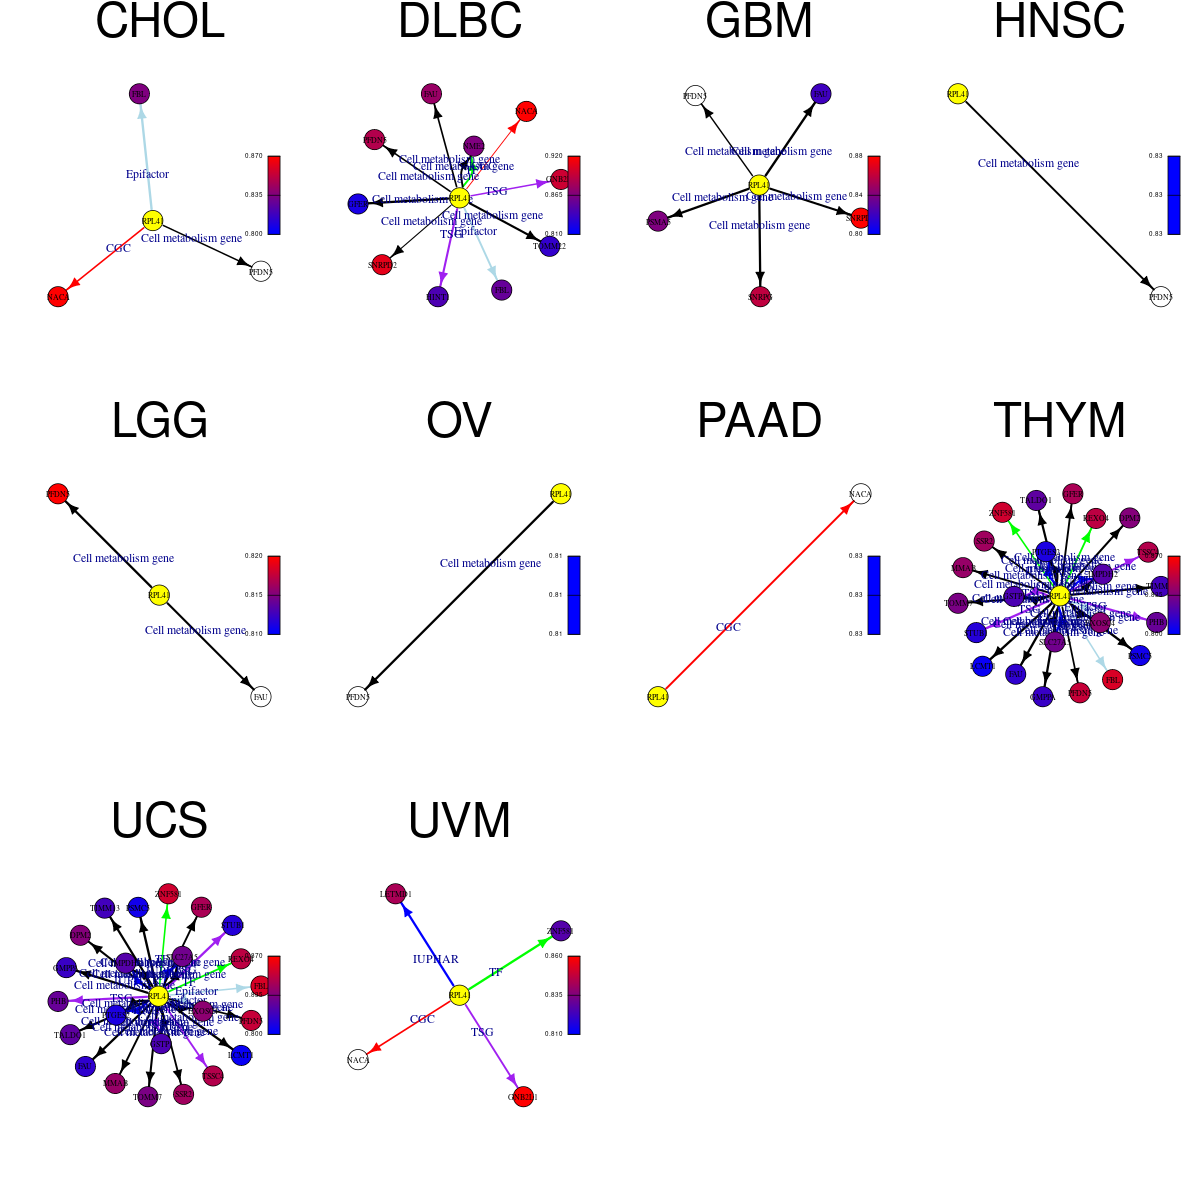 |
| Cancer type | Gene group | Translation factor | Correlated gene | Coefficient | Pvalue |
| CHOL | Cell metabolism gene | RPL41 | PFDN5 | 0.870738017 | 7.67E-15 |
| CHOL | CGC | RPL41 | NACA | 0.863712783 | 2.22E-14 |
| CHOL | Epifactor | RPL41 | FBL | 0.803792667 | 2.98E-11 |
| DLBC | Cell metabolism gene | RPL41 | GFER | 0.80789518 | 3.91E-12 |
| DLBC | Cell metabolism gene | RPL41 | TOMM22 | 0.81920764 | 1.10E-12 |
| DLBC | Cell metabolism gene | RPL41 | NME2 | 0.839102707 | 9.49E-14 |
| DLBC | Cell metabolism gene | RPL41 | FAU | 0.857878552 | 6.76E-15 |
| DLBC | Cell metabolism gene | RPL41 | PFDN5 | 0.863404678 | 2.89E-15 |
| DLBC | Cell metabolism gene | RPL41 | SNRPD2 | 0.903192996 | 1.64E-18 |
| DLBC | CGC | RPL41 | NACA | 0.919179048 | 3.08E-20 |
| DLBC | Epifactor | RPL41 | FBL | 0.836590974 | 1.32E-13 |
| DLBC | TF | RPL41 | NME2 | 0.839102707 | 9.49E-14 |
| DLBC | TSG | RPL41 | HINT1 | 0.823882687 | 6.38E-13 |
| DLBC | TSG | RPL41 | GNB2L1 | 0.870211167 | 9.63E-16 |
| GBM | Cell metabolism gene | RPL41 | FAU | 0.802883816 | 4.88E-40 |
| GBM | Cell metabolism gene | RPL41 | PSMA5 | 0.808180645 | 6.15E-41 |
| GBM | Cell metabolism gene | RPL41 | SNRPG | 0.809440293 | 3.72E-41 |
| GBM | Cell metabolism gene | RPL41 | SNRPD2 | 0.822755551 | 1.45E-43 |
| GBM | Cell metabolism gene | RPL41 | PFDN5 | 0.876805146 | 6.07E-56 |
| HNSC | Cell metabolism gene | RPL41 | PFDN5 | 0.834433574 | 4.59E-148 |
| LGG | Cell metabolism gene | RPL41 | PFDN5 | 0.808485038 | 1.16E-123 |
| LGG | Cell metabolism gene | RPL41 | FAU | 0.822441832 | 1.83E-131 |
| OV | Cell metabolism gene | RPL41 | PFDN5 | 0.808107423 | 2.59E-72 |
| PAAD | CGC | RPL41 | NACA | 0.834204959 | 1.16E-48 |
| THYM | Cell metabolism gene | RPL41 | LCMT1 | 0.803131979 | 9.27E-29 |
| THYM | Cell metabolism gene | RPL41 | PSMC5 | 0.803609459 | 8.13E-29 |
| THYM | Cell metabolism gene | RPL41 | PTGES2 | 0.80480679 | 5.86E-29 |
| THYM | Cell metabolism gene | RPL41 | FAU | 0.807623781 | 2.68E-29 |
| THYM | Cell metabolism gene | RPL41 | GMPPA | 0.811233485 | 9.65E-30 |
| THYM | Cell metabolism gene | RPL41 | TIMM13 | 0.812997925 | 5.81E-30 |
| THYM | Cell metabolism gene | RPL41 | GSTP1 | 0.813626327 | 4.84E-30 |
| THYM | Cell metabolism gene | RPL41 | IMPDH2 | 0.814011034 | 4.33E-30 |
| THYM | Cell metabolism gene | RPL41 | TALDO1 | 0.814220965 | 4.07E-30 |
| THYM | Cell metabolism gene | RPL41 | SLC27A5 | 0.815369411 | 2.91E-30 |
| THYM | Cell metabolism gene | RPL41 | TOMM7 | 0.82498955 | 1.60E-31 |
| THYM | Cell metabolism gene | RPL41 | DPM2 | 0.825387384 | 1.41E-31 |
| THYM | Cell metabolism gene | RPL41 | EXOSC4 | 0.829363914 | 4.01E-32 |
| THYM | Cell metabolism gene | RPL41 | MMAB | 0.836384245 | 4.03E-33 |
| THYM | Cell metabolism gene | RPL41 | SSR2 | 0.839890311 | 1.23E-33 |
| THYM | Cell metabolism gene | RPL41 | GFER | 0.839911634 | 1.22E-33 |
| THYM | Cell metabolism gene | RPL41 | PFDN5 | 0.852325918 | 1.42E-35 |
| THYM | Epifactor | RPL41 | EXOSC4 | 0.829363914 | 4.01E-32 |
| THYM | Epifactor | RPL41 | FBL | 0.867149421 | 3.93E-38 |
| THYM | IUPHAR | RPL41 | PTGES2 | 0.80480679 | 5.86E-29 |
| THYM | IUPHAR | RPL41 | IMPDH2 | 0.814011034 | 4.33E-30 |
| THYM | IUPHAR | RPL41 | SLC27A5 | 0.815369411 | 2.91E-30 |
| THYM | TF | RPL41 | REXO4 | 0.8438032 | 3.14E-34 |
| THYM | TF | RPL41 | ZNF581 | 0.863418239 | 1.85E-37 |
| THYM | TSG | RPL41 | STUB1 | 0.80731224 | 2.92E-29 |
| THYM | TSG | RPL41 | GSTP1 | 0.813626327 | 4.84E-30 |
| THYM | TSG | RPL41 | PHB | 0.815250211 | 3.02E-30 |
| THYM | TSG | RPL41 | TSSC4 | 0.840246058 | 1.08E-33 |
| UCS | Cell metabolism gene | RPL41 | LCMT1 | 0.803131979 | 9.27E-29 |
| UCS | Cell metabolism gene | RPL41 | PSMC5 | 0.803609459 | 8.13E-29 |
| UCS | Cell metabolism gene | RPL41 | PTGES2 | 0.80480679 | 5.86E-29 |
| UCS | Cell metabolism gene | RPL41 | FAU | 0.807623781 | 2.68E-29 |
| UCS | Cell metabolism gene | RPL41 | GMPPA | 0.811233485 | 9.65E-30 |
| UCS | Cell metabolism gene | RPL41 | TIMM13 | 0.812997925 | 5.81E-30 |
| UCS | Cell metabolism gene | RPL41 | GSTP1 | 0.813626327 | 4.84E-30 |
| UCS | Cell metabolism gene | RPL41 | IMPDH2 | 0.814011034 | 4.33E-30 |
| UCS | Cell metabolism gene | RPL41 | TALDO1 | 0.814220965 | 4.07E-30 |
| UCS | Cell metabolism gene | RPL41 | SLC27A5 | 0.815369411 | 2.91E-30 |
| UCS | Cell metabolism gene | RPL41 | TOMM7 | 0.82498955 | 1.60E-31 |
| UCS | Cell metabolism gene | RPL41 | DPM2 | 0.825387384 | 1.41E-31 |
| UCS | Cell metabolism gene | RPL41 | EXOSC4 | 0.829363914 | 4.01E-32 |
| UCS | Cell metabolism gene | RPL41 | MMAB | 0.836384245 | 4.03E-33 |
| UCS | Cell metabolism gene | RPL41 | SSR2 | 0.839890311 | 1.23E-33 |
| UCS | Cell metabolism gene | RPL41 | GFER | 0.839911634 | 1.22E-33 |
| UCS | Cell metabolism gene | RPL41 | PFDN5 | 0.852325918 | 1.42E-35 |
| UCS | Epifactor | RPL41 | EXOSC4 | 0.829363914 | 4.01E-32 |
| UCS | Epifactor | RPL41 | FBL | 0.867149421 | 3.93E-38 |
| UCS | IUPHAR | RPL41 | PTGES2 | 0.80480679 | 5.86E-29 |
| UCS | IUPHAR | RPL41 | IMPDH2 | 0.814011034 | 4.33E-30 |
| UCS | IUPHAR | RPL41 | SLC27A5 | 0.815369411 | 2.91E-30 |
| UCS | TF | RPL41 | REXO4 | 0.8438032 | 3.14E-34 |
| UCS | TF | RPL41 | ZNF581 | 0.863418239 | 1.85E-37 |
| UCS | TSG | RPL41 | STUB1 | 0.80731224 | 2.92E-29 |
| UCS | TSG | RPL41 | GSTP1 | 0.813626327 | 4.84E-30 |
| UCS | TSG | RPL41 | PHB | 0.815250211 | 3.02E-30 |
| UCS | TSG | RPL41 | TSSC4 | 0.840246058 | 1.08E-33 |
| UVM | CGC | RPL41 | NACA | 0.856866332 | 3.77E-24 |
| UVM | IUPHAR | RPL41 | LETMD1 | 0.810461457 | 8.45E-20 |
| UVM | TF | RPL41 | ZNF581 | 0.80558885 | 2.06E-19 |
| UVM | TSG | RPL41 | GNB2L1 | 0.84045633 | 1.87E-22 |
Top |
|
| Protein 3D structure Visit iCn3D. |
Top |
|
| Protein-protein interaction networks * Overlap between up-regulated DEGs (log2FC<-1 and adj.P<0.05) and STRING PPI network (center: Translation factor, node: DEGs, edges: weighted by -log2(adj.P)) |
 |
| Overlap between down-regulated DEGs (log2FC>1 and adj.P<0.05) and STRING PPI network (center: Translation factor, node: DEGs, edges: weighted by -log2(adj.P)) |
 |
 * Edge colors based on TCGA cancer types. |
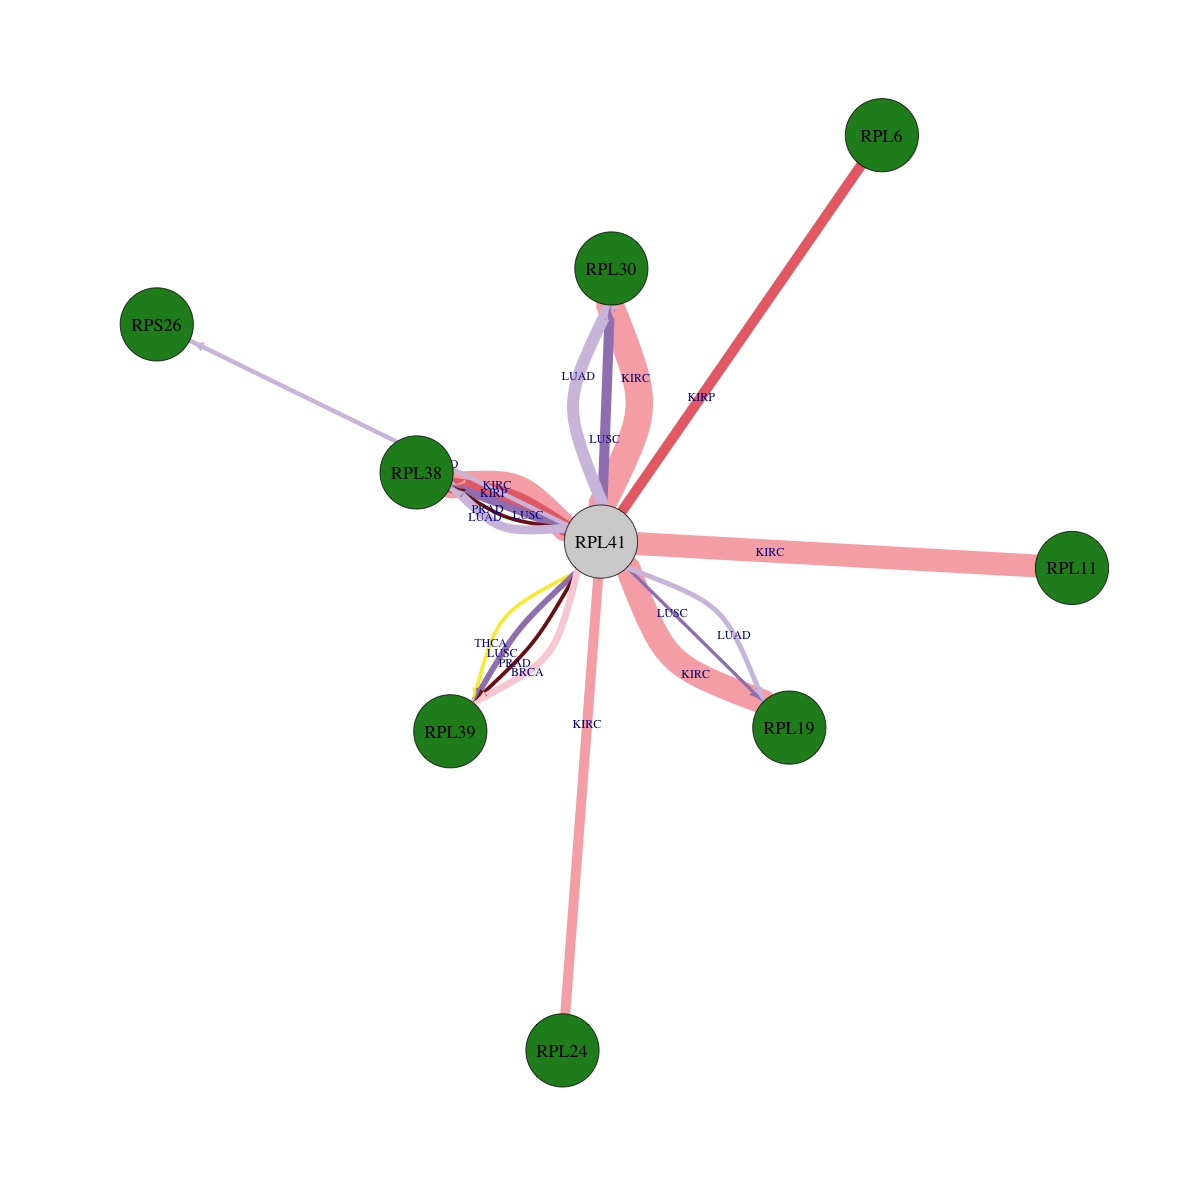
| * Overlap between DEGs (log2FC>1 and adj.P<0.05) and STRING PPI network per cancer (center: Translation factor, node: DEGs, node color: log2FC, edges: weighted by -log2(adj.P)) |
 |
| Cancer type | Translation factor | Interacting protein coding gene | FC | adj.pval |
| THCA | RPL41 | RPL24 | 1.06284306986844 | 0.000144459266043069 |
| HNSC | RPL41 | RPL6 | 2.22149016292113 | 0.000172794781747143 |
| LUAD | RPL41 | RPL38 | -1.66722943744988 | 0.000257795914027732 |
| LUSC | RPL41 | RPL38 | -2.00110253296947 | 0.00049723236196648 |
| BRCA | RPL41 | RPL39 | -1.41219628848121 | 0.00163371967664225 |
| KICH | RPL41 | RPL19 | 1.36901182894089 | 0.00250792503356934 |
| LUSC | RPL41 | RPL39 | -2.23543914303094 | 0.00457577784727754 |
| LUAD | RPL41 | RPL19 | -1.31398026615725 | 0.00993159558412698 |
| THCA | RPL41 | RPL31 | 1.09436372419291 | 0.0152379297688856 |
| LUAD | RPL41 | RPS26 | -1.30179981165725 | 0.0163893452361939 |
| PRAD | RPL41 | RPL31 | 1.37417394483053 | 0.0209655998648434 |
| PRAD | RPL41 | RPL39 | -2.63448396305036 | 0.0291755363147523 |
| PRAD | RPL41 | RPL38 | -1.37307294389303 | 0.0319785302138518 |
| THCA | RPL41 | RPL39 | -1.21516043459116 | 0.0375744128896741 |
| LUSC | RPL41 | RPL19 | -2.14669889516666 | 0.044366810398747 |
| KIRC | RPL41 | RPL19 | -2.73485271276676 | 1.33980982873695e-10 |
| LUAD | RPL41 | RPL30 | -1.98579595284099 | 1.50488235365288e-05 |
| KIRC | RPL41 | RPL38 | -2.47198269993031 | 2.66680331214666e-11 |
| KIRP | RPL41 | RPL38 | -2.05925877790715 | 4.97791916131974e-07 |
| KIRC | RPL41 | RPL11 | -5.47536848868151 | 6.13619476098216e-10 |
| KIRP | RPL41 | RPL6 | -1.52645217188093 | 7.40401446819306e-05 |
| LUSC | RPL41 | RPL30 | -2.27386662283158 | 9.09971457907932e-05 |
| KIRC | RPL41 | RPL30 | -1.65763742142219 | 9.40007073737459e-12 |
| KIRC | RPL41 | RPL24 | -2.29123283250518 | 9.9540413319149e-05 |
| Protein-protein interactors with this translation factor (BIOGRID-3.4.160) |
| PPI interactors with RPL41 |
| IKBKG, MAPK14, PRNP, APP, SRPK2, NUPR1, DAPK1, SDCBP2, HNRNPH1, |
Top |
|
| Clinically associated variants from ClinVar. |
| Gene | Chr | Position | RefSeq | VarSeq | RefSeeq | VarType | Pathogenic | Disease | VarInfo |
| nsSNVs with sample frequency (size of circle) from TCGA 33 cancers. |
 |
| SNVs and Indels |
| Gene | Cancer type | Chromosome | Start | End | RefSeeq | MutSeq | Mutation type | AAchange | # samples |
| RPL41 | BRCA | chr12 | 56511292 | 56511292 | G | C | Missense_Mutation | p.R21T | 4 |
| RPL41 | SARC | chr12 | 56511286 | 56511286 | A | T | Missense_Mutation | 2 | |
| RPL41 | SARC | chr12 | 56511286 | 56511286 | A | T | Missense_Mutation | p.K19M | 2 |
| RPL41 | ESCA | chr12 | 56510561 | 56510561 | A | G | RNA | NULL | 1 |
| RPL41 | LIHC | chr12 | 56511279 | 56511279 | A | G | Missense_Mutation | 1 | |
| RPL41 | LUAD | chr12 | 56511295 | 56511296 | AG | - | Frame_Shift_Del | p.Q22fs | 1 |
| RPL41 | BLCA | chr12 | 56510496 | 56510496 | C | T | Missense_Mutation | 1 | |
| RPL41 | BLCA | chr12 | 56510503 | 56510503 | C | T | Missense_Mutation | 1 | |
| RPL41 | BLCA | chr12 | 56510574 | 56510574 | G | C | Translation_Start_Site | 1 | |
| RPL41 | BLCA | chr12 | 56510574 | 56510574 | G | C | Translation_Start_Site | p.M1I | 1 |
| RPL41 | CESC | chr12 | 56510565 | 56510565 | C | G | Missense_Mutation | 1 | |
| RPL41 | CESC | chr12 | 56510565 | 56510565 | C | G | RNA | NULL | 1 |
| RPL41 | ESCA | chr12 | 56510435 | 56510435 | T | - | RNA | NULL | 1 |
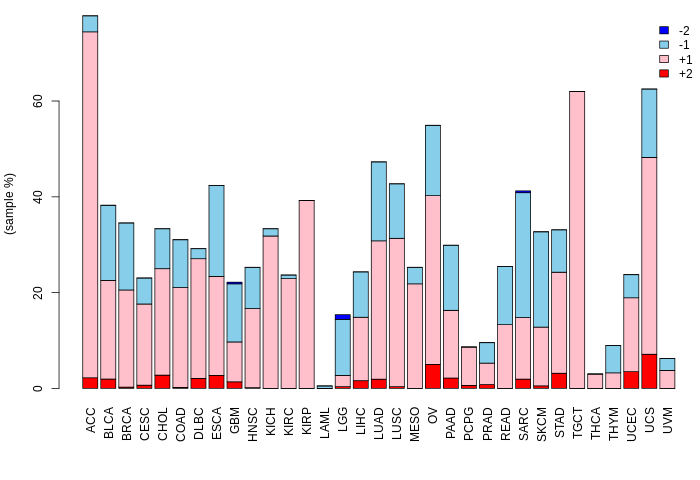
| Copy number variation (CNV) of RPL41 * Click on the image to open the original image in a new window. |
 |
| Fusion gene breakpoints (product of the structural variants (SVs)) across RPL41 * Click on the image to open the UCSC genome browser with custom track showing this image in a new window. |
 |
| Fusion genes with this translation factor from FusionGDB2.0. |
| FusionGDB2 ID | Disease | Sample | Hgene | Hchr | Hbp | Hstrand | Tgene | Tchr | Tbp | Tstrand |
| 72698 | N/A | AK023340 | CTTNBP2NL | chr1 | 112999518 | + | RPL41 | chr12 | 56511502 | + |
| 72698 | N/A | EC575283 | GRM5 | chr11 | 88300013 | - | RPL41 | chr12 | 56511345 | + |
| 72698 | N/A | EC458238 | LINC00624 | chr1 | 146972962 | + | RPL41 | chr12 | 56510971 | + |
| 72698 | STAD | TCGA-EQ-A4SO-01A | MRPL54 | chr19 | 3762816 | + | RPL41 | chr12 | 56511266 | + |
| 72707 | N/A | AA316918 | RBFOX2 | chr22 | 36234322 | - | RPL41 | chr12 | 56510558 | + |
| 72698 | N/A | EC521372 | RP11-146F11.5 | chr16 | 30599056 | + | RPL41 | chr12 | 56511263 | + |
| 92661 | LAML | TCGA-AB-2979_631TVAAXX_4 | RPL41 | chr12 | 56510577 | + | CD74 | chr5 | 149792311 | - |
| 92913 | N/A | AA164526 | RPL41 | chr12 | 56511476 | - | DGKI | chr7 | 137198769 | + |
| 92913 | N/A | EC440666 | RPL41 | chr12 | 56510996 | + | DGKI | chr7 | 137198565 | + |
| 99269 | STAD | TCGA-HU-8604 | RPL41 | chr12 | 56510583 | + | GRB7 | chr17 | 37898504 | + |
| 80325 | OV | TCGA-04-1341-01A | RPL41 | chr12 | 56510582 | + | IGFBP2 | chr2 | 217498140 | + |
| 80325 | OV | TCGA-29-2428-01A | RPL41 | chr12 | 56510584 | + | IGFBP2 | chr2 | 217498142 | + |
| 100872 | N/A | AA640379 | RPL41 | chr12 | 56510971 | - | IL6ST | chr5 | 55240869 | - |
| 100872 | N/A | BG030834 | RPL41 | chr12 | 56511605 | + | IL6ST | chr5 | 55240470 | + |
| 98078 | N/A | EC457078 | RPL41 | chr12 | 56511514 | - | NAA25 | chr12 | 112541140 | + |
| 94777 | GBM | TCGA-06-5856-01A | RPL41 | chr12 | 56510995 | + | NACA | chr12 | 57108471 | - |
| 102869 | N/A | AA164525 | RPL41 | chr12 | 56511395 | - | RBFOX2 | chr22 | 36234459 | - |
| 102869 | N/A | BF343594 | RPL41 | chr12 | 56511613 | + | RBFOX2 | chr22 | 36234718 | - |
| 102869 | N/A | EC558913 | RPL41 | chr12 | 56510971 | - | RBFOX2 | chr22 | 36234635 | + |
| 83045 | N/A | AA761029 | RPL41 | chr12 | 56511313 | - | RPL24 | chr3 | 101404740 | - |
| 95099 | BLCA | TCGA-DK-AA6P-01A | RPL41 | chr12 | 56510583 | + | SMARCC2 | chr12 | 56580024 | - |
| 96590 | N/A | T27245 | RPL41 | chr12 | 56511022 | - | UCP2 | chr11 | 73685974 | - |
Top |
|
| Kaplan-Meier plots with logrank tests of overall survival (OS) |
 |
| Cancer type | Translation factor | Coefficent | Hazard ratio | Wald test pval | Likelihool ratio pval | Logrank test pval | # samples |
Top |
|
| Differential gene expression between female and male. (Wilcoxon test, pval<0.05) |
 |
| Cancer type | Translation factor | pval | adj.p |
| SARC | RPL41 | 0.00825385173920196 | 0.22 |
| COAD | RPL41 | 0.0408311377639489 | 1 |
| LGG | RPL41 | 0.0419361040743692 | 1 |
| KIRC | RPL41 | 3.69269679295766e-05 | 0.001 |
Top |
|
| Differential gene expression between young and old age groups (Wilcoxon test, pval<0.05) |
 |
| Cancer type | Translation factor | pval | adj.p |
| LUSC | RPL41 | 0.0106724367144579 | 0.35 |
Top |
|
| Drugs targeting genes involved in this translation factor. (DrugBank Version 5.1.8 2021-05-08) |
| UniProtAcc | DrugBank ID | Drug name | Drug activity | Drug type | Drug status |
Top |
|
| Diseases associated with this translation factor. (DisGeNet 4.0) |
| Disease ID | Disease Name | # PubMeds | Disease source |
(UTHealth)
Web File Viewing | Emergency Information |Campus Carry|Site Policies