
|
||||||
|

Translation Factor: RPS15A (NCBI Gene ID:6210) |
|
 Gene Summary Gene Summary |
| Gene Information | Gene Name: RPS15A | Gene ID: 6210 | Gene Symbol | RPS15A | Gene ID | 6210 |
| Gene Name | ribosomal protein S15a | |
| Synonyms | DBA20|S15a | |
| Cytomap | 16p12.3 | |
| Type of Gene | protein-coding | |
| Description | 40S ribosomal protein S15asmall ribosomal subunit protein uS8up-regulated by HBV X protein | |
| Modification date | 20200313 | |
| UniProtAcc | P62244 | |
| Child GO biological process term(s) under GO:0006412 |
| GO ID | GO term |
| GO:0005840 | Ribosome |
| GO:0002181 | Cytoplasmic translation |
| GO:0006412 | Translation |
| Gene ontology of translaction factor with evidence of Inferred from Direct Assay (IDA) from Entrez |
| Partner | Gene | GO ID | GO term | PubMed ID |
| Hgene | RPS15A | GO:0008284 | positive regulation of cell proliferation | 15108328 |
| Hgene | RPS15A | GO:0009615 | response to virus | 15108328 |
| Hgene | RPS15A | GO:0045787 | positive regulation of cell cycle | 15108328 |
| Inferred gene age of translation factor. |
| Gene | Inferred gene age group among (0 - 67.6], (67.6 - 355.7], (355.7 - 733], (733 - 1119.25], >1119.25 |
| RPS15A | >1119.25 |
Top |
|
| We searched PubMed using 'RPS15A[title] AND translation [title] AND human.' |
| Gene | Title | PMID |
| RPS15A | . | . |
Top |
|
| Skipped exons in TCGA and GTEx based on Ensembl gene isoform structure. * Click on the image to open the UCSC genome browser with custom track showing this image in a new window. For more annotations, please visit our ExonSkipDB. |
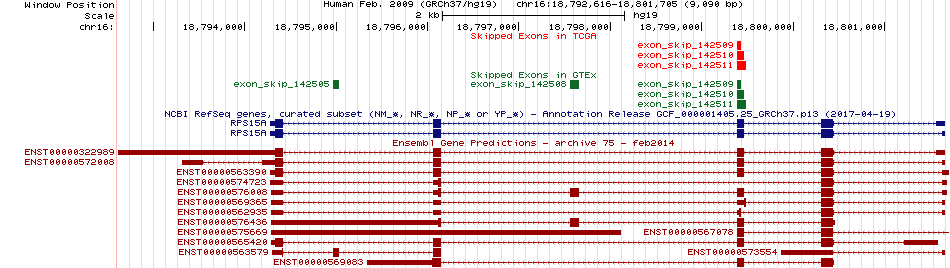 |
| Open reading frame (ORF) analsis of exon skipping events based on Ensembl gene isoform structure. * Click on the break point to see the gene structure around the break point region using the UCSC Genome Browser. |
| ENST | Exon skip start (DNA) | Exon Skip end (DNA) | ORF |
| ENST00000322989 | 18799384 | 18799464 | Frame-shift |
| ENST00000563390 | 18799384 | 18799464 | Frame-shift |
| ENST00000565420 | 18799384 | 18799464 | Frame-shift |
| Exon skipping position in the amino acid sequence. |
| ENST | Exon skip start (DNA) | Exon Skip end (DNA) | Len(transcript seq) | Exon skip start (mRNA) | Exon Skip end (mRNA) | Len(amino acid seq) | Exon skip start (AA) | Exon Skip end (AA) |
| Potentially (partially) lost protein functional features of UniProt. |
| UniProtAcc | Exon skip start (AA) | Exon Skip end (AA) | Function feature start (AA) | Function feature end (AA) | Functional feature type | Functional feature desc. |
Top |
|
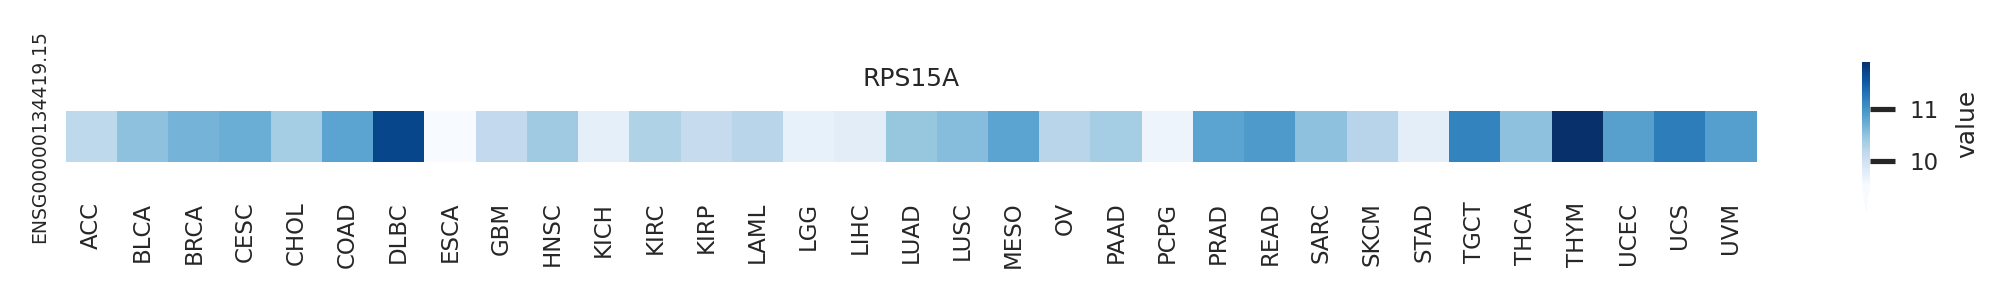
| Gene expression level across TCGA pancancer |
 |
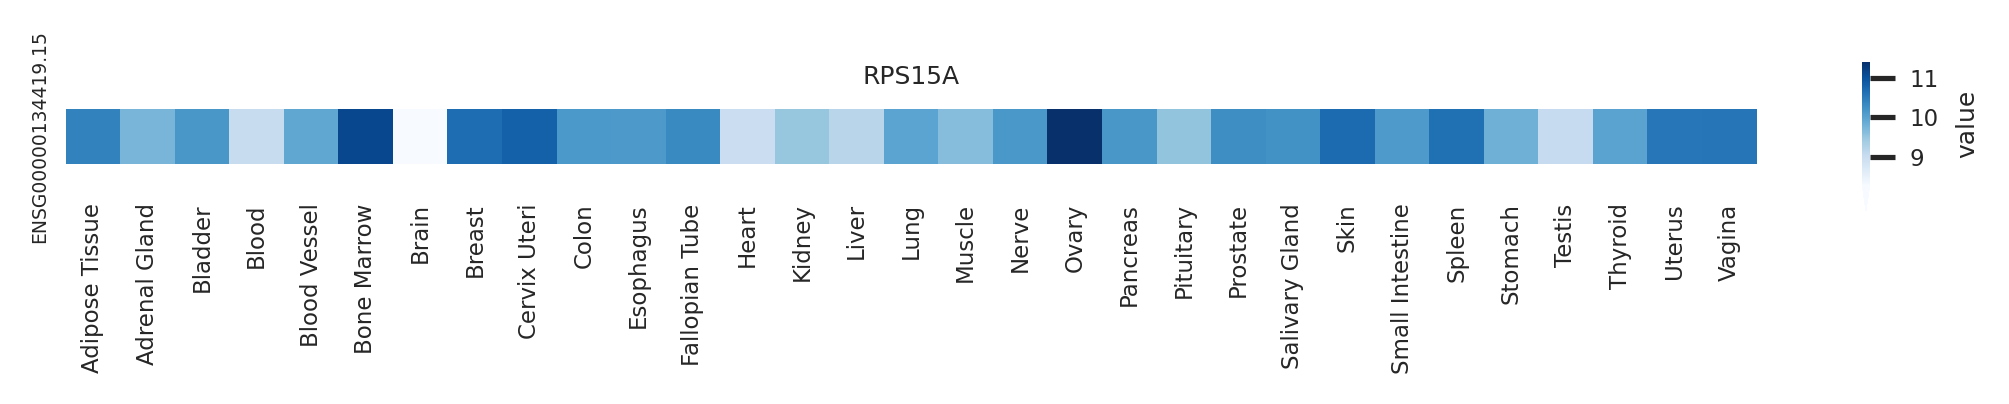
| Gene expression level across GTEx pantissue |
 |
| Expression level of gene isoforms across TCGA pancancer |
 |
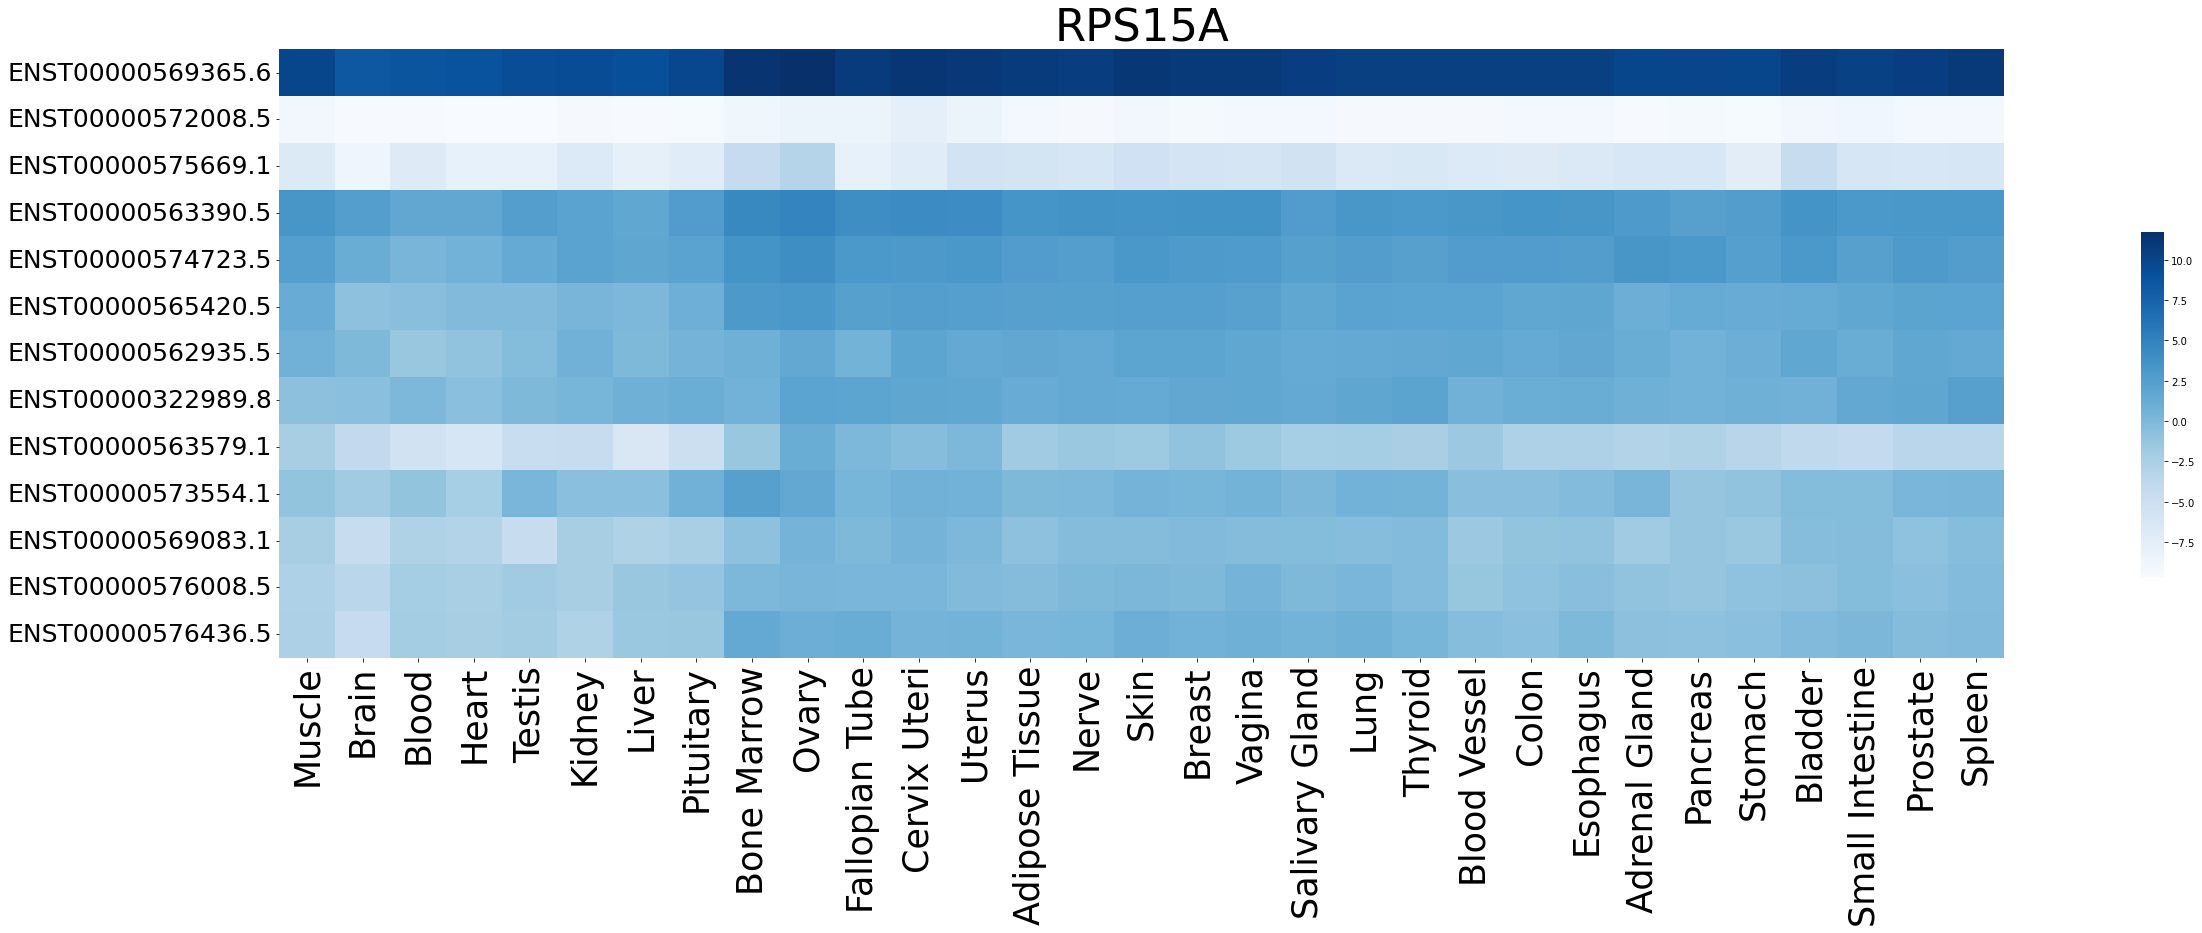
| Expression level of gene isoforms across GTEx pantissue |
 |
| Cancer(tissue) type-specific expression level of Translation factor using z-score distriution |
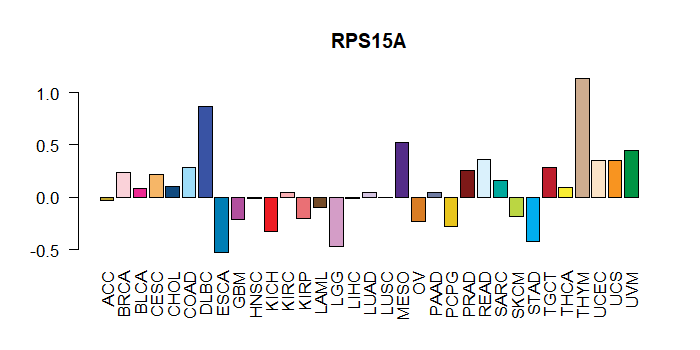 |
| Differential expression between tumor and matched normal (in the cancer types with more than 10 matched samples) |
 |
| Cancer type | Translation factor | FC | adj.pval |
| BRCA | RPS15A | -1.39403174309699 | 0.000110797167056844 |
| STAD | RPS15A | 1.10140997786082 | 0.0148032568395138 |
| BLCA | RPS15A | -3.67919690742966 | 0.0445594787597656 |
| KIRC | RPS15A | -4.14252623992016 | 2.15831756070263e-10 |
| KIRP | RPS15A | -1.51145101417385 | 4.02145087718964e-06 |
Top |
|
| Translation factor expression regulation through miRNA binding |
| Cancer type | Gene | miRNA | TargetScan binding score (Context++ score percentile) | Coefficient | Pvalue |
| READ | RPS15A | hsa-miR-186-5p | 73 | -0.30968841285297 | 0.00566088307863855 |
| Translation factor expression regulation through methylation in the promoter of Translation factor |
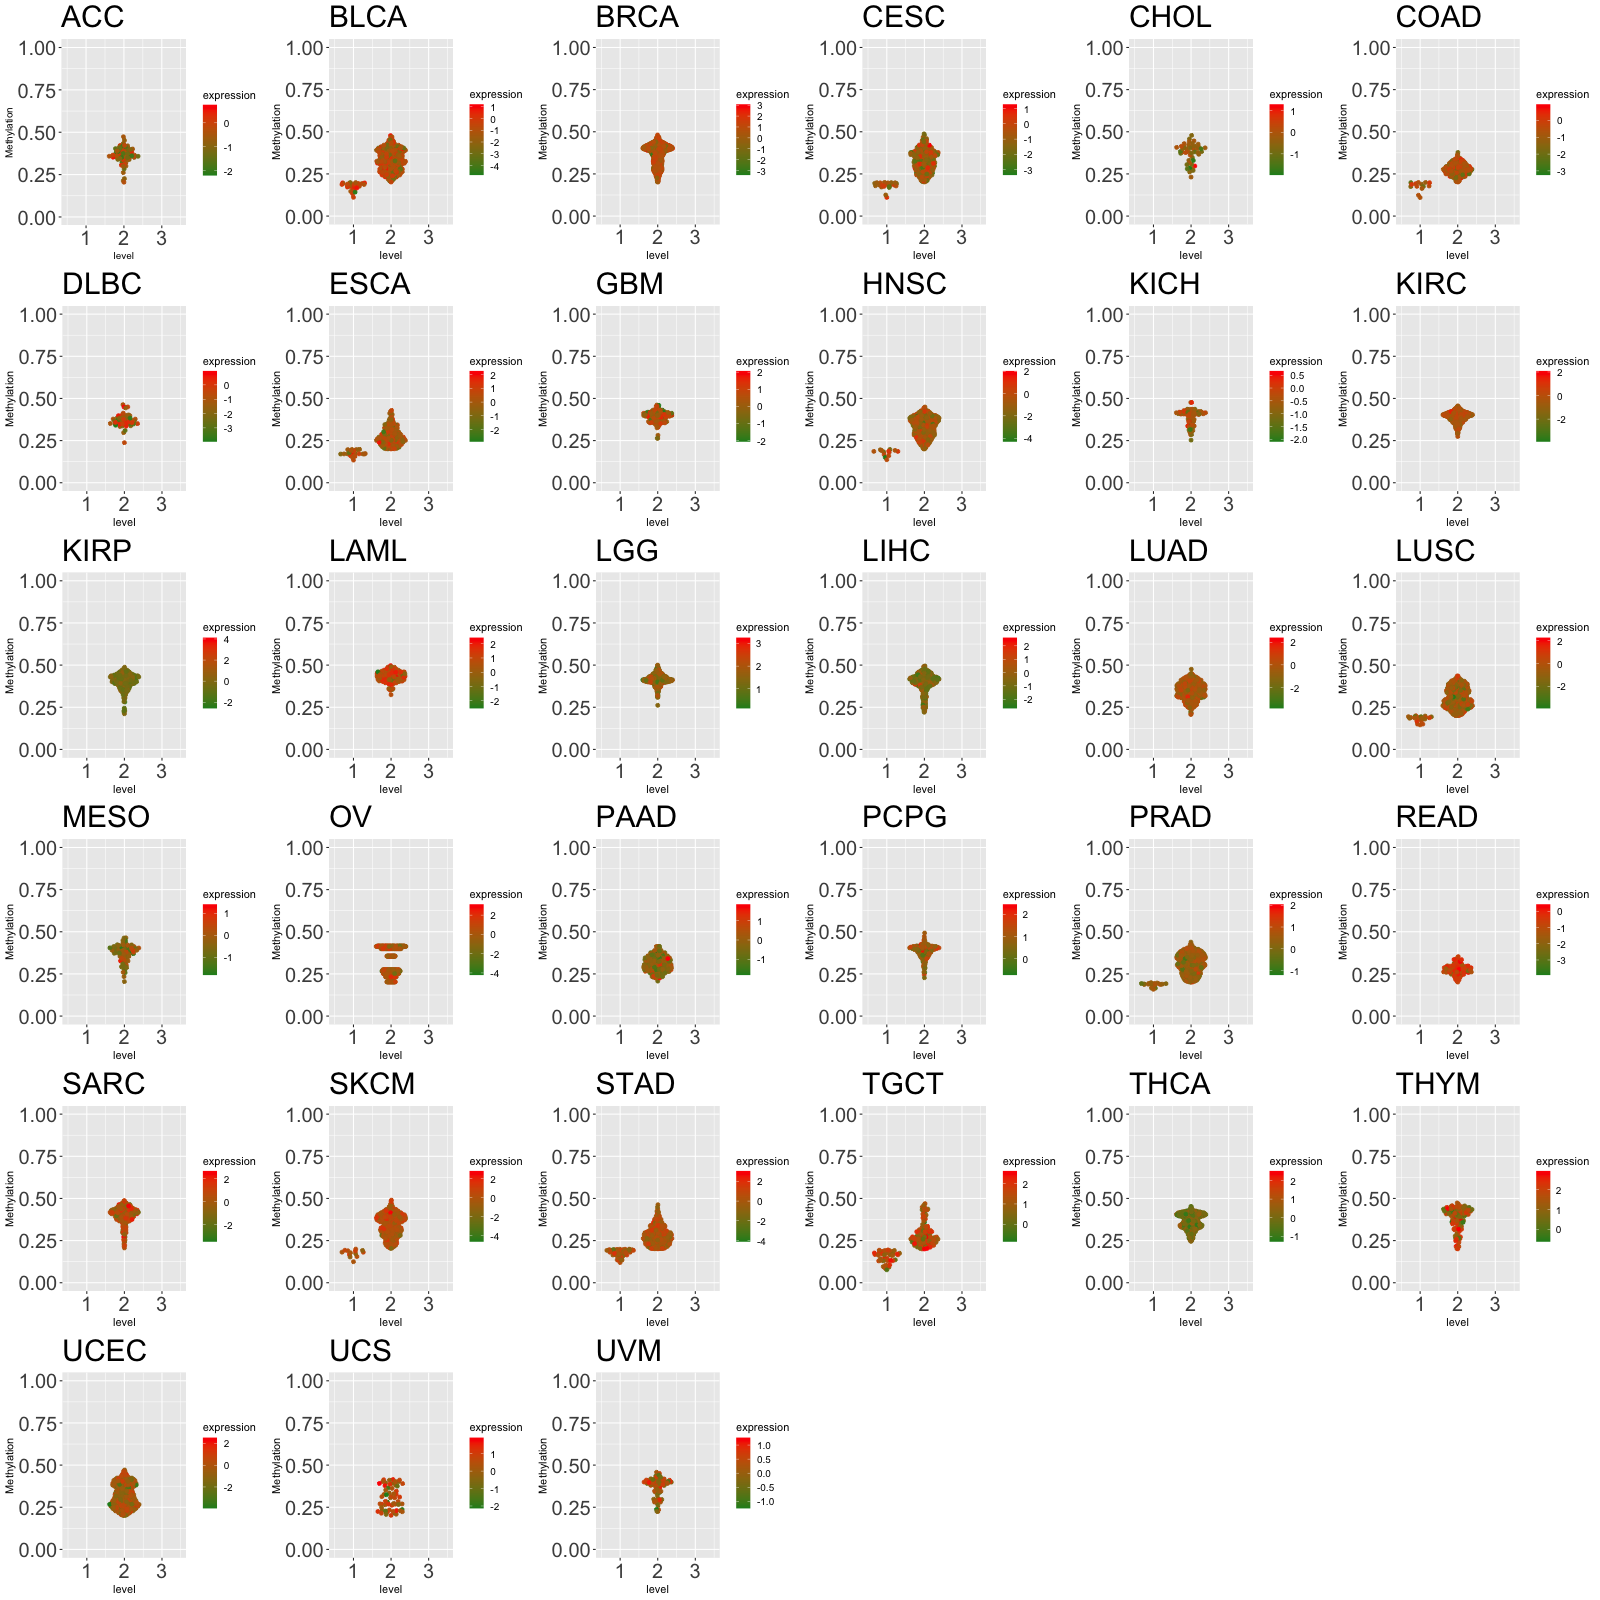 |
| Cancer type | Gene | methyl group b | methyl group a | DEG pval | avg methyl in b | avg methyl in a | avg exp in b | avg exp in a |
| Translation factor expression regulation through methylation in the gene body of Translation factor (positive regulation) |
 |
| Cancer type | Gene | methyl group b | methyl group a | DEG pval | avg methyl in b | avg methyl in a | avg exp in b | avg exp in a |
| Translation factor expression regulation through copy number variation of Translation factor |
 |
| Cancer type | Gene | Coefficient | Pvalue |
| ESCA | RPS15A | -0.09317384 | 0.009710429 |
| MESO | RPS15A | 0.063878915 | 0.042422633 |
Top |
|
| Strongly correlated genes belong to cellular important gene groups with RPS15A (coefficient>0.8, pval<0.05, node color based on FC between tumor and matched normal). Significantly associated important genes in the individual cancer types. * Cell metabolism gene: cell metabolism genes from REACTOME (black edge), IUPHAR: drug target genes from IUPHAR (blue edge), Kinase: human kinase genes (brown edge), CGC: cancer gene census genes (orange edge), TSG: tumor suppresor genes (purple edge), Epifactor: epigenetic factors (light blue edge), TF: transcription factors (green) |
 |
| Cancer type | Gene group | Translation factor | Correlated gene | Coefficient | Pvalue |
| DLBC | Cell metabolism gene | RPS15A | TBCA | 0.802620051 | 6.86E-12 |
| DLBC | Cell metabolism gene | RPS15A | DGUOK | 0.805064408 | 5.30E-12 |
| DLBC | Cell metabolism gene | RPS15A | POLR2F | 0.812687061 | 2.31E-12 |
| DLBC | Cell metabolism gene | RPS15A | PGLS | 0.8147555 | 1.84E-12 |
| DLBC | Cell metabolism gene | RPS15A | GFER | 0.817373302 | 1.36E-12 |
| DLBC | Cell metabolism gene | RPS15A | TIMM9 | 0.822874274 | 7.19E-13 |
| DLBC | Cell metabolism gene | RPS15A | TOMM22 | 0.833042818 | 2.07E-13 |
| DLBC | Cell metabolism gene | RPS15A | NME2 | 0.846822353 | 3.34E-14 |
| DLBC | Cell metabolism gene | RPS15A | PFDN5 | 0.856303901 | 8.56E-15 |
| DLBC | Cell metabolism gene | RPS15A | FAU | 0.872304146 | 6.78E-16 |
| DLBC | Cell metabolism gene | RPS15A | SNRPD2 | 0.892392788 | 1.66E-17 |
| DLBC | CGC | RPS15A | NACA | 0.885462769 | 6.44E-17 |
| DLBC | Epifactor | RPS15A | FBL | 0.827124568 | 4.32E-13 |
| DLBC | TF | RPS15A | NME2 | 0.846822353 | 3.34E-14 |
| DLBC | TSG | RPS15A | HINT1 | 0.806405781 | 4.59E-12 |
| DLBC | TSG | RPS15A | GADD45GIP1 | 0.833370073 | 1.99E-13 |
| DLBC | TSG | RPS15A | GNB2L1 | 0.914738932 | 1.00E-19 |
| GBM | Cell metabolism gene | RPS15A | LSM1 | 0.804099938 | 3.05E-40 |
| GBM | Cell metabolism gene | RPS15A | PFDN5 | 0.809654007 | 3.41E-41 |
| GBM | Cell metabolism gene | RPS15A | SSR4 | 0.812192538 | 1.22E-41 |
| GBM | Cell metabolism gene | RPS15A | ZNRD1 | 0.813683144 | 6.66E-42 |
| GBM | Cell metabolism gene | RPS15A | SNRPD2 | 0.814517738 | 4.72E-42 |
| GBM | Cell metabolism gene | RPS15A | PIGC | 0.815321965 | 3.39E-42 |
| GBM | Cell metabolism gene | RPS15A | FAU | 0.816954148 | 1.72E-42 |
| GBM | Cell metabolism gene | RPS15A | PSMA5 | 0.817546602 | 1.34E-42 |
| GBM | Cell metabolism gene | RPS15A | SNRPG | 0.839777954 | 5.85E-47 |
| GBM | Cell metabolism gene | RPS15A | SSR2 | 0.851576353 | 1.49E-49 |
| GBM | TSG | RPS15A | GAS5 | 0.827016443 | 2.22E-44 |
| HNSC | Cell metabolism gene | RPS15A | PFDN5 | 0.802332495 | 1.66E-128 |
| LGG | Cell metabolism gene | RPS15A | FAU | 0.852668628 | 5.47E-151 |
| LGG | CGC | RPS15A | NACA | 0.82849593 | 4.60E-135 |
| LGG | TSG | RPS15A | GAS5 | 0.816160203 | 7.19E-128 |
| LGG | TSG | RPS15A | GNB2L1 | 0.879087355 | 4.91E-172 |
| PRAD | Cell metabolism gene | RPS15A | TIMM9 | 0.802265704 | 7.05E-125 |
| PRAD | CGC | RPS15A | NACA | 0.827329922 | 2.24E-139 |
| PRAD | Epifactor | RPS15A | FBL | 0.812941114 | 8.73E-131 |
| PRAD | TSG | RPS15A | GNB2L1 | 0.807497135 | 1.00E-127 |
| THYM | Cell metabolism gene | RPS15A | PSMB7 | 0.811040877 | 1.02E-29 |
| THYM | Cell metabolism gene | RPS15A | PGLS | 0.812373551 | 6.96E-30 |
| THYM | Cell metabolism gene | RPS15A | POLR2I | 0.814609901 | 3.64E-30 |
| THYM | Cell metabolism gene | RPS15A | TIMM8B | 0.81626377 | 2.24E-30 |
| THYM | Cell metabolism gene | RPS15A | TIMM13 | 0.817111566 | 1.74E-30 |
| THYM | Cell metabolism gene | RPS15A | SSR2 | 0.822565249 | 3.37E-31 |
| THYM | Cell metabolism gene | RPS15A | PFDN5 | 0.828503502 | 5.28E-32 |
| THYM | Cell metabolism gene | RPS15A | SNRPD2 | 0.833763526 | 9.62E-33 |
| THYM | Cell metabolism gene | RPS15A | APRT | 0.835237449 | 5.90E-33 |
| THYM | Cell metabolism gene | RPS15A | FAU | 0.841693419 | 6.57E-34 |
| THYM | Cell metabolism gene | RPS15A | DPM2 | 0.843964212 | 2.97E-34 |
| THYM | Epifactor | RPS15A | ZNHIT1 | 0.800338663 | 1.97E-28 |
| THYM | Epifactor | RPS15A | BRMS1 | 0.805225679 | 5.22E-29 |
| THYM | Epifactor | RPS15A | TAF10 | 0.807401666 | 2.85E-29 |
| THYM | Epifactor | RPS15A | PRPF31 | 0.820819265 | 5.74E-31 |
| THYM | Epifactor | RPS15A | FBL | 0.839530533 | 1.39E-33 |
| THYM | TF | RPS15A | ZNF581 | 0.812438653 | 6.83E-30 |
| THYM | TF | RPS15A | REXO4 | 0.817581521 | 1.52E-30 |
| THYM | TSG | RPS15A | TSSC4 | 0.803932556 | 7.44E-29 |
| THYM | TSG | RPS15A | BRMS1 | 0.805225679 | 5.22E-29 |
| THYM | TSG | RPS15A | GNB2L1 | 0.819948831 | 7.47E-31 |
| UCS | Cell metabolism gene | RPS15A | PSMB7 | 0.811040877 | 1.02E-29 |
| UCS | Cell metabolism gene | RPS15A | PGLS | 0.812373551 | 6.96E-30 |
| UCS | Cell metabolism gene | RPS15A | POLR2I | 0.814609901 | 3.64E-30 |
| UCS | Cell metabolism gene | RPS15A | TIMM8B | 0.81626377 | 2.24E-30 |
| UCS | Cell metabolism gene | RPS15A | TIMM13 | 0.817111566 | 1.74E-30 |
| UCS | Cell metabolism gene | RPS15A | SSR2 | 0.822565249 | 3.37E-31 |
| UCS | Cell metabolism gene | RPS15A | PFDN5 | 0.828503502 | 5.28E-32 |
| UCS | Cell metabolism gene | RPS15A | SNRPD2 | 0.833763526 | 9.62E-33 |
| UCS | Cell metabolism gene | RPS15A | APRT | 0.835237449 | 5.90E-33 |
| UCS | Cell metabolism gene | RPS15A | FAU | 0.841693419 | 6.57E-34 |
| UCS | Cell metabolism gene | RPS15A | DPM2 | 0.843964212 | 2.97E-34 |
| UCS | Epifactor | RPS15A | ZNHIT1 | 0.800338663 | 1.97E-28 |
| UCS | Epifactor | RPS15A | BRMS1 | 0.805225679 | 5.22E-29 |
| UCS | Epifactor | RPS15A | TAF10 | 0.807401666 | 2.85E-29 |
| UCS | Epifactor | RPS15A | PRPF31 | 0.820819265 | 5.74E-31 |
| UCS | Epifactor | RPS15A | FBL | 0.839530533 | 1.39E-33 |
| UCS | TF | RPS15A | ZNF581 | 0.812438653 | 6.83E-30 |
| UCS | TF | RPS15A | REXO4 | 0.817581521 | 1.52E-30 |
| UCS | TSG | RPS15A | TSSC4 | 0.803932556 | 7.44E-29 |
| UCS | TSG | RPS15A | BRMS1 | 0.805225679 | 5.22E-29 |
| UCS | TSG | RPS15A | GNB2L1 | 0.819948831 | 7.47E-31 |
| UVM | Cell metabolism gene | RPS15A | TIMM9 | 0.812595203 | 5.68E-20 |
| UVM | CGC | RPS15A | NACA | 0.823020577 | 7.52E-21 |
| UVM | TSG | RPS15A | GAS5 | 0.822322883 | 8.65E-21 |
Top |
|
| Protein 3D structure Visit iCn3D. |
Top |
|
| Protein-protein interaction networks * Overlap between up-regulated DEGs (log2FC<-1 and adj.P<0.05) and STRING PPI network (center: Translation factor, node: DEGs, edges: weighted by -log2(adj.P)) |
 |
| Overlap between down-regulated DEGs (log2FC>1 and adj.P<0.05) and STRING PPI network (center: Translation factor, node: DEGs, edges: weighted by -log2(adj.P)) |
 |
 * Edge colors based on TCGA cancer types. |
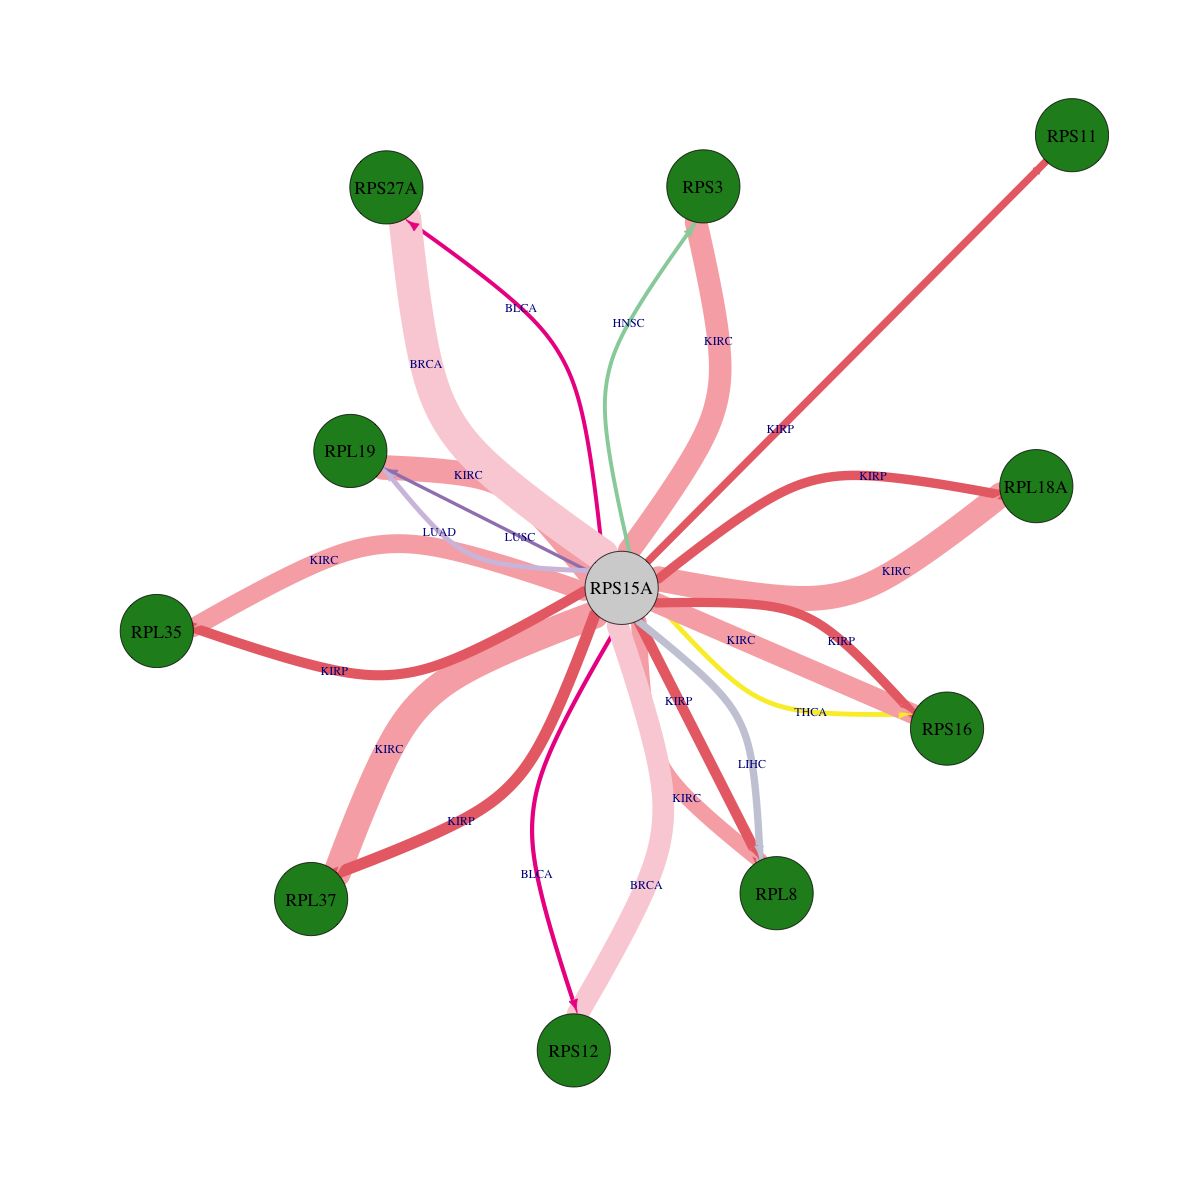
| * Overlap between DEGs (log2FC>1 and adj.P<0.05) and STRING PPI network per cancer (center: Translation factor, node: DEGs, node color: log2FC, edges: weighted by -log2(adj.P)) |
 |
| Cancer type | Translation factor | Interacting protein coding gene | FC | adj.pval |
| KIRP | RPS15A | RPL18A | -1.51651392808885 | 0.00016188295558095 |
| KICH | RPS15A | RPS27A | 1.75396693785956 | 0.000187873840332031 |
| KIRP | RPS15A | RPS16 | -1.35957043617517 | 0.00019507110118866 |
| COAD | RPS15A | RPS3 | 1.48730375143014 | 0.000411599874496461 |
| KIRP | RPS15A | RPS11 | -1.01861570565103 | 0.00105937570333481 |
| LIHC | RPS15A | RPL8 | -4.84588284974558 | 0.00110314154326131 |
| PRAD | RPS15A | RPL18A | 1.40600175748499 | 0.00205137828390396 |
| KICH | RPS15A | RPL19 | 1.36901182894089 | 0.00250792503356934 |
| KICH | RPS15A | RPS12 | 1.26997381758431 | 0.00308787822723389 |
| LUAD | RPS15A | RPL19 | -1.31398026615725 | 0.00993159558412698 |
| THCA | RPS15A | RPS16 | -6.16322798156577 | 0.0115764821363307 |
| BLCA | RPS15A | RPS12 | -1.47804673440421 | 0.0204124450683594 |
| BLCA | RPS15A | RPS27A | -1.04747470069188 | 0.0258216857910156 |
| HNSC | RPS15A | RPS3 | -4.73505819095135 | 0.0273726439852453 |
| COAD | RPS15A | RPS11 | 1.35307548998204 | 0.0312207043170929 |
| LUSC | RPS15A | RPL19 | -2.14669889516666 | 0.044366810398747 |
| KIRC | RPS15A | RPL19 | -2.73485271276676 | 1.33980982873695e-10 |
| BRCA | RPS15A | RPS12 | -4.91239327478244 | 1.85340619742495e-09 |
| KIRP | RPS15A | RPL37 | -1.17421621947139 | 2.26888805627823e-05 |
| KIRC | RPS15A | RPL35 | -1.06475238059392 | 2.72286325678163e-08 |
| KIRC | RPS15A | RPL8 | -1.18252459971773 | 5.64962994208288e-07 |
| KIRP | RPS15A | RPL8 | -1.53003692350119 | 6.0301274061203e-05 |
| KIRC | RPS15A | RPS16 | -1.66149869889384 | 7.8509870430991e-09 |
| BRCA | RPS15A | RPS27A | -4.28512148200424 | 7.8788217967112e-14 |
| KIRC | RPS15A | RPL37 | -2.87198822058464 | 8.03913394748564e-12 |
| KIRP | RPS15A | RPL35 | -1.52981101975496 | 9.0546440333128e-05 |
| KIRC | RPS15A | RPS3 | -1.29560847926387 | 9.05905681935088e-10 |
| KIRC | RPS15A | RPL18A | -4.43079304960843 | 9.2516163152192e-11 |
| Protein-protein interactors with this translation factor (BIOGRID-3.4.160) |
| PPI interactors with RPS15A |
| EWSR1, ELF5, MGMT, CALM1, CDC37, PCK1, VHL, RAD21, HDGF, CUL3, CUL4A, CUL5, CUL2, CDK2, CUL1, COPS5, COPS6, CAND1, NEDD8, RPL10A, RPL10, RPL11, RPL12, RPL14, RPL15, RPL18A, RPL18, RPL19, RPL21, RPL23, RPL24, RPL27, RPL30, RPL31, RPL37A, RPL4, RPL5, RPL6, RPL7A, RPL7, RPL9, RPS10, RPS11, RPS12, RPS13, RPS14, RPS19, RPS26, RPS3A, RPS3, RPS4X, RPS5, RPS6, RPS7, RPS8, RPSA, RPS23, RPS16, RPS17, RPLP1, RPS24, RPLP2, RPL23A, RPS2, RPLP0, RPS20, RPS15, RPL3, RPL13, RPL38, RPL29, RPS21, RPL17, RPL32, RPS27A, EEF1A1, EEF2, NOP56, FBL, HNRNPU, GNL3, SLC25A5, ILF3, ILF2, NOP58, MOV10, TUFM, NHP2L1, HNRNPM, ACTA2, EIF6, HSP90AA1, RPLP0P6, RPL10L, GALNT2, NOP2, NIFK, MRPS14, UBA2, GNL1, HIST1H2AD, HSPA8, ATP5A1, HNRNPA0, PSMB1, ESR1, SMURF1, FN1, VCAM1, UBL4A, ITGA4, PAN2, PSMC1, PSMC6, PSMD11, PSMD3, FAU, PNO1, PSMD1, RPS18, RPS25, RPS27, RPS27L, RPS29, RPS9, WDR26, WIBG, RPS28, TSR1, ZBTB1, CEP250, CEP57, CEP76, TUBG1, HUWE1, RNF2, EGFR, DIMT1, IMP3, MPHOSPH10, MRPL14, MRPL16, MRPL22, MRPS7, RPL13A, RPL27A, RPL28, RPL34, RPL35, RPL37, DDX18, RPL22, RPL35A, RPL36, RPL8, VAPA, LOC101929876, TUBB, TUBB2B, TUBB4B, UBA52, SFN, PTEN, AHSA1, EXOSC1, Cbx1, Eif3a, Eif3e, Eif3i, Rpl35, Srp72, Rrbp1, UBE3A, MCM2, Ksr1, RHOU, RC3H1, ZNF746, HNRNPA1, CYLD, TRIM25, UBE2A, HEY1, BRCA1, HDAC6, FBXO7, RMND5A, TMPO, ACO2, API5, COPE, CSNK1A1, GSK3A, LARS, ADSL, ADSS, BCL2L1, BMP4, CDK9, CTNNB1, MED12, PCBP1, TGFB1, UBE2L6, PRPF8, AAR2, PIH1D1, EFTUD2, AKTIP, CHD3, CHD4, RIOK1, HEXIM1, MEPCE, LARP7, AGR2, RECQL4, REST, MYC, RPS6KB2, GRWD1, METTL14, KIAA1429, EIF4B, RC3H2, PHB, DISC1, NR2C2, UCHL3, PPP1CC, CTCF, ATXN3, VRK1, VRK3, SNRNP70, ITFG1, ARAF, HMGB1, ABCC6, BIRC3, NFX1, WWP2, SOX2, TRIM28, ARIH2, PLEKHA4, PINK1, YAP1, TFCP2, FANCD2, ZC3H18, ANKRD55, ERCC6, DDX19B, IGF2BP1, NXF1, PARN, DUX4, CIT, ANLN, CHMP4C, ECT2, KIF14, KIF20A, KIF23, PRC1, AUH, LONP1, FASN, CLPP, LRRC59, INS, NDN, BRD4, NINL, CIC, Apc2, TMEM259, RBM39, FBP1, LGALS9, RIN3, DDX58, BAG5, PARK2, UFL1, DDRGK1, COIL, DHFRL1, LAMTOR1, ATG10, ATG3, FZR1, UBC, PAGE4, FAT4, RPSAP58, ZNF346, SPRTN, BTF3, FBXW7, UBR5, nsp1, RCHY1, CCNF, PSMD9, ZEB1, |
Top |
|
| Clinically associated variants from ClinVar. |
| Gene | Chr | Position | RefSeq | VarSeq | RefSeeq | VarType | Pathogenic | Disease | VarInfo |
| RPS15A | chr16 | 18799385 | C | T | single_nucleotide_variant | Pathogenic | Diamond-Blackfan_anemia_20 | SO:0001819|synonymous_variant | SO:0001819|synonymous_variant |
| RPS15A | chr16 | 18799615 | C | A | single_nucleotide_variant | Benign | not_provided | SO:0001627|intron_variant | SO:0001627|intron_variant |
| RPS15A | chr16 | 18800638 | G | C | single_nucleotide_variant | Benign | not_provided | SO:0001627|intron_variant | SO:0001627|intron_variant |
| nsSNVs with sample frequency (size of circle) from TCGA 33 cancers. |
 |
| SNVs and Indels |
| Gene | Cancer type | Chromosome | Start | End | RefSeeq | MutSeq | Mutation type | AAchange | # samples |
| RPS15A | UCEC | chr16 | 18794371 | 18794371 | C | T | Missense_Mutation | p.R118Q | 2 |
| RPS15A | UCEC | chr16 | 18794397 | 18794397 | G | A | Silent | p.G109 | 2 |
| RPS15A | READ | chr16 | 18796086 | 18796086 | A | C | Missense_Mutation | p.N91K | 1 |
| RPS15A | SARC | chr16 | 18800247 | 18800247 | C | T | RNA | NULL | 1 |
| RPS15A | SKCM | chr16 | 18794349 | 18794349 | G | A | Silent | p.I125I | 1 |
| RPS15A | BLCA | chr16 | 18796141 | 18796141 | C | A | Missense_Mutation | 1 | |
| RPS15A | UCEC | chr16 | 18794397 | 18794397 | G | A | Silent | p.G109G | 1 |
| RPS15A | ESCA | chr16 | 18795982 | 18795983 | - | A | RNA | NULL | 1 |
| RPS15A | HNSC | chr16 | 18796110 | 18796110 | G | C | Silent | 1 | |
| RPS15A | HNSC | chr16 | 18796121 | 18796121 | C | T | Missense_Mutation | 1 | |
| RPS15A | HNSC | chr16 | 18796110 | 18796110 | G | C | Silent | p.L83L | 1 |
| RPS15A | HNSC | chr16 | 18796121 | 18796121 | C | T | Missense_Mutation | p.D80N | 1 |
| RPS15A | LIHC | chr16 | 18799445 | 18799445 | T | C | Silent | 1 | |
| RPS15A | LIHC | chr16 | 18796111 | 18796111 | A | G | Missense_Mutation | 1 |
| Copy number variation (CNV) of RPS15A * Click on the image to open the original image in a new window. |
 |
| Fusion gene breakpoints (product of the structural variants (SVs)) across RPS15A * Click on the image to open the UCSC genome browser with custom track showing this image in a new window. |
 |
| Fusion genes with this translation factor from FusionGDB2.0. |
| FusionGDB2 ID | Disease | Sample | Hgene | Hchr | Hbp | Hstrand | Tgene | Tchr | Tbp | Tstrand |
| 99238 | N/A | AK054921 | CDR1 | chrX | 139866517 | + | RPS15A | chr16 | 18801656 | - |
| 99238 | COAD | TCGA-5M-AAT4-01A | KIAA0907 | chr1 | 155884004 | - | RPS15A | chr16 | 18801659 | - |
| 99238 | N/A | AW772792 | P2RY6 | chr11 | 72984135 | - | RPS15A | chr16 | 18794291 | + |
| 99238 | Non-Cancer | 5381N | PGA3 | chr11 | 60975962 | + | RPS15A | chr16 | 18800440 | - |
| 99238 | LIHC | TCGA-BC-A10T-01A | PKD1 | chr16 | 2185476 | - | RPS15A | chr16 | 18796145 | - |
| 99238 | READ | TCGA-AG-3586 | PTPRK | chr6 | 128505576 | - | RPS15A | chr16 | 18800440 | - |
| 84059 | BRCA | TCGA-A2-A0D2-01A | RPS15A | chr16 | 18796060 | - | ARL6IP1 | chr16 | 18810156 | - |
| 90077 | N/A | BM015299 | RPS15A | chr16 | 18794291 | - | CLNS1A | chr11 | 77256179 | + |
| 77428 | N/A | BE737542 | RPS15A | chr16 | 18794290 | - | LEPROTL1 | chr8 | 29974849 | - |
| 77428 | N/A | CF123929 | RPS15A | chr16 | 18794291 | - | LEPROTL1 | chr8 | 29974886 | - |
| 92573 | STAD | TCGA-CD-5798-01A | RPS15A | chr16 | 18799385 | - | PICALM | chr11 | 85689136 | - |
| 101492 | N/A | BI856629 | RPS15A | chr16 | 18794285 | - | PNPLA8 | chr7 | 108138445 | + |
| 77428 | STAD | TCGA-CD-A48C-01A | RPS15A | chr16 | 18800338 | - | RHOG | chr11 | 3848287 | - |
| 89508 | N/A | BI860288 | RPS15A | chr16 | 18794291 | - | TMTC2 | chr12 | 83489029 | - |
| 99238 | BRCA | TCGA-A2-A0CM-01A | SMG1 | chr16 | 18937272 | - | RPS15A | chr16 | 18800440 | - |
| 99238 | N/A | BE716419 | SPRR3 | chr1 | 152976131 | + | RPS15A | chr16 | 18800992 | + |
| 99238 | N/A | AI076857 | TSNAX-DISC1 | chr1 | 231713444 | + | RPS15A | chr16 | 18794277 | + |
| 99242 | N/A | AW772569 | WHSC1 | chr4 | 1900438 | + | RPS15A | chr16 | 18794290 | + |
Top |
|
| Kaplan-Meier plots with logrank tests of overall survival (OS) |
 |
| Cancer type | Translation factor | Coefficent | Hazard ratio | Wald test pval | Likelihool ratio pval | Logrank test pval | # samples |
Top |
|
| Differential gene expression between female and male. (Wilcoxon test, pval<0.05) |
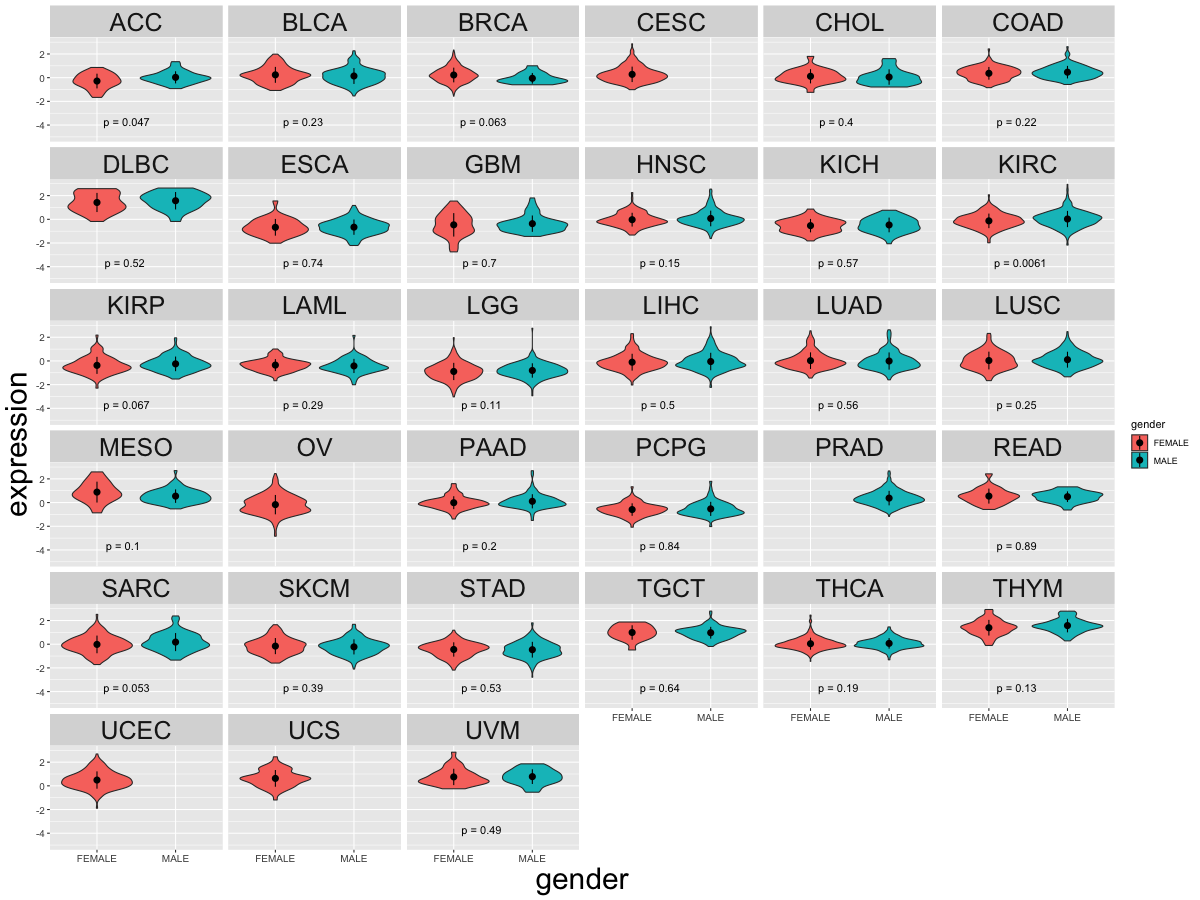 |
| Cancer type | Translation factor | pval | adj.p |
| KIRC | RPS15A | 0.00607538742026996 | 0.17 |
| ACC | RPS15A | 0.0469424239747989 | 1 |
Top |
|
| Differential gene expression between young and old age groups (Wilcoxon test, pval<0.05) |
 |
| Cancer type | Translation factor | pval | adj.p |
| LUSC | RPS15A | 0.00222669927988954 | 0.073 |
| LGG | RPS15A | 0.0446885084952609 | 1 |
| BRCA | RPS15A | 0.0354070664924308 | 1 |
| PAAD | RPS15A | 0.00767493444165259 | 0.25 |
Top |
|
| Drugs targeting genes involved in this translation factor. (DrugBank Version 5.1.8 2021-05-08) |
| UniProtAcc | DrugBank ID | Drug name | Drug activity | Drug type | Drug status |
Top |
|
| Diseases associated with this translation factor. (DisGeNet 4.0) |
| Disease ID | Disease Name | # PubMeds | Disease source |
| C1260899 | Anemia, Diamond-Blackfan | 1 | ORPHANET |
| C2931850 | Aase Smith syndrome 2 | 1 | ORPHANET |
(UTHealth)
Web File Viewing | Emergency Information |Campus Carry|Site Policies