
|
||||||
|

Translation Factor: RPS17 (NCBI Gene ID:6218) |
|
 Gene Summary Gene Summary |
| Gene Information | Gene Name: RPS17 | Gene ID: 6218 | Gene Symbol | RPS17 | Gene ID | 6218 |
| Gene Name | ribosomal protein S17 | |
| Synonyms | DBA4|RPS17L|RPS17L1|RPS17L2|S17 | |
| Cytomap | 15q25.2 | |
| Type of Gene | protein-coding | |
| Description | 40S ribosomal protein S17small ribosomal subunit protein eS17 | |
| Modification date | 20200313 | |
| UniProtAcc | P08708 | |
| Child GO biological process term(s) under GO:0006412 |
| GO ID | GO term |
| GO:0005840 | Ribosome |
| GO:0002181 | Cytoplasmic translation |
| GO:0006413 | Translational initiation |
| GO:0006412 | Translation |
| Gene ontology of translaction factor with evidence of Inferred from Direct Assay (IDA) from Entrez |
| Partner | Gene | GO ID | GO term | PubMed ID |
| Inferred gene age of translation factor. |
| Gene | Inferred gene age group among (0 - 67.6], (67.6 - 355.7], (355.7 - 733], (733 - 1119.25], >1119.25 |
| RPS17 | (733 - 1119.25] |
Top |
|
| We searched PubMed using 'RPS17[title] AND translation [title] AND human.' |
| Gene | Title | PMID |
| RPS17 | . | . |
Top |
|
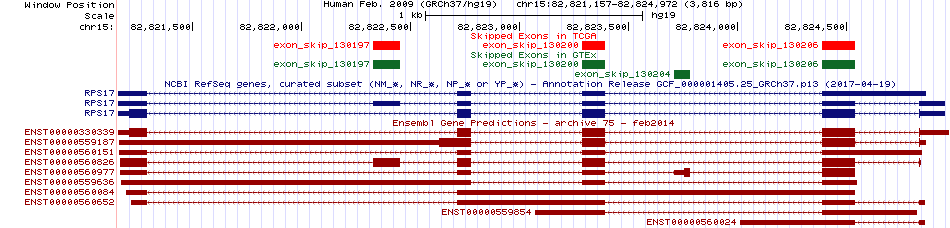
| Skipped exons in TCGA and GTEx based on Ensembl gene isoform structure. * Click on the image to open the UCSC genome browser with custom track showing this image in a new window. For more annotations, please visit our ExonSkipDB. |
 |
| Open reading frame (ORF) analsis of exon skipping events based on Ensembl gene isoform structure. * Click on the break point to see the gene structure around the break point region using the UCSC Genome Browser. |
| ENST | Exon skip start (DNA) | Exon Skip end (DNA) | ORF |
| Exon skipping position in the amino acid sequence. |
| ENST | Exon skip start (DNA) | Exon Skip end (DNA) | Len(transcript seq) | Exon skip start (mRNA) | Exon Skip end (mRNA) | Len(amino acid seq) | Exon skip start (AA) | Exon Skip end (AA) |
| Potentially (partially) lost protein functional features of UniProt. |
| UniProtAcc | Exon skip start (AA) | Exon Skip end (AA) | Function feature start (AA) | Function feature end (AA) | Functional feature type | Functional feature desc. |
Top |
|
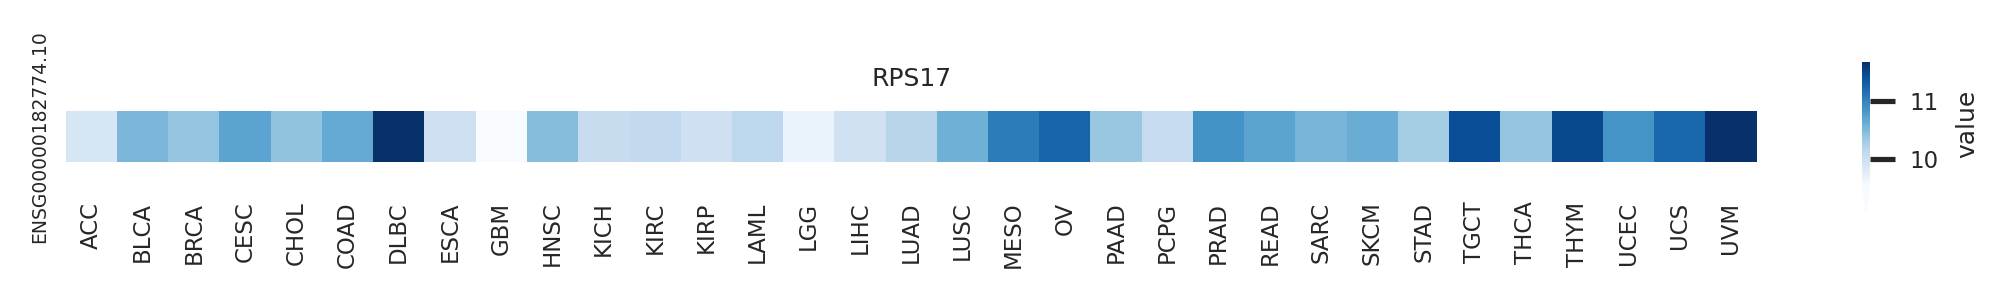
| Gene expression level across TCGA pancancer |
 |
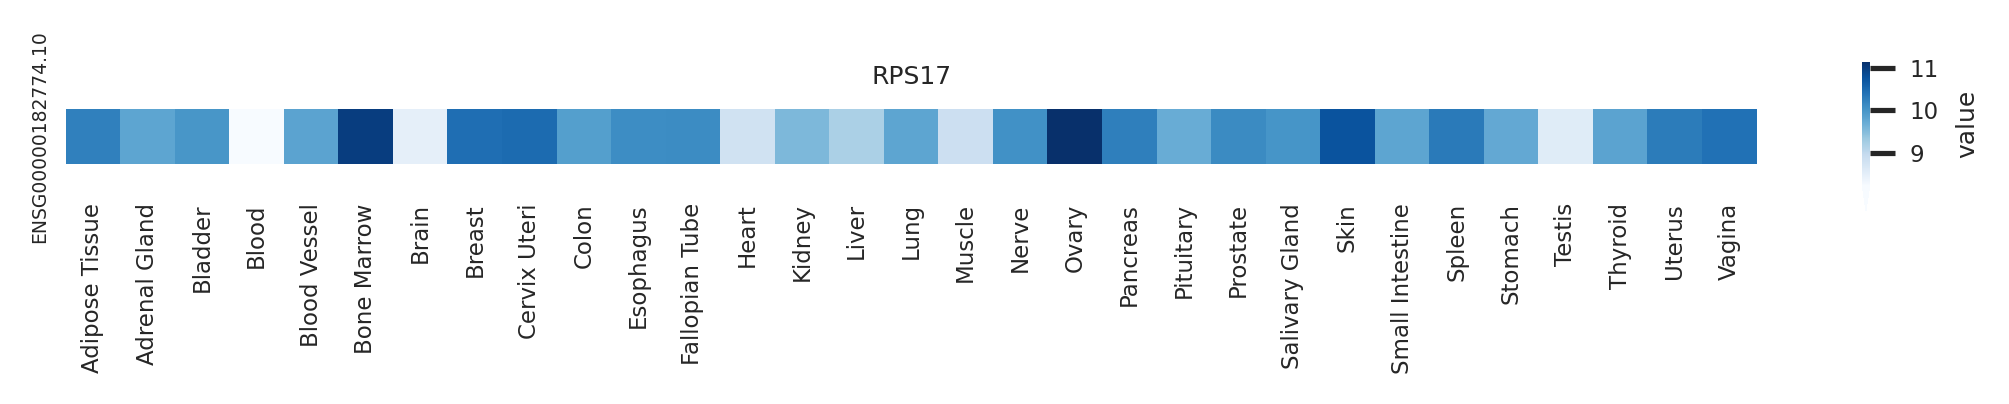
| Gene expression level across GTEx pantissue |
 |
| Expression level of gene isoforms across TCGA pancancer |
 |
| Expression level of gene isoforms across GTEx pantissue |
 |
| Cancer(tissue) type-specific expression level of Translation factor using z-score distriution |
 |
| Differential expression between tumor and matched normal (in the cancer types with more than 10 matched samples) |
 |
| Cancer type | Translation factor | FC | adj.pval |
| KICH | RPS17 | -9.74128123960814 | 0.000556409358978271 |
| HNSC | RPS17 | -1.41932406270792 | 0.00608886057921154 |
| KIRC | RPS17 | -1.14106059335771 | 1.12651178935203e-06 |
Top |
|
| Translation factor expression regulation through miRNA binding |
| Cancer type | Gene | miRNA | TargetScan binding score (Context++ score percentile) | Coefficient | Pvalue |
| Translation factor expression regulation through methylation in the promoter of Translation factor |
| Cancer type | Gene | methyl group b | methyl group a | DEG pval | avg methyl in b | avg methyl in a | avg exp in b | avg exp in a |
| Translation factor expression regulation through methylation in the gene body of Translation factor (positive regulation) |
| Cancer type | Gene | methyl group b | methyl group a | DEG pval | avg methyl in b | avg methyl in a | avg exp in b | avg exp in a |
| Translation factor expression regulation through copy number variation of Translation factor |
| Cancer type | Gene | Coefficient | Pvalue |
| GBM | RPS17 | 0.119115619 | 0.029152604 |
| LGG | RPS17 | 0.051478636 | 0.030179778 |
Top |
|
| Strongly correlated genes belong to cellular important gene groups with RPS17 (coefficient>0.8, pval<0.05, node color based on FC between tumor and matched normal). Significantly associated important genes in the individual cancer types. * Cell metabolism gene: cell metabolism genes from REACTOME (black edge), IUPHAR: drug target genes from IUPHAR (blue edge), Kinase: human kinase genes (brown edge), CGC: cancer gene census genes (orange edge), TSG: tumor suppresor genes (purple edge), Epifactor: epigenetic factors (light blue edge), TF: transcription factors (green) |
 |
| Cancer type | Gene group | Translation factor | Correlated gene | Coefficient | Pvalue |
| CHOL | Cell metabolism gene | RPS17 | SNRPD2 | 0.806270215 | 2.33E-11 |
| CHOL | CGC | RPS17 | NACA | 0.838840511 | 6.29E-13 |
| CHOL | Epifactor | RPS17 | FBL | 0.803069637 | 3.20E-11 |
| DLBC | Cell metabolism gene | RPS17 | FAU | 0.801637237 | 7.61E-12 |
| DLBC | Cell metabolism gene | RPS17 | HSCB | 0.810705374 | 2.88E-12 |
| DLBC | Cell metabolism gene | RPS17 | SNRPD2 | 0.848059372 | 2.81E-14 |
| DLBC | Cell metabolism gene | RPS17 | TOMM22 | 0.849790554 | 2.20E-14 |
| DLBC | Cell metabolism gene | RPS17 | NME2 | 0.85107516 | 1.84E-14 |
| DLBC | CGC | RPS17 | NACA | 0.851944477 | 1.62E-14 |
| DLBC | Epifactor | RPS17 | FBL | 0.821133746 | 8.82E-13 |
| DLBC | TF | RPS17 | NME2 | 0.85107516 | 1.84E-14 |
| DLBC | TSG | RPS17 | GNB2L1 | 0.878962887 | 2.13E-16 |
| GBM | TSG | RPS17 | GAS5 | 0.823403727 | 1.09E-43 |
| PRAD | Cell metabolism gene | RPS17 | SNRPD2 | 0.804786038 | 3.07E-126 |
| PRAD | CGC | RPS17 | NACA | 0.815258345 | 4.06E-132 |
| PRAD | Epifactor | RPS17 | FBL | 0.816176305 | 1.19E-132 |
| PRAD | TSG | RPS17 | GAS5 | 0.811293114 | 7.54E-130 |
| PRAD | TSG | RPS17 | GNB2L1 | 0.826512429 | 7.23E-139 |
| THYM | Cell metabolism gene | RPS17 | SNRPD1 | 0.800447329 | 1.92E-28 |
| THYM | Cell metabolism gene | RPS17 | SNRPE | 0.801415747 | 1.48E-28 |
| THYM | Cell metabolism gene | RPS17 | PSMC3 | 0.802553706 | 1.08E-28 |
| THYM | Cell metabolism gene | RPS17 | PFDN5 | 0.803528736 | 8.31E-29 |
| THYM | Cell metabolism gene | RPS17 | EBP | 0.806046836 | 4.16E-29 |
| THYM | Cell metabolism gene | RPS17 | ITPA | 0.808681406 | 1.99E-29 |
| THYM | Cell metabolism gene | RPS17 | SSR2 | 0.809122348 | 1.76E-29 |
| THYM | Cell metabolism gene | RPS17 | PSMB3 | 0.814870889 | 3.37E-30 |
| THYM | Cell metabolism gene | RPS17 | EXOSC5 | 0.816312994 | 2.21E-30 |
| THYM | Cell metabolism gene | RPS17 | PSMB7 | 0.8250633 | 1.56E-31 |
| THYM | Cell metabolism gene | RPS17 | TIMM13 | 0.825190779 | 1.50E-31 |
| THYM | Cell metabolism gene | RPS17 | SNRPD3 | 0.827549902 | 7.14E-32 |
| THYM | Cell metabolism gene | RPS17 | POLR2H | 0.829186192 | 4.25E-32 |
| THYM | Cell metabolism gene | RPS17 | HMBS | 0.832150732 | 1.63E-32 |
| THYM | Cell metabolism gene | RPS17 | FAU | 0.839051749 | 1.63E-33 |
| THYM | Cell metabolism gene | RPS17 | SLC27A5 | 0.840873306 | 8.74E-34 |
| THYM | Cell metabolism gene | RPS17 | SNRPD2 | 0.84956148 | 3.95E-35 |
| THYM | Cell metabolism gene | RPS17 | TIMM8B | 0.853492705 | 9.12E-36 |
| THYM | Epifactor | RPS17 | NOC2L | 0.809149254 | 1.74E-29 |
| THYM | Epifactor | RPS17 | EXOSC5 | 0.816312994 | 2.21E-30 |
| THYM | Epifactor | RPS17 | SIRT6 | 0.820020126 | 7.31E-31 |
| THYM | Epifactor | RPS17 | BRMS1 | 0.83879938 | 1.78E-33 |
| THYM | Epifactor | RPS17 | TAF10 | 0.84641784 | 1.24E-34 |
| THYM | Epifactor | RPS17 | FBL | 0.847592875 | 8.10E-35 |
| THYM | IUPHAR | RPS17 | SIRT6 | 0.820020126 | 7.31E-31 |
| THYM | IUPHAR | RPS17 | SLC27A5 | 0.840873306 | 8.74E-34 |
| THYM | TF | RPS17 | ZNF511 | 0.80368251 | 7.97E-29 |
| THYM | TF | RPS17 | ZNF787 | 0.805056717 | 5.47E-29 |
| THYM | TSG | RPS17 | SIRT6 | 0.820020126 | 7.31E-31 |
| THYM | TSG | RPS17 | GNB2L1 | 0.833807787 | 9.48E-33 |
| THYM | TSG | RPS17 | BRMS1 | 0.83879938 | 1.78E-33 |
| UCS | Cell metabolism gene | RPS17 | SNRPD1 | 0.800447329 | 1.92E-28 |
| UCS | Cell metabolism gene | RPS17 | SNRPE | 0.801415747 | 1.48E-28 |
| UCS | Cell metabolism gene | RPS17 | PSMC3 | 0.802553706 | 1.08E-28 |
| UCS | Cell metabolism gene | RPS17 | PFDN5 | 0.803528736 | 8.31E-29 |
| UCS | Cell metabolism gene | RPS17 | EBP | 0.806046836 | 4.16E-29 |
| UCS | Cell metabolism gene | RPS17 | ITPA | 0.808681406 | 1.99E-29 |
| UCS | Cell metabolism gene | RPS17 | SSR2 | 0.809122348 | 1.76E-29 |
| UCS | Cell metabolism gene | RPS17 | PSMB3 | 0.814870889 | 3.37E-30 |
| UCS | Cell metabolism gene | RPS17 | EXOSC5 | 0.816312994 | 2.21E-30 |
| UCS | Cell metabolism gene | RPS17 | PSMB7 | 0.8250633 | 1.56E-31 |
| UCS | Cell metabolism gene | RPS17 | TIMM13 | 0.825190779 | 1.50E-31 |
| UCS | Cell metabolism gene | RPS17 | SNRPD3 | 0.827549902 | 7.14E-32 |
| UCS | Cell metabolism gene | RPS17 | POLR2H | 0.829186192 | 4.25E-32 |
| UCS | Cell metabolism gene | RPS17 | HMBS | 0.832150732 | 1.63E-32 |
| UCS | Cell metabolism gene | RPS17 | FAU | 0.839051749 | 1.63E-33 |
| UCS | Cell metabolism gene | RPS17 | SLC27A5 | 0.840873306 | 8.74E-34 |
| UCS | Cell metabolism gene | RPS17 | SNRPD2 | 0.84956148 | 3.95E-35 |
| UCS | Cell metabolism gene | RPS17 | TIMM8B | 0.853492705 | 9.12E-36 |
| UCS | Epifactor | RPS17 | NOC2L | 0.809149254 | 1.74E-29 |
| UCS | Epifactor | RPS17 | EXOSC5 | 0.816312994 | 2.21E-30 |
| UCS | Epifactor | RPS17 | SIRT6 | 0.820020126 | 7.31E-31 |
| UCS | Epifactor | RPS17 | BRMS1 | 0.83879938 | 1.78E-33 |
| UCS | Epifactor | RPS17 | TAF10 | 0.84641784 | 1.24E-34 |
| UCS | Epifactor | RPS17 | FBL | 0.847592875 | 8.10E-35 |
| UCS | IUPHAR | RPS17 | SIRT6 | 0.820020126 | 7.31E-31 |
| UCS | IUPHAR | RPS17 | SLC27A5 | 0.840873306 | 8.74E-34 |
| UCS | TF | RPS17 | ZNF511 | 0.80368251 | 7.97E-29 |
| UCS | TF | RPS17 | ZNF787 | 0.805056717 | 5.47E-29 |
| UCS | TSG | RPS17 | SIRT6 | 0.820020126 | 7.31E-31 |
| UCS | TSG | RPS17 | GNB2L1 | 0.833807787 | 9.48E-33 |
| UCS | TSG | RPS17 | BRMS1 | 0.83879938 | 1.78E-33 |
| UVM | Cell metabolism gene | RPS17 | SEC11A | 0.835069859 | 6.13E-22 |
Top |
|
| Protein 3D structure Visit iCn3D. |
Top |
|
| Protein-protein interaction networks * Overlap between up-regulated DEGs (log2FC<-1 and adj.P<0.05) and STRING PPI network (center: Translation factor, node: DEGs, edges: weighted by -log2(adj.P)) |
 |
| Overlap between down-regulated DEGs (log2FC>1 and adj.P<0.05) and STRING PPI network (center: Translation factor, node: DEGs, edges: weighted by -log2(adj.P)) |
 |
 * Edge colors based on TCGA cancer types. |
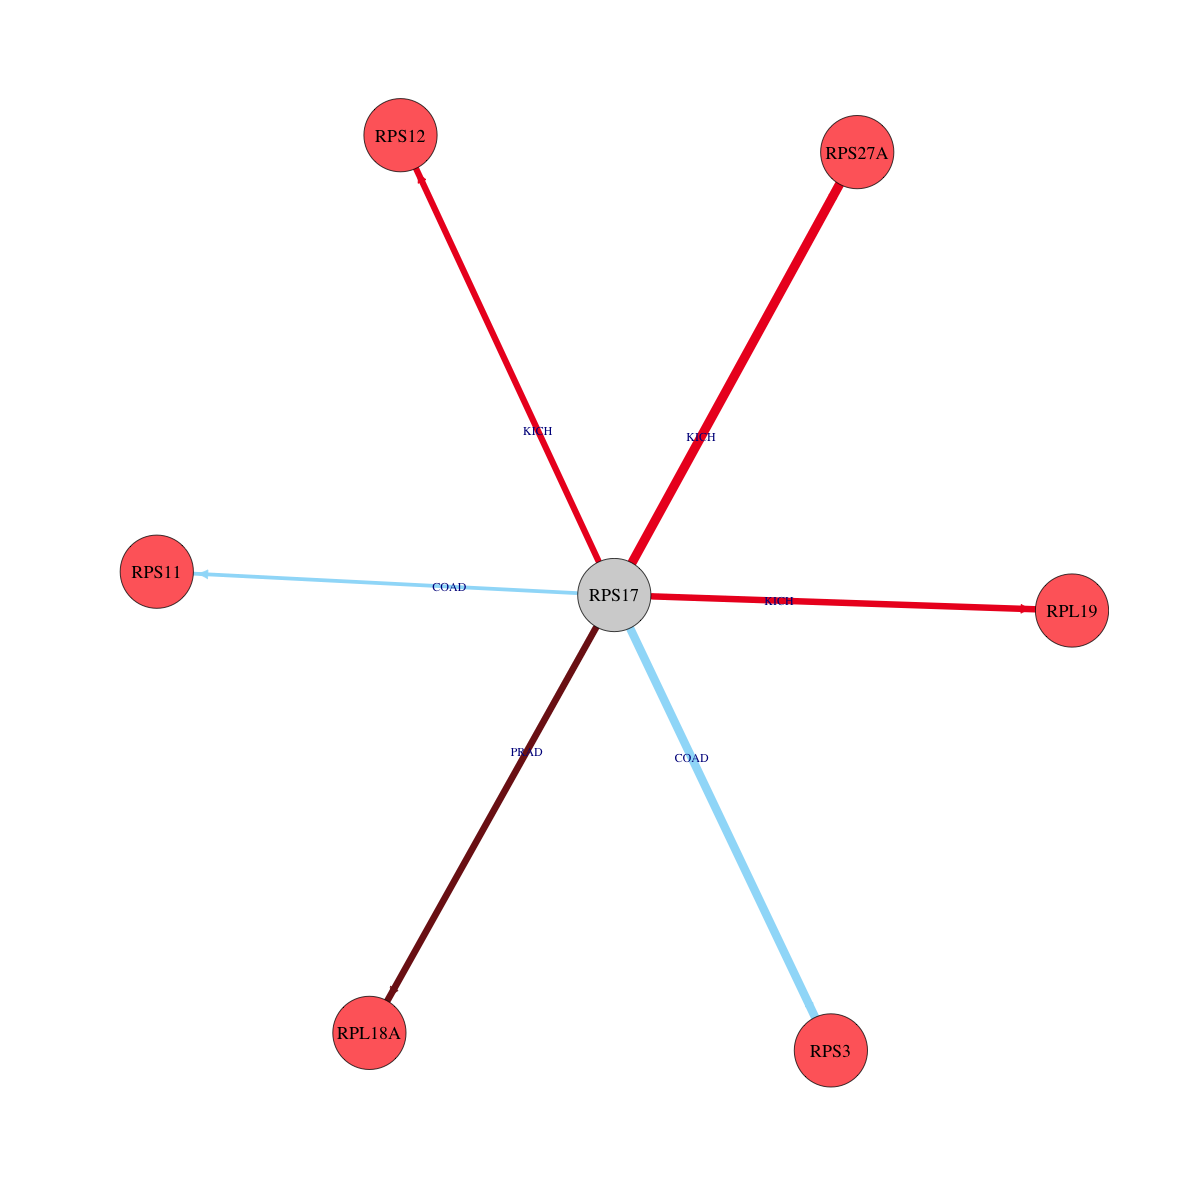
| * Overlap between DEGs (log2FC>1 and adj.P<0.05) and STRING PPI network per cancer (center: Translation factor, node: DEGs, node color: log2FC, edges: weighted by -log2(adj.P)) |
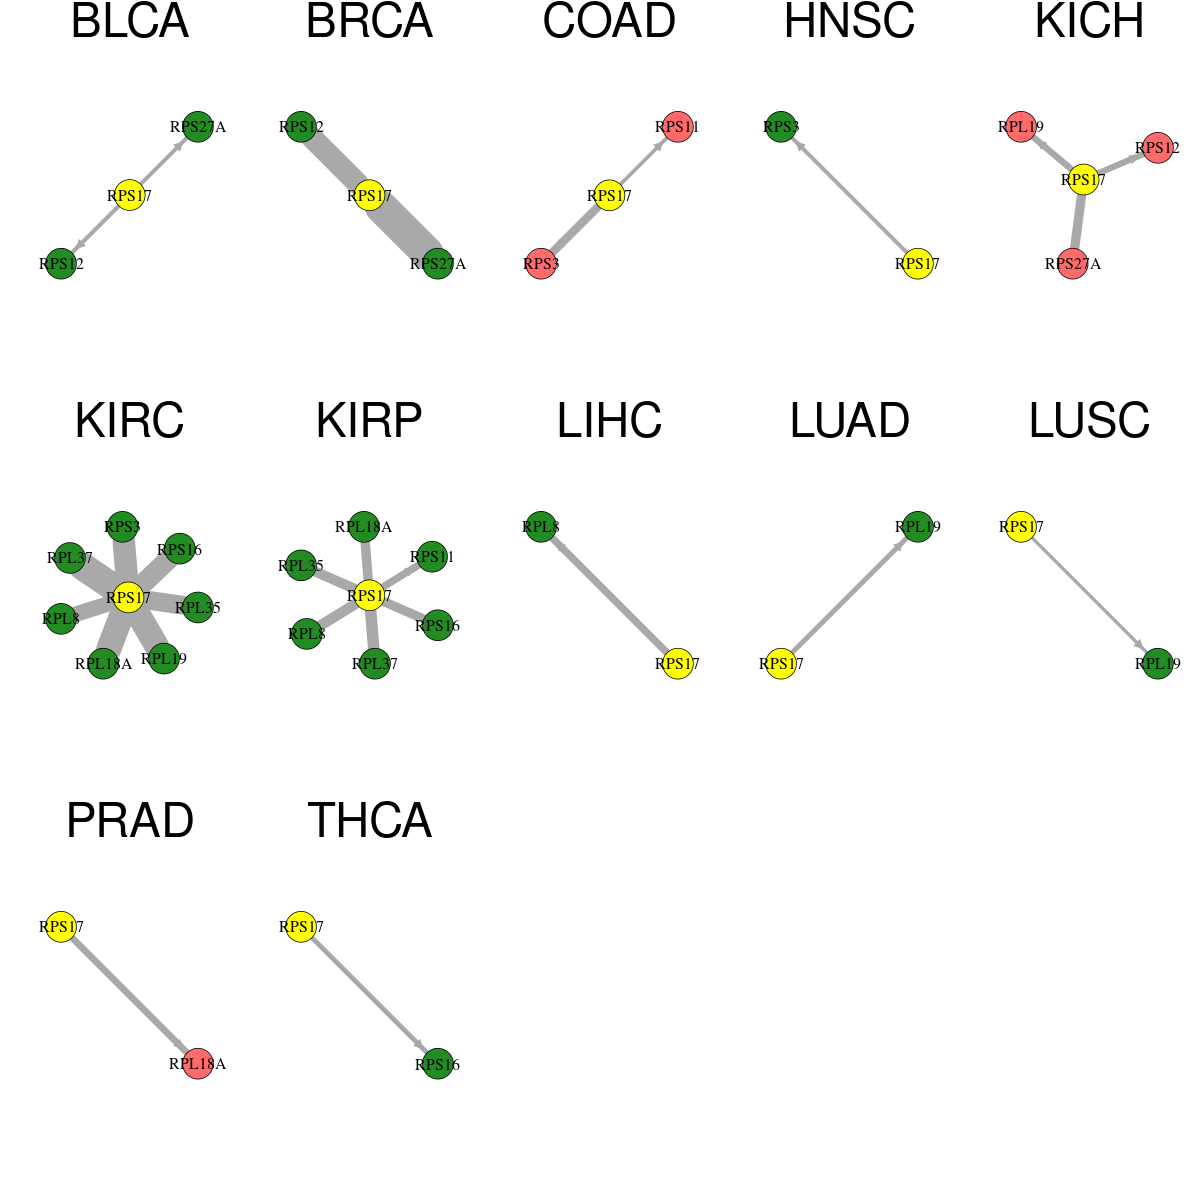 |
| Cancer type | Translation factor | Interacting protein coding gene | FC | adj.pval |
| KIRP | RPS17 | RPL18A | -1.51651392808885 | 0.00016188295558095 |
| KICH | RPS17 | RPS27A | 1.75396693785956 | 0.000187873840332031 |
| KIRP | RPS17 | RPS16 | -1.35957043617517 | 0.00019507110118866 |
| COAD | RPS17 | RPS3 | 1.48730375143014 | 0.000411599874496461 |
| KIRP | RPS17 | RPS11 | -1.01861570565103 | 0.00105937570333481 |
| LIHC | RPS17 | RPL8 | -4.84588284974558 | 0.00110314154326131 |
| PRAD | RPS17 | RPL18A | 1.40600175748499 | 0.00205137828390396 |
| KICH | RPS17 | RPL19 | 1.36901182894089 | 0.00250792503356934 |
| KICH | RPS17 | RPS12 | 1.26997381758431 | 0.00308787822723389 |
| LUAD | RPS17 | RPL19 | -1.31398026615725 | 0.00993159558412698 |
| THCA | RPS17 | RPS16 | -6.16322798156577 | 0.0115764821363307 |
| BLCA | RPS17 | RPS12 | -1.47804673440421 | 0.0204124450683594 |
| BLCA | RPS17 | RPS27A | -1.04747470069188 | 0.0258216857910156 |
| HNSC | RPS17 | RPS3 | -4.73505819095135 | 0.0273726439852453 |
| COAD | RPS17 | RPS11 | 1.35307548998204 | 0.0312207043170929 |
| LUSC | RPS17 | RPL19 | -2.14669889516666 | 0.044366810398747 |
| KIRC | RPS17 | RPL19 | -2.73485271276676 | 1.33980982873695e-10 |
| BRCA | RPS17 | RPS12 | -4.91239327478244 | 1.85340619742495e-09 |
| KIRP | RPS17 | RPL37 | -1.17421621947139 | 2.26888805627823e-05 |
| KIRC | RPS17 | RPL35 | -1.06475238059392 | 2.72286325678163e-08 |
| KIRC | RPS17 | RPL8 | -1.18252459971773 | 5.64962994208288e-07 |
| KIRP | RPS17 | RPL8 | -1.53003692350119 | 6.0301274061203e-05 |
| KIRC | RPS17 | RPS16 | -1.66149869889384 | 7.8509870430991e-09 |
| BRCA | RPS17 | RPS27A | -4.28512148200424 | 7.8788217967112e-14 |
| KIRC | RPS17 | RPL37 | -2.87198822058464 | 8.03913394748564e-12 |
| KIRP | RPS17 | RPL35 | -1.52981101975496 | 9.0546440333128e-05 |
| KIRC | RPS17 | RPS3 | -1.29560847926387 | 9.05905681935088e-10 |
| KIRC | RPS17 | RPL18A | -4.43079304960843 | 9.2516163152192e-11 |
| Protein-protein interactors with this translation factor (BIOGRID-3.4.160) |
| PPI interactors with RPS17 |
| CACNA1A, EBNA-LP, VHL, RAD21, ARRB1, ARRB2, CUL3, CDK2, CUL1, COPS5, CAND1, RPS4X, RPL14, RPL19, RPL21, RPL24, RPL27, RPL31, RPL37A, RPL6, RPLP2, RPS24, RPSA, RPS23, RPS16, RPL10, RPS2, RPS15A, RPL5, RPS26, RPL9, RPL12, RPS28, RPL23, RPL4, RPLP1, RPS9, RPL22, RPS15, RPS8, RPS7, RPS3A, RPS25, RPS3, RPL8, RPS13, RPL18, RPS6, RPS21, FAU, RPS29, ILF3, RBM28, RPLP0P6, SMURF1, FN1, VCAM1, NOS2, UBL4A, ITGA4, UL122, PAN2, TARDBP, RPS11, RPS10, RPS19, RPS20, rev, CDC37L1, NUDC, CEP250, CEP57, CEP76, TP53, TUBG1, TUBGCP3, HUWE1, RNF2, WDR76, FRMD5, RPS6KB2, RPL23A, RPLP0, LOC101929876, PTEN, XPO1, HIST1H3E, HNRNPU, NPM1, CKAP5, Cbx1, Ktn1, Rpl35, Srp72, Rrbp1, CRY2, MCM2, RC3H1, CDC73, ZNF746, HIST1H1E, RRS1, BHLHA15, NCL, CYLD, FOXA1, TRIM25, HEY1, HDAC6, TMPO, CTNNB1, HDAC4, YAF2, PRPF8, EFTUD2, AAR2, PIH1D1, RPTOR, CHD3, CHD4, LARP7, RNF31, TNF, CDC34, RIOK1, HEXIM1, MEPCE, RECQL4, REST, MYC, CDK9, Prkab1, GRWD1, KIAA1429, EIF4B, RC3H2, ZBTB7A, PHB, RBX1, PPP1CC, VRK1, VRK3, HIST1H4A, SNRNP70, DUSP15, DUSP5, MTMR2, PTP4A3, PTPN3, PTPN6, ITFG1, HMGB1, BIRC3, NFX1, ORF9b, SOX2, TRIM28, CMTR1, ARIH2, PLEKHA4, YAP1, TFCP2, FANCD2, HCVgp1, ZC3H18, ESR1, NEK4, DUX4, CIT, ANLN, AURKB, CHMP4B, CHMP4C, ECT2, KIF14, KIF20A, KIF23, PRC1, LRRC59, INS, BRD4, NUPR1, CIC, N, Apc2, RBM39, ASXL1, BAG5, UFL1, DDRGK1, ATG3, FZR1, ZBTB2, SRSF5, HIST1H1C, KRR1, HIST1H1B, HIST2H2AC, LIN28A, YBX2, HIST1H2AM, RPSAP58, FGF13, HIST1H1D, S100P, HIST1H2AE, SURF6, RPL35, ZNF346, SRSF6, HIST1H1A, NEIL1, SPRTN, BTF3, FBXW7, RCHY1, SQSTM1, PSMD9, Paxip1, PAGR1, Wdr82, KLF15, KLF16, KLF5, KLF8, SOX5, SOX6, |
Top |
|
| Clinically associated variants from ClinVar. |
| Gene | Chr | Position | RefSeq | VarSeq | RefSeeq | VarType | Pathogenic | Disease | VarInfo |
| RPS17 | chr15 | 82821296 | C | T | single_nucleotide_variant | Likely_benign | not_provided | SO:0001627|intron_variant | SO:0001627|intron_variant |
| RPS17 | chr15 | 82822729 | T | C | single_nucleotide_variant | Likely_benign | not_provided | SO:0001619|non-coding_transcript_variant,SO:0001819|synonymous_variant | SO:0001619|non-coding_transcript_variant,SO:0001819|synonymous_variant |
| RPS17 | chr15 | 82823346 | CCT | C | Microsatellite | Pathogenic | Diamond-Blackfan_anemia_4 | SO:0001589|frameshift_variant,SO:0001619|non-coding_transcript_variant | SO:0001589|frameshift_variant,SO:0001619|non-coding_transcript_variant |
| RPS17 | chr15 | 82823390 | A | C | single_nucleotide_variant | Pathogenic | Diamond-Blackfan_anemia_4 | SO:0001587|nonsense,SO:0001619|non-coding_transcript_variant | SO:0001587|nonsense,SO:0001619|non-coding_transcript_variant |
| RPS17 | chr15 | 82823390 | A | G | single_nucleotide_variant | Uncertain_significance | not_specified | SO:0001619|non-coding_transcript_variant,SO:0001819|synonymous_variant | SO:0001619|non-coding_transcript_variant,SO:0001819|synonymous_variant |
| RPS17 | chr15 | 82824389 | CCTG | C | Deletion | Uncertain_significance | not_provided | SO:0001619|non-coding_transcript_variant,SO:0001822|inframe_deletion | SO:0001619|non-coding_transcript_variant,SO:0001822|inframe_deletion |
| RPS17 | chr15 | 82824702 | G | C | single_nucleotide_variant | Benign | not_provided | SO:0001619|non-coding_transcript_variant,SO:0001627|intron_variant | SO:0001619|non-coding_transcript_variant,SO:0001627|intron_variant |
| RPS17 | chr15 | 82824835 | A | C | single_nucleotide_variant | Pathogenic | Diamond-Blackfan_anemia_4 | SO:0001582|initiatior_codon_variant,SO:0001583|missense_variant,SO:0001619|non-coding_transcript_variant | SO:0001582|initiatior_codon_variant,SO:0001583|missense_variant,SO:0001619|non-coding_transcript_variant |
| RPS17 | chr15 | 82824890 | A | T | single_nucleotide_variant | Benign | not_provided |
| nsSNVs with sample frequency (size of circle) from TCGA 33 cancers. |
| SNVs and Indels |
| Gene | Cancer type | Chromosome | Start | End | RefSeeq | MutSeq | Mutation type | AAchange | # samples |
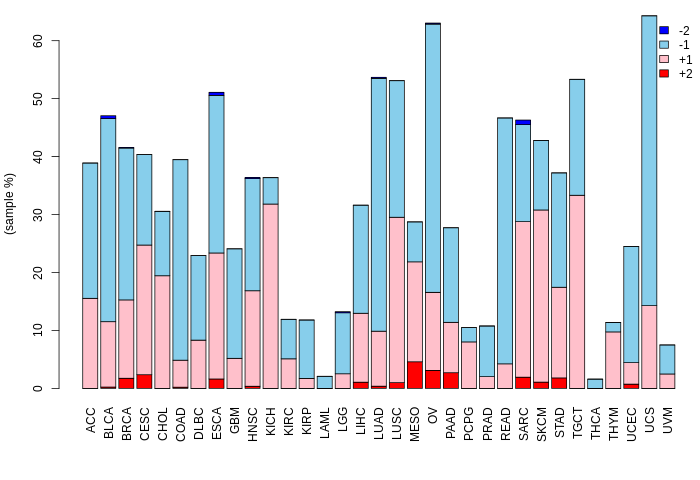
| Copy number variation (CNV) of RPS17 * Click on the image to open the original image in a new window. |
 |
| Fusion gene breakpoints (product of the structural variants (SVs)) across RPS17 * Click on the image to open the UCSC genome browser with custom track showing this image in a new window. |
 |
| Fusion genes with this translation factor from FusionGDB2.0. |
| FusionGDB2 ID | Disease | Sample | Hgene | Hchr | Hbp | Hstrand | Tgene | Tchr | Tbp | Tstrand |
| 101497 | N/A | AA535940 | C2orf91 | chr2 | 42178588 | + | RPS17 | chr15 | 83205503 | + |
| 101497 | N/A | BF244993 | CAPNS1 | chr19 | 36640761 | + | RPS17 | chr15 | 83209190 | - |
| 101497 | N/A | AI969969 | CCDC149 | chr4 | 24868413 | - | RPS17 | chr15 | 83205504 | + |
| 101497 | N/A | EC559380 | DNAH12 | chr3 | 57491138 | - | RPS17 | chr15 | 83208885 | - |
| 99621 | N/A | BI862080 | RPS17 | chr15 | 83205503 | - | ANK3 | chr10 | 62108102 | + |
| 96510 | N/A | BE905390 | RPS17 | chr15 | 83205504 | - | C11orf80 | chr11 | 66516340 | + |
| 82388 | N/A | BF687839 | RPS17 | chr15 | 83205509 | - | C20orf196 | chr20 | 5805289 | - |
| 92661 | OV | TCGA-04-1357-01A | RPS17 | chr15 | 82823333 | - | CD74 | chr5 | 149792312 | - |
| 77498 | N/A | CD240141 | RPS17 | chr15 | 83205506 | - | CES5AP1 | chr22 | 23720126 | + |
| 77498 | PRAD | TCGA-KC-A4BN | RPS17 | chr15 | 82822714 | - | CHAF1B | chr21 | 37759896 | + |
| 77498 | PRAD | TCGA-KC-A4BN-01A | RPS17 | chr15 | 83207057 | - | CHAF1B | chr21 | 37759896 | + |
| 102842 | N/A | AA527955 | RPS17 | chr15 | 83205503 | - | DAB1 | chr1 | 58573140 | + |
| 86779 | N/A | BM015885 | RPS17 | chr15 | 83205503 | - | KLHL28 | chr14 | 45406361 | - |
| 87220 | N/A | BG032138 | RPS17 | chr15 | 83205504 | - | MAP7 | chr6 | 136724043 | + |
| 77498 | N/A | CB219922 | RPS17 | chr15 | 83207104 | - | PTPN7 | chr1 | 202116297 | + |
| 101497 | N/A | AX340711 | RPS17 | chr15 | 83205570 | - | RPS17 | chr15 | 83208799 | - |
| 91964 | N/A | BI856351 | RPS17 | chr15 | 83205506 | - | SNX29 | chr16 | 12566388 | + |
| 101916 | OV | TCGA-25-1313-01A | RPS17 | chr15 | 82823337 | - | SPP1 | chr4 | 88896865 | + |
| 101916 | OV | TCGA-61-2000-01A | RPS17 | chr15 | 82823332 | - | SPP1 | chr4 | 88896869 | + |
| 101916 | OV | TCGA-61-2109-01A | RPS17 | chr15 | 82823336 | - | SPP1 | chr4 | 88896865 | + |
| 102816 | N/A | AX341364 | RPS17 | chr15 | 83208882 | + | SPTBN1 | chr2 | 54896741 | - |
| 101110 | N/A | BG034564 | RPS17 | chr15 | 83205506 | - | YPEL1 | chr22 | 22078879 | - |
| 77498 | N/A | AA506679 | RPS17 | chr15 | 83205512 | - | ZNF141 | chr4 | 336753 | - |
| 77498 | N/A | BC022370 | RPS17 | chr15 | 83205509 | - | ZNF141 | chr4 | 336753 | - |
| 77498 | N/A | BG032122 | RPS17 | chr15 | 83205504 | - | ZNF141 | chr4 | 336753 | - |
| 77498 | N/A | CN446909 | RPS17 | chr15 | 83205503 | - | ZNF141 | chr4 | 336753 | - |
| 101497 | Non-Cancer | TCGA-IN-8462-11A | SEC11A | chr15 | 85259256 | - | RPS17 | chr15 | 82824540 | - |
| 101497 | N/A | AA533301 | TYRO3 | chr15 | 41857799 | + | RPS17 | chr15 | 83205506 | + |
| 101497 | N/A | AA858143 | XKR6 | chr8 | 11025410 | - | RPS17 | chr15 | 83205506 | + |
| 101501 | N/A | AA229106 | ZNF141 | chr4 | 336753 | + | RPS17 | chr15 | 83205506 | + |
| 101501 | N/A | AA513246 | ZNF141 | chr4 | 336753 | + | RPS17 | chr15 | 83205504 | + |
| 101501 | N/A | AA654541 | ZNF141 | chr4 | 336753 | + | RPS17 | chr15 | 83205503 | + |
| 101501 | N/A | BE838490 | ZNF141 | chr4 | 336753 | + | RPS17 | chr15 | 83207056 | + |
Top |
|
| Kaplan-Meier plots with logrank tests of overall survival (OS) |
 |
| Cancer type | Translation factor | Coefficent | Hazard ratio | Wald test pval | Likelihool ratio pval | Logrank test pval | # samples |
Top |
|
| Differential gene expression between female and male. (Wilcoxon test, pval<0.05) |
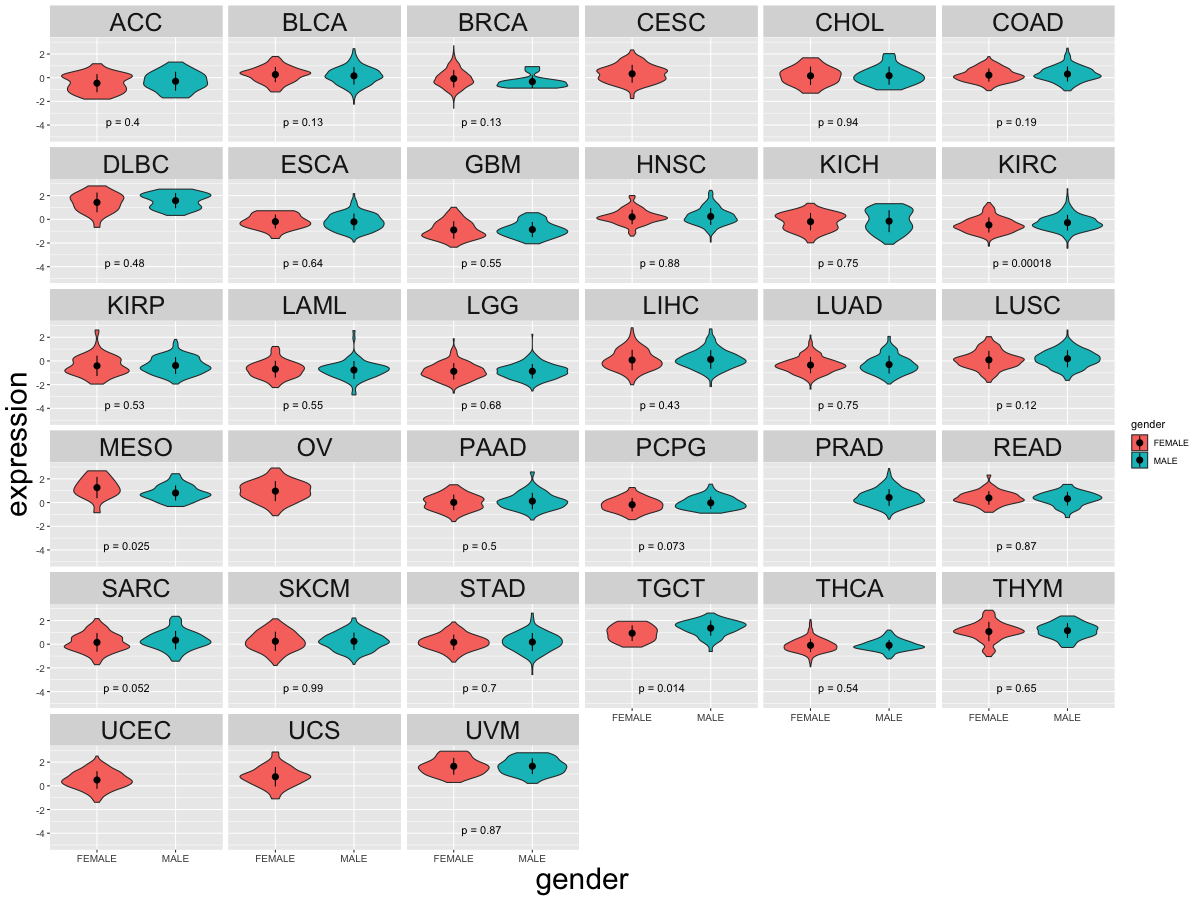 |
| Cancer type | Translation factor | pval | adj.p |
| KIRC | RPS17 | 0.000154580856503454 | 0.0043 |
| TGCT | RPS17 | 0.0125340540793406 | 0.34 |
| MESO | RPS17 | 0.0250556421457006 | 0.65 |
Top |
|
| Differential gene expression between young and old age groups (Wilcoxon test, pval<0.05) |
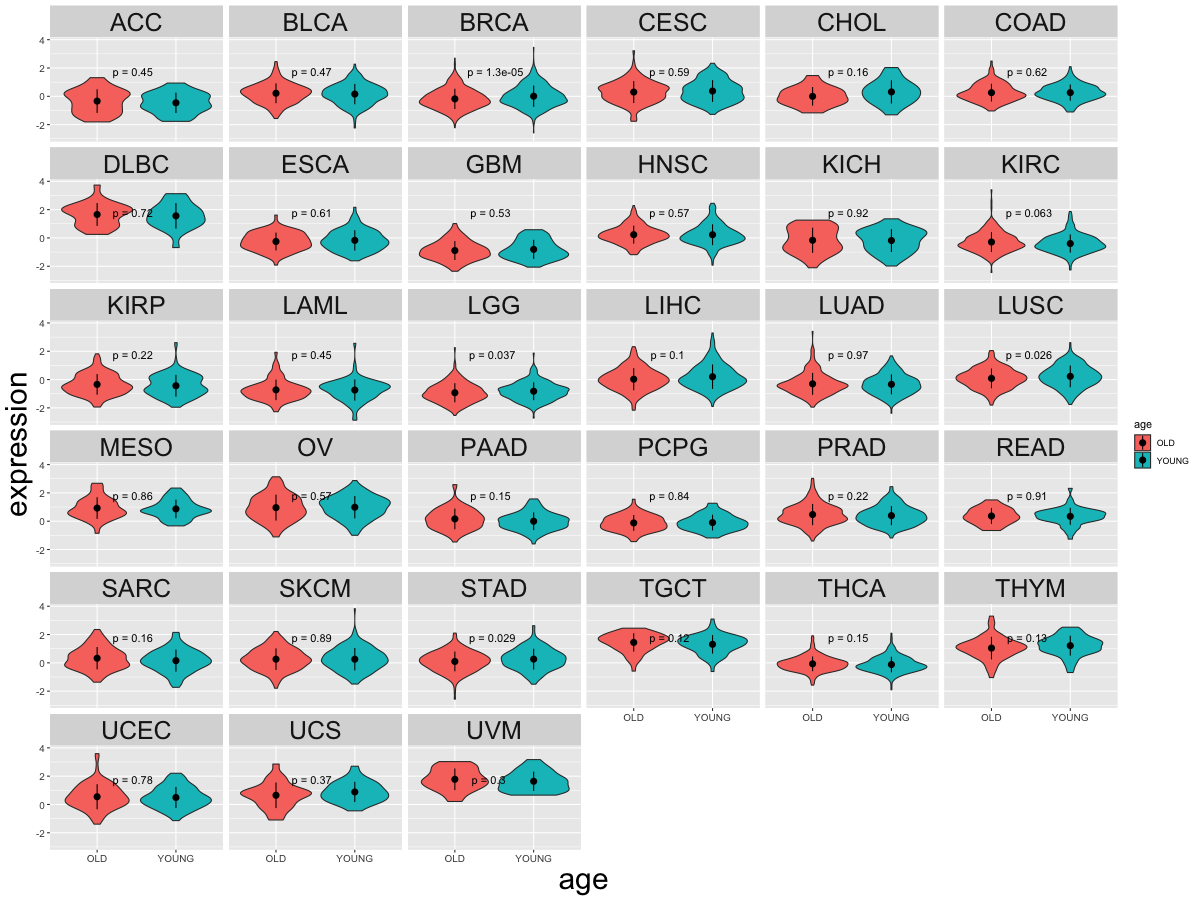 |
| Cancer type | Translation factor | pval | adj.p |
| STAD | RPS17 | 0.0294886435285043 | 0.91 |
| LUSC | RPS17 | 0.0263148221516904 | 0.84 |
| LGG | RPS17 | 0.037144187923708 | 1 |
| BRCA | RPS17 | 1.26025794953158e-05 | 0.00042 |
Top |
|
| Drugs targeting genes involved in this translation factor. (DrugBank Version 5.1.8 2021-05-08) |
| UniProtAcc | DrugBank ID | Drug name | Drug activity | Drug type | Drug status |
Top |
|
| Diseases associated with this translation factor. (DisGeNet 4.0) |
| Disease ID | Disease Name | # PubMeds | Disease source |
| C2675860 | Diamond-Blackfan Anemia 4 | 3 | CTD_human;GENOMICS_ENGLAND |
| C1260899 | Anemia, Diamond-Blackfan | 2 | CTD_human;GENOMICS_ENGLAND |
(UTHealth)
Web File Viewing | Emergency Information |Campus Carry|Site Policies