
|
||||||
|

Translation Factor: RPS23 (NCBI Gene ID:6228) |
|
 Gene Summary Gene Summary |
| Gene Information | Gene Name: RPS23 | Gene ID: 6228 | Gene Symbol | RPS23 | Gene ID | 6228 |
| Gene Name | ribosomal protein S23 | |
| Synonyms | BTDD|MABAS|MCINS|PAMAS|S23|uS12 | |
| Cytomap | 5q14.2 | |
| Type of Gene | protein-coding | |
| Description | 40S ribosomal protein S23homolog of yeast ribosomal protein S28small ribosomal subunit protein uS12 | |
| Modification date | 20200313 | |
| UniProtAcc | P62266 | |
| Child GO biological process term(s) under GO:0006412 |
| GO ID | GO term |
| GO:1990145 | Maintenance of translational fidelity |
| GO:0005840 | Ribosome |
| GO:0002181 | Cytoplasmic translation |
| GO:0006412 | Translation |
| Gene ontology of translaction factor with evidence of Inferred from Direct Assay (IDA) from Entrez |
| Partner | Gene | GO ID | GO term | PubMed ID |
| Hgene | RPS23 | GO:0002181 | cytoplasmic translation | 25957688 |
| Inferred gene age of translation factor. |
| Gene | Inferred gene age group among (0 - 67.6], (67.6 - 355.7], (355.7 - 733], (733 - 1119.25], >1119.25 |
| RPS23 | >1119.25 |
Top |
|
| We searched PubMed using 'RPS23[title] AND translation [title] AND human.' |
| Gene | Title | PMID |
| RPS23 | OGFOD1 catalyzes prolyl hydroxylation of RPS23 and is involved in translation control and stress granule formation | 24550447 |
Top |
|
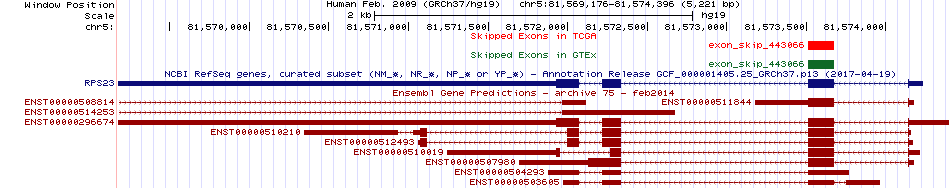
| Skipped exons in TCGA and GTEx based on Ensembl gene isoform structure. * Click on the image to open the UCSC genome browser with custom track showing this image in a new window. For more annotations, please visit our ExonSkipDB. |
 |
| Open reading frame (ORF) analsis of exon skipping events based on Ensembl gene isoform structure. * Click on the break point to see the gene structure around the break point region using the UCSC Genome Browser. |
| ENST | Exon skip start (DNA) | Exon Skip end (DNA) | ORF |
| Exon skipping position in the amino acid sequence. |
| ENST | Exon skip start (DNA) | Exon Skip end (DNA) | Len(transcript seq) | Exon skip start (mRNA) | Exon Skip end (mRNA) | Len(amino acid seq) | Exon skip start (AA) | Exon Skip end (AA) |
| Potentially (partially) lost protein functional features of UniProt. |
| UniProtAcc | Exon skip start (AA) | Exon Skip end (AA) | Function feature start (AA) | Function feature end (AA) | Functional feature type | Functional feature desc. |
Top |
|
| Gene expression level across TCGA pancancer |
 |
| Gene expression level across GTEx pantissue |
 |
| Expression level of gene isoforms across TCGA pancancer |
 |
| Expression level of gene isoforms across GTEx pantissue |
 |
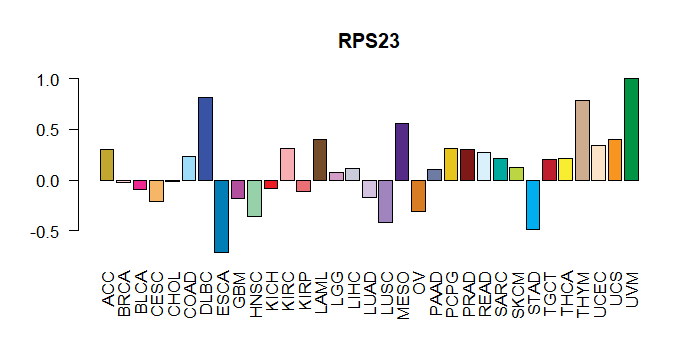
| Cancer(tissue) type-specific expression level of Translation factor using z-score distriution |
 |
| Differential expression between tumor and matched normal (in the cancer types with more than 10 matched samples) |
 |
| Cancer type | Translation factor | FC | adj.pval |
| STAD | RPS23 | 1.85076760664576 | 0.000364991836249828 |
| LUSC | RPS23 | 1.46751169891047 | 0.0174932185880974 |
| UCEC | RPS23 | -2.03658159814007 | 0.046875 |
Top |
|
| Translation factor expression regulation through miRNA binding |
| Cancer type | Gene | miRNA | TargetScan binding score (Context++ score percentile) | Coefficient | Pvalue |
| DLBC | RPS23 | hsa-miR-139-5p | 98 | 0.310938945420907 | 0.0338359687702221 |
| UCEC | RPS23 | hsa-miR-139-5p | 98 | -0.406875477463713 | 0.0176126407203776 |
| Translation factor expression regulation through methylation in the promoter of Translation factor |
 |
| Cancer type | Gene | methyl group b | methyl group a | DEG pval | avg methyl in b | avg methyl in a | avg exp in b | avg exp in a |
| Translation factor expression regulation through methylation in the gene body of Translation factor (positive regulation) |
 |
| Cancer type | Gene | methyl group b | methyl group a | DEG pval | avg methyl in b | avg methyl in a | avg exp in b | avg exp in a |
| Translation factor expression regulation through copy number variation of Translation factor |
 |
| Cancer type | Gene | Coefficient | Pvalue |
| ESCA | RPS23 | -0.059364699 | 0.00463242 |
Top |
|
| Strongly correlated genes belong to cellular important gene groups with RPS23 (coefficient>0.8, pval<0.05, node color based on FC between tumor and matched normal). Significantly associated important genes in the individual cancer types. * Cell metabolism gene: cell metabolism genes from REACTOME (black edge), IUPHAR: drug target genes from IUPHAR (blue edge), Kinase: human kinase genes (brown edge), CGC: cancer gene census genes (orange edge), TSG: tumor suppresor genes (purple edge), Epifactor: epigenetic factors (light blue edge), TF: transcription factors (green) |
 |
| Cancer type | Gene group | Translation factor | Correlated gene | Coefficient | Pvalue |
| BLCA | TSG | RPS23 | GNB2L1 | 0.820661564 | 4.18E-105 |
| CESC | TSG | RPS23 | GNB2L1 | 0.867791745 | 6.10E-95 |
| CHOL | CGC | RPS23 | NACA | 0.835047277 | 9.97E-13 |
| CHOL | TSG | RPS23 | GNB2L1 | 0.813343272 | 1.13E-11 |
| COAD | TSG | RPS23 | GNB2L1 | 0.839880497 | 8.70E-89 |
| DLBC | CGC | RPS23 | NACA | 0.857187627 | 7.50E-15 |
| DLBC | TSG | RPS23 | GNB2L1 | 0.909147117 | 4.06E-19 |
| GBM | Cell metabolism gene | RPS23 | FAU | 0.815083156 | 3.74E-42 |
| GBM | Cell metabolism gene | RPS23 | PFDN5 | 0.822421919 | 1.67E-43 |
| HNSC | TSG | RPS23 | GNB2L1 | 0.813266542 | 9.69E-135 |
| KIRP | TSG | RPS23 | GNB2L1 | 0.802814904 | 4.47E-74 |
| LGG | Cell metabolism gene | RPS23 | FAU | 0.809561886 | 3.06E-124 |
| LGG | CGC | RPS23 | NACA | 0.863932004 | 2.04E-159 |
| LGG | TSG | RPS23 | GNB2L1 | 0.811881382 | 1.69E-125 |
| LGG | TSG | RPS23 | GAS5 | 0.822718777 | 1.26E-131 |
| LIHC | TSG | RPS23 | GNB2L1 | 0.864290128 | 1.02E-127 |
| MESO | TSG | RPS23 | GNB2L1 | 0.848145978 | 3.57E-25 |
| PRAD | CGC | RPS23 | NACA | 0.825924759 | 1.67E-138 |
| PRAD | TSG | RPS23 | GAS5 | 0.804819857 | 2.94E-126 |
| PRAD | TSG | RPS23 | GNB2L1 | 0.844784451 | 6.18E-151 |
| TGCT | TSG | RPS23 | GNB2L1 | 0.803545585 | 1.60E-36 |
| THYM | Cell metabolism gene | RPS23 | TXN | 0.800085663 | 2.11E-28 |
| THYM | Cell metabolism gene | RPS23 | SNRPE | 0.802911799 | 9.84E-29 |
| THYM | Cell metabolism gene | RPS23 | LSM3 | 0.802913639 | 9.83E-29 |
| THYM | Cell metabolism gene | RPS23 | SEC61G | 0.805146761 | 5.33E-29 |
| THYM | Cell metabolism gene | RPS23 | TIMM8B | 0.80553819 | 4.79E-29 |
| THYM | Cell metabolism gene | RPS23 | APOA1 | 0.806302836 | 3.87E-29 |
| THYM | Cell metabolism gene | RPS23 | SNRPG | 0.808424248 | 2.14E-29 |
| THYM | Cell metabolism gene | RPS23 | PSMB7 | 0.809846185 | 1.43E-29 |
| THYM | Cell metabolism gene | RPS23 | SSR2 | 0.809896842 | 1.41E-29 |
| THYM | Cell metabolism gene | RPS23 | PSMA5 | 0.810569786 | 1.17E-29 |
| THYM | Cell metabolism gene | RPS23 | SNRPB | 0.813298901 | 5.33E-30 |
| THYM | Cell metabolism gene | RPS23 | TOMM22 | 0.813620155 | 4.85E-30 |
| THYM | Cell metabolism gene | RPS23 | PSMC3 | 0.81448072 | 3.78E-30 |
| THYM | Cell metabolism gene | RPS23 | SNRPF | 0.819741979 | 7.95E-31 |
| THYM | Cell metabolism gene | RPS23 | SNRPD1 | 0.824132554 | 2.08E-31 |
| THYM | Cell metabolism gene | RPS23 | PSMD13 | 0.82981955 | 3.47E-32 |
| THYM | Cell metabolism gene | RPS23 | SEC61B | 0.83008556 | 3.18E-32 |
| THYM | Cell metabolism gene | RPS23 | ZNRD1 | 0.841145408 | 7.95E-34 |
| THYM | Cell metabolism gene | RPS23 | SNRPD2 | 0.842522392 | 4.92E-34 |
| THYM | Cell metabolism gene | RPS23 | LSM2 | 0.865607994 | 7.49E-38 |
| THYM | Cell metabolism gene | RPS23 | LSM5 | 0.873983781 | 2.04E-39 |
| THYM | CGC | RPS23 | NACA | 0.807676245 | 2.64E-29 |
| THYM | Epifactor | RPS23 | FBL | 0.801398983 | 1.48E-28 |
| THYM | Epifactor | RPS23 | PPM1G | 0.80481244 | 5.85E-29 |
| THYM | Epifactor | RPS23 | RUVBL2 | 0.813700521 | 4.74E-30 |
| THYM | Epifactor | RPS23 | ANP32B | 0.827446782 | 7.38E-32 |
| THYM | Epifactor | RPS23 | SS18L2 | 0.836286379 | 4.16E-33 |
| THYM | Epifactor | RPS23 | RBX1 | 0.842557929 | 4.86E-34 |
| THYM | IUPHAR | RPS23 | PPIA | 0.822619737 | 3.32E-31 |
| THYM | IUPHAR | RPS23 | CSNK2B | 0.823585564 | 2.46E-31 |
| THYM | TF | RPS23 | GTF3A | 0.815271063 | 3.00E-30 |
| THYM | TF | RPS23 | ZNF444 | 0.819864262 | 7.66E-31 |
| THYM | TF | RPS23 | THYN1 | 0.85231171 | 1.42E-35 |
| THYM | TSG | RPS23 | PARK7 | 0.80078043 | 1.75E-28 |
| THYM | TSG | RPS23 | PFN1 | 0.802650614 | 1.06E-28 |
| THYM | TSG | RPS23 | AIP | 0.836922767 | 3.36E-33 |
| THYM | TSG | RPS23 | GLTSCR2 | 0.849197512 | 4.51E-35 |
| THYM | TSG | RPS23 | GNB2L1 | 0.866347832 | 5.50E-38 |
| UCS | Cell metabolism gene | RPS23 | TXN | 0.800085663 | 2.11E-28 |
| UCS | Cell metabolism gene | RPS23 | SNRPE | 0.802911799 | 9.84E-29 |
| UCS | Cell metabolism gene | RPS23 | LSM3 | 0.802913639 | 9.83E-29 |
| UCS | Cell metabolism gene | RPS23 | SEC61G | 0.805146761 | 5.33E-29 |
| UCS | Cell metabolism gene | RPS23 | TIMM8B | 0.80553819 | 4.79E-29 |
| UCS | Cell metabolism gene | RPS23 | APOA1 | 0.806302836 | 3.87E-29 |
| UCS | Cell metabolism gene | RPS23 | SNRPG | 0.808424248 | 2.14E-29 |
| UCS | Cell metabolism gene | RPS23 | PSMB7 | 0.809846185 | 1.43E-29 |
| UCS | Cell metabolism gene | RPS23 | SSR2 | 0.809896842 | 1.41E-29 |
| UCS | Cell metabolism gene | RPS23 | PSMA5 | 0.810569786 | 1.17E-29 |
| UCS | Cell metabolism gene | RPS23 | SNRPB | 0.813298901 | 5.33E-30 |
| UCS | Cell metabolism gene | RPS23 | TOMM22 | 0.813620155 | 4.85E-30 |
| UCS | Cell metabolism gene | RPS23 | PSMC3 | 0.81448072 | 3.78E-30 |
| UCS | Cell metabolism gene | RPS23 | SNRPF | 0.819741979 | 7.95E-31 |
| UCS | Cell metabolism gene | RPS23 | SNRPD1 | 0.824132554 | 2.08E-31 |
| UCS | Cell metabolism gene | RPS23 | PSMD13 | 0.82981955 | 3.47E-32 |
| UCS | Cell metabolism gene | RPS23 | SEC61B | 0.83008556 | 3.18E-32 |
| UCS | Cell metabolism gene | RPS23 | ZNRD1 | 0.841145408 | 7.95E-34 |
| UCS | Cell metabolism gene | RPS23 | SNRPD2 | 0.842522392 | 4.92E-34 |
| UCS | Cell metabolism gene | RPS23 | LSM2 | 0.865607994 | 7.49E-38 |
| UCS | Cell metabolism gene | RPS23 | LSM5 | 0.873983781 | 2.04E-39 |
| UCS | CGC | RPS23 | NACA | 0.807676245 | 2.64E-29 |
| UCS | Epifactor | RPS23 | FBL | 0.801398983 | 1.48E-28 |
| UCS | Epifactor | RPS23 | PPM1G | 0.80481244 | 5.85E-29 |
| UCS | Epifactor | RPS23 | RUVBL2 | 0.813700521 | 4.74E-30 |
| UCS | Epifactor | RPS23 | ANP32B | 0.827446782 | 7.38E-32 |
| UCS | Epifactor | RPS23 | SS18L2 | 0.836286379 | 4.16E-33 |
| UCS | Epifactor | RPS23 | RBX1 | 0.842557929 | 4.86E-34 |
| UCS | IUPHAR | RPS23 | PPIA | 0.822619737 | 3.32E-31 |
| UCS | IUPHAR | RPS23 | CSNK2B | 0.823585564 | 2.46E-31 |
| UCS | TF | RPS23 | GTF3A | 0.815271063 | 3.00E-30 |
| UCS | TF | RPS23 | ZNF444 | 0.819864262 | 7.66E-31 |
| UCS | TF | RPS23 | THYN1 | 0.85231171 | 1.42E-35 |
| UCS | TSG | RPS23 | PARK7 | 0.80078043 | 1.75E-28 |
| UCS | TSG | RPS23 | PFN1 | 0.802650614 | 1.06E-28 |
| UCS | TSG | RPS23 | AIP | 0.836922767 | 3.36E-33 |
| UCS | TSG | RPS23 | GLTSCR2 | 0.849197512 | 4.51E-35 |
| UCS | TSG | RPS23 | GNB2L1 | 0.866347832 | 5.50E-38 |
| UVM | CGC | RPS23 | NACA | 0.888173146 | 4.61E-28 |
| UVM | TSG | RPS23 | GNB2L1 | 0.815677599 | 3.16E-20 |
| UVM | TSG | RPS23 | GAS5 | 0.8560664 | 4.61E-24 |
Top |
|
| Protein 3D structure Visit iCn3D. |
Top |
|
| Protein-protein interaction networks * Overlap between up-regulated DEGs (log2FC<-1 and adj.P<0.05) and STRING PPI network (center: Translation factor, node: DEGs, edges: weighted by -log2(adj.P)) |
 |
| Overlap between down-regulated DEGs (log2FC>1 and adj.P<0.05) and STRING PPI network (center: Translation factor, node: DEGs, edges: weighted by -log2(adj.P)) |
 |
 * Edge colors based on TCGA cancer types. |
| * Overlap between DEGs (log2FC>1 and adj.P<0.05) and STRING PPI network per cancer (center: Translation factor, node: DEGs, node color: log2FC, edges: weighted by -log2(adj.P)) |
 |
| Cancer type | Translation factor | Interacting protein coding gene | FC | adj.pval |
| KIRP | RPS23 | RPL18A | -1.51651392808885 | 0.00016188295558095 |
| KICH | RPS23 | RPS27A | 1.75396693785956 | 0.000187873840332031 |
| KIRP | RPS23 | RPS16 | -1.35957043617517 | 0.00019507110118866 |
| COAD | RPS23 | RPS3 | 1.48730375143014 | 0.000411599874496461 |
| KIRP | RPS23 | RPS11 | -1.01861570565103 | 0.00105937570333481 |
| LIHC | RPS23 | RPL8 | -4.84588284974558 | 0.00110314154326131 |
| PRAD | RPS23 | RPL18A | 1.40600175748499 | 0.00205137828390396 |
| KICH | RPS23 | RPL19 | 1.36901182894089 | 0.00250792503356934 |
| KICH | RPS23 | RPS12 | 1.26997381758431 | 0.00308787822723389 |
| LUAD | RPS23 | RPL19 | -1.31398026615725 | 0.00993159558412698 |
| THCA | RPS23 | RPS16 | -6.16322798156577 | 0.0115764821363307 |
| BLCA | RPS23 | RPS12 | -1.47804673440421 | 0.0204124450683594 |
| BLCA | RPS23 | RPS27A | -1.04747470069188 | 0.0258216857910156 |
| HNSC | RPS23 | RPS3 | -4.73505819095135 | 0.0273726439852453 |
| COAD | RPS23 | RPS11 | 1.35307548998204 | 0.0312207043170929 |
| LUSC | RPS23 | RPL19 | -2.14669889516666 | 0.044366810398747 |
| KIRC | RPS23 | RPL19 | -2.73485271276676 | 1.33980982873695e-10 |
| BRCA | RPS23 | RPS12 | -4.91239327478244 | 1.85340619742495e-09 |
| KIRP | RPS23 | RPL37 | -1.17421621947139 | 2.26888805627823e-05 |
| KIRC | RPS23 | RPL35 | -1.06475238059392 | 2.72286325678163e-08 |
| KIRC | RPS23 | RPL8 | -1.18252459971773 | 5.64962994208288e-07 |
| KIRP | RPS23 | RPL8 | -1.53003692350119 | 6.0301274061203e-05 |
| KIRC | RPS23 | RPS16 | -1.66149869889384 | 7.8509870430991e-09 |
| BRCA | RPS23 | RPS27A | -4.28512148200424 | 7.8788217967112e-14 |
| KIRC | RPS23 | RPL37 | -2.87198822058464 | 8.03913394748564e-12 |
| KIRP | RPS23 | RPL35 | -1.52981101975496 | 9.0546440333128e-05 |
| KIRC | RPS23 | RPS3 | -1.29560847926387 | 9.05905681935088e-10 |
| KIRC | RPS23 | RPL18A | -4.43079304960843 | 9.2516163152192e-11 |
| Protein-protein interactors with this translation factor (BIOGRID-3.4.160) |
| PPI interactors with RPS23 |
| POU5F1, MME, EBNA-LP, HDGF, SIRT7, CUL2, CDK2, CUL1, COPS5, CAND1, NEDD8, RPL5, RPL10A, RPL10, RPL11, RPL12, RPL13, RPL14, RPL15, RPL18A, RPL18, RPL19, RPL21, RPL23A, RPL23, RPL24, RPL27, RPL31, RPL37A, RPL3, RPL6, RPL7A, RPL7, RPL8, RPL9, RPS11, RPS12, RPS13, RPS14, RPS16, RPS19, RPS20, RPS25, RPS28, RPS3A, RPS3, RPS4X, RPS5, RPS6, RPS7, RPS8, RPSA, RPS17, RPS2, RPS15A, RPL4, RPS24, RPL22, RPLP2, RPS26, RPL30, RPLP0, RPLP1, RPS9, RPS15, RPL17, RPL29, RPL32, RPS21, RPS27A, FAU, EEF2, EEF1A1, RPS29, HNRNPU, SLC25A5, ILF2, TUFM, HNRNPM, ILF3, MYBBP1A, ACTA2, DDX21, NHP2L1, NCL, NOLC1, HSP90AB1, RPL10L, RPS10P5, RPLP0P6, RPS27L, HNRNPR, VASN, SAMM50, HIST1H2AD, MRPL55, MRPS11, PSMB1, ESR1, FN1, PAN2, CD81, IGSF8, ICAM1, TARDBP, EIF3A, EIF3CL, EIF3E, PNO1, RPS18, DDX3X, DYNC1LI2, KIAA0368, EIF2A, FLNA, RPL28, RPS10, RPS27, SERBP1, TSR1, WIBG, rev, ZBTB1, CEP250, CEP57, CEP76, TUBG1, HUWE1, EED, WDR76, RPL13A, RPL27A, MRPL17, RPL34, RPL35, RPL36, RPL38, RPL3L, LOC101929876, MDM2, XPO1, AHSA1, KIF11, NPM1, Pabpc1, Pard6b, Srp72, Rrbp1, MCM2, ZNF746, CYLD, TRIM25, UBE2A, BRCA1, G3BP1, TMPO, BMP4, MAP2K1, PCBP1, PRPF8, AAR2, PIH1D1, EFTUD2, RNF4, CHD3, RNF31, TNF, SPDL1, RIOK1, HEXIM1, MEPCE, LARP7, SNAI1, AGR2, RECQL4, REST, MYC, FBL, GRWD1, EIF4B, RC3H1, RC3H2, ESR2, PHB, RBX1, USP14, NR2C2, PPP1CC, CTCF, VRK1, HIST1H4A, SNRNP70, ITFG1, BIRC3, STAU1, NFX1, WWP2, TRIM28, OGFOD1, ARIH2, DARS-AS1, PLEKHA4, YAP1, TFCP2, FANCD2, PTEN, HCVgp1, ZC3H18, DDX54, M, nsp4, nsp6, ORF7b, NEK4, CIT, ANLN, AURKB, CHMP4B, CHMP4C, ECT2, KIF14, KIF20A, KIF23, PRC1, C1QBP, TBRG4, FASN, INS, NDN, BRD4, NINL, NUPR1, CIC, Apc2, RBM39, FBP1, LGALS9, DNAJA3, DNAJC8, DDX58, AR, PARK2, UFL1, DDRGK1, MARCKS, PARP1, ATG10, ATG3, FZR1, WDR5, PAGE4, NAA40, NOTCH2, CDH23, HIST1H1A, MAGEB2, PRKRA, SPRTN, BTF3, FBXW7, DPP4, RCHY1, MAP1LC3B, SIRT6, RB1CC1, |
Top |
|
| Clinically associated variants from ClinVar. |
| Gene | Chr | Position | RefSeq | VarSeq | RefSeeq | VarType | Pathogenic | Disease | VarInfo |
| RPS23 | chr5 | 81571931 | T | C | single_nucleotide_variant | Likely_benign | not_provided | SO:0001819|synonymous_variant | SO:0001819|synonymous_variant |
| RPS23 | chr5 | 81572002 | A | T | single_nucleotide_variant | Pathogenic | MacInnes_syndrome | SO:0001583|missense_variant | SO:0001583|missense_variant |
| RPS23 | chr5 | 81572184 | G | C | single_nucleotide_variant | Benign | MacInnes_syndrome | SO:0001627|intron_variant | SO:0001627|intron_variant |
| RPS23 | chr5 | 81572238 | G | A | single_nucleotide_variant | Likely_benign | not_provided | SO:0001819|synonymous_variant | SO:0001819|synonymous_variant |
| RPS23 | chr5 | 81572302 | C | T | single_nucleotide_variant | Pathogenic | MacInnes_syndrome|not_provided | SO:0001583|missense_variant | SO:0001583|missense_variant |
| RPS23 | chr5 | 81573537 | C | T | single_nucleotide_variant | Uncertain_significance | MacInnes_syndrome | SO:0001583|missense_variant | SO:0001583|missense_variant |
| nsSNVs with sample frequency (size of circle) from TCGA 33 cancers. |
 |
| SNVs and Indels |
| Gene | Cancer type | Chromosome | Start | End | RefSeeq | MutSeq | Mutation type | AAchange | # samples |
| RPS23 | LIHC | chr5 | 81573532 | 81573532 | T | - | Frame_Shift_Del | p.K48fs | 2 |
| RPS23 | LIHC | chr5 | 81573557 | 81573557 | G | - | Frame_Shift_Del | p.P40fs | 2 |
| RPS23 | CESC | chr5 | 81573526 | 81573526 | G | A | Silent | 2 | |
| RPS23 | SARC | chr5 | 81571946 | 81571946 | C | G | Missense_Mutation | p.K138N | 2 |
| RPS23 | CESC | chr5 | 81573540 | 81573540 | G | A | Missense_Mutation | 2 | |
| RPS23 | STAD | chr5 | 81573573 | 81573573 | C | T | Missense_Mutation | p.A35T | 2 |
| RPS23 | CESC | chr5 | 81573540 | 81573540 | G | A | Missense_Mutation | p.H46Y | 2 |
| RPS23 | STAD | chr5 | 81573622 | 81573622 | T | G | Silent | p.R18R | 2 |
| RPS23 | UCEC | chr5 | 81572316 | 81572316 | T | C | Silent | p.P62 | 2 |
| RPS23 | HNSC | chr5 | 81571952 | 81571952 | G | A | Silent | 1 | |
| RPS23 | HNSC | chr5 | 81571953 | 81571953 | C | T | Missense_Mutation | 1 | |
| RPS23 | LIHC | chr5 | 81573513 | 81573514 | - | T | Frame_Shift_Ins | p.NV54fs | 1 |
| RPS23 | HNSC | chr5 | 81572197 | 81572197 | G | A | Missense_Mutation | 1 | |
| RPS23 | OV | chr5 | 81609905 | 81609905 | G | A | Silent | p.A30 | 1 |
| RPS23 | CESC | chr5 | 81572184 | 81572184 | G | C | Missense_Mutation | 1 | |
| RPS23 | HNSC | chr5 | 81571973 | 81571973 | A | G | Silent | p.S129S | 1 |
| RPS23 | SARC | chr5 | 81571946 | 81571946 | C | G | Missense_Mutation | 1 | |
| RPS23 | HNSC | chr5 | 81571953 | 81571953 | C | T | Missense_Mutation | p.G136D | 1 |
| RPS23 | HNSC | chr5 | 81571952 | 81571952 | G | A | Splice_Site | p.G78_splice | 1 |
| RPS23 | SKCM | chr5 | 81573643 | 81573643 | C | T | Silent | p.R11R | 1 |
| RPS23 | CESC | chr5 | 81572280 | 81572280 | C | A | Silent | 1 | |
| RPS23 | HNSC | chr5 | 81571952 | 81571953 | GC | AT | Missense_Mutation | p.G136D | 1 |
| RPS23 | LIHC | chr5 | 81573513 | 81573514 | - | - | Frame_Shift_Ins | 1 | |
| RPS23 | CESC | chr5 | 81573526 | 81573526 | G | A | Silent | p.I50I | 1 |
| RPS23 | LIHC | chr5 | 81573513 | 81573514 | - | T | Frame_Shift_Ins | p.V55fs | 1 |
| RPS23 | THYM | chr5 | 81572043 | 81572043 | C | A | Missense_Mutation | p.G106V | 1 |
| RPS23 | CESC | chr5 | 81573526 | 81573526 | G | A | Silent | p.I50 | 1 |
| RPS23 | LIHC | chr5 | 81572069 | 81572070 | - | T | Frame_Shift_Ins | p.R97fs | 1 |
| RPS23 | COAD | chr5 | 81572042 | 81572042 | A | G | Silent | p.G106G | 1 |
| Copy number variation (CNV) of RPS23 * Click on the image to open the original image in a new window. |
 |
| Fusion gene breakpoints (product of the structural variants (SVs)) across RPS23 * Click on the image to open the UCSC genome browser with custom track showing this image in a new window. |
 |
| Fusion genes with this translation factor from FusionGDB2.0. |
| FusionGDB2 ID | Disease | Sample | Hgene | Hchr | Hbp | Hstrand | Tgene | Tchr | Tbp | Tstrand |
| 95311 | N/A | EC565927 | CDH23 | chr10 | 73431054 | + | RPS23 | chr5 | 81571888 | + |
| 95311 | N/A | H17554 | CUTA | chr6 | 33385911 | + | RPS23 | chr5 | 81570373 | - |
| 95311 | N/A | AI982804 | EFNA5 | chr5 | 106714041 | + | RPS23 | chr5 | 81571295 | + |
| 95311 | N/A | AI889745 | NLGN4X | chrX | 6143763 | + | RPS23 | chr5 | 81571879 | + |
| 95311 | Non-Cancer | ERR315465 | PABPC1 | chr8 | 101730411 | - | RPS23 | chr5 | 81573671 | - |
| 101684 | OV | TCGA-24-1464 | RPS23 | chr5 | 81572216 | - | ATP5B | chr12 | 57036615 | - |
| 99462 | OV | TCGA-61-2110 | RPS23 | chr5 | 81573511 | - | BEX1 | chrX | 102318207 | - |
| 97608 | COAD | TCGA-AZ-4308-01A | RPS23 | chr5 | 81573519 | - | GDI2 | chr10 | 5855222 | - |
| 101053 | N/A | GW493247 | RPS23 | chr5 | 81571879 | - | GPC5 | chr13 | 92763829 | + |
| 95311 | N/A | N22397 | RPS23 | chr5 | 81571945 | + | RPS23 | chr5 | 81571977 | - |
| 83858 | N/A | AI908980 | RPS23 | chr5 | 81573514 | - | RPS24 | chr10 | 79799960 | + |
| 102305 | N/A | BI859685 | RPS23 | chr5 | 81571879 | - | STX8 | chr17 | 9218457 | + |
| 95311 | N/A | BF154662 | SNX19 | chr11 | 130753340 | + | RPS23 | chr5 | 81573597 | - |
| 95311 | STAD | TCGA-BR-4187-01A | SSBP2 | chr5 | 81046800 | - | RPS23 | chr5 | 81573671 | - |
| 95321 | N/A | BM785206 | TUBA1C | chr12 | 49663672 | + | RPS23 | chr5 | 81571955 | - |
Top |
|
| Kaplan-Meier plots with logrank tests of overall survival (OS) |
| Cancer type | Translation factor | Coefficent | Hazard ratio | Wald test pval | Likelihool ratio pval | Logrank test pval | # samples |
Top |
|
| Differential gene expression between female and male. (Wilcoxon test, pval<0.05) |
 |
| Cancer type | Translation factor | pval | adj.p |
| KIRC | RPS23 | 0.000203847423254295 | 0.0057 |
| TGCT | RPS23 | 0.0108365200967807 | 0.29 |
Top |
|
| Differential gene expression between young and old age groups (Wilcoxon test, pval<0.05) |
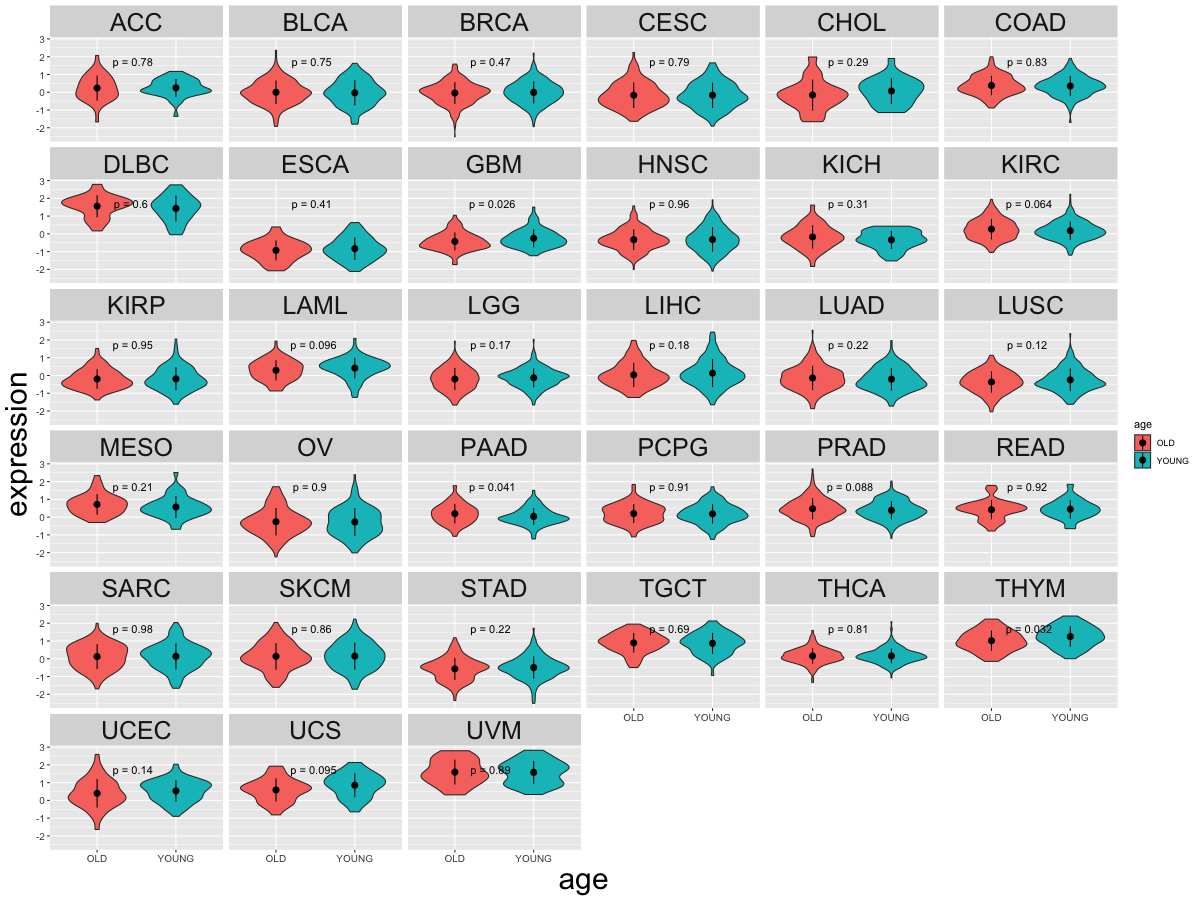 |
| Cancer type | Translation factor | pval | adj.p |
| GBM | RPS23 | 0.0255929444453529 | 0.84 |
| PAAD | RPS23 | 0.0413775848690731 | 1 |
| THYM | RPS23 | 0.0320638955290254 | 1 |
Top |
|
| Drugs targeting genes involved in this translation factor. (DrugBank Version 5.1.8 2021-05-08) |
| UniProtAcc | DrugBank ID | Drug name | Drug activity | Drug type | Drug status |
Top |
|
| Diseases associated with this translation factor. (DisGeNet 4.0) |
| Disease ID | Disease Name | # PubMeds | Disease source |
| C4479431 | BRACHYCEPHALY, TRICHOMEGALY, AND DEVELOPMENTAL DELAY | 1 | CTD_human;GENOMICS_ENGLAND;UNIPROT |
(UTHealth)
Web File Viewing | Emergency Information |Campus Carry|Site Policies