
|
||||||
|

Translation Factor: MRPS14 (NCBI Gene ID:63931) |
|
 Gene Summary Gene Summary |
| Gene Information | Gene Name: MRPS14 | Gene ID: 63931 | Gene Symbol | MRPS14 | Gene ID | 63931 |
| Gene Name | mitochondrial ribosomal protein S14 | |
| Synonyms | COXPD38|DJ262D12.2|HSMRPS14|MRP-S14|S14mt | |
| Cytomap | 1q25.1 | |
| Type of Gene | protein-coding | |
| Description | 28S ribosomal protein S14, mitochondrialmitochondrial 28S ribosomal protein S14mitochondrial small ribosomal subunit protein uS14m | |
| Modification date | 20200313 | |
| UniProtAcc | O60783 | |
| Child GO biological process term(s) under GO:0006412 |
| GO ID | GO term |
| GO:0032543 | Mitochondrial translation |
| GO:0005840 | Ribosome |
| GO:0006412 | Translation |
| Gene ontology of translaction factor with evidence of Inferred from Direct Assay (IDA) from Entrez |
| Partner | Gene | GO ID | GO term | PubMed ID |
| Inferred gene age of translation factor. |
| Gene | Inferred gene age group among (0 - 67.6], (67.6 - 355.7], (355.7 - 733], (733 - 1119.25], >1119.25 |
Top |
|
| We searched PubMed using 'MRPS14[title] AND translation [title] AND human.' |
| Gene | Title | PMID |
| MRPS14 | . | . |
Top |
|
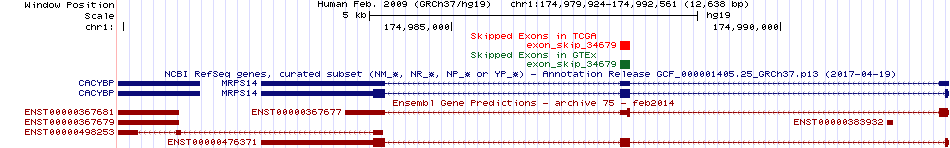
| Skipped exons in TCGA and GTEx based on Ensembl gene isoform structure. * Click on the image to open the UCSC genome browser with custom track showing this image in a new window. For more annotations, please visit our ExonSkipDB. |
 |
| Open reading frame (ORF) analsis of exon skipping events based on Ensembl gene isoform structure. * Click on the break point to see the gene structure around the break point region using the UCSC Genome Browser. |
| ENST | Exon skip start (DNA) | Exon Skip end (DNA) | ORF |
| ENST00000476371 | 174987553 | 174987712 | In-frame |
| Exon skipping position in the amino acid sequence. |
| ENST | Exon skip start (DNA) | Exon Skip end (DNA) | Len(transcript seq) | Exon skip start (mRNA) | Exon Skip end (mRNA) | Len(amino acid seq) | Exon skip start (AA) | Exon Skip end (AA) |
| ENST00000476371 | 174987553 | 174987712 | 2132 | 63 | 221 | 128 | 15 | 68 |
| Potentially (partially) lost protein functional features of UniProt. |
| UniProtAcc | Exon skip start (AA) | Exon Skip end (AA) | Function feature start (AA) | Function feature end (AA) | Functional feature type | Functional feature desc. |
| O60783 | 15 | 68 | 1 | 128 | Chain | ID=PRO_0000131013;Note=28S ribosomal protein S14%2C mitochondrial |
Top |
|
| Gene expression level across TCGA pancancer |
 |
| Gene expression level across GTEx pantissue |
 |
| Expression level of gene isoforms across TCGA pancancer |
 |
| Expression level of gene isoforms across GTEx pantissue |
 |
| Cancer(tissue) type-specific expression level of Translation factor using z-score distriution |
 |
| Differential expression between tumor and matched normal (in the cancer types with more than 10 matched samples) |
 |
| Cancer type | Translation factor | FC | adj.pval |
| LUAD | MRPS14 | -3.02634914022647 | 4.24616078981701e-06 |
| LUSC | MRPS14 | -3.86726163364221 | 6.1453992201761e-05 |
Top |
|
| Translation factor expression regulation through miRNA binding |
| Cancer type | Gene | miRNA | TargetScan binding score (Context++ score percentile) | Coefficient | Pvalue |
| ACC | MRPS14 | hsa-miR-27b-3p | 94 | -0.325925024342746 | 0.00352116691863917 |
| Translation factor expression regulation through methylation in the promoter of Translation factor |
 |
| Cancer type | Gene | methyl group b | methyl group a | DEG pval | avg methyl in b | avg methyl in a | avg exp in b | avg exp in a |
| Translation factor expression regulation through methylation in the gene body of Translation factor (positive regulation) |
 |
| Cancer type | Gene | methyl group b | methyl group a | DEG pval | avg methyl in b | avg methyl in a | avg exp in b | avg exp in a |
| Translation factor expression regulation through copy number variation of Translation factor |
 |
| Cancer type | Gene | Coefficient | Pvalue |
| UCEC | MRPS14 | 0.265335099 | 0.001743425 |
| MESO | MRPS14 | 0.135558887 | 0.008866463 |
| ESCA | MRPS14 | 0.081380171 | 0.027295092 |
Top |
|
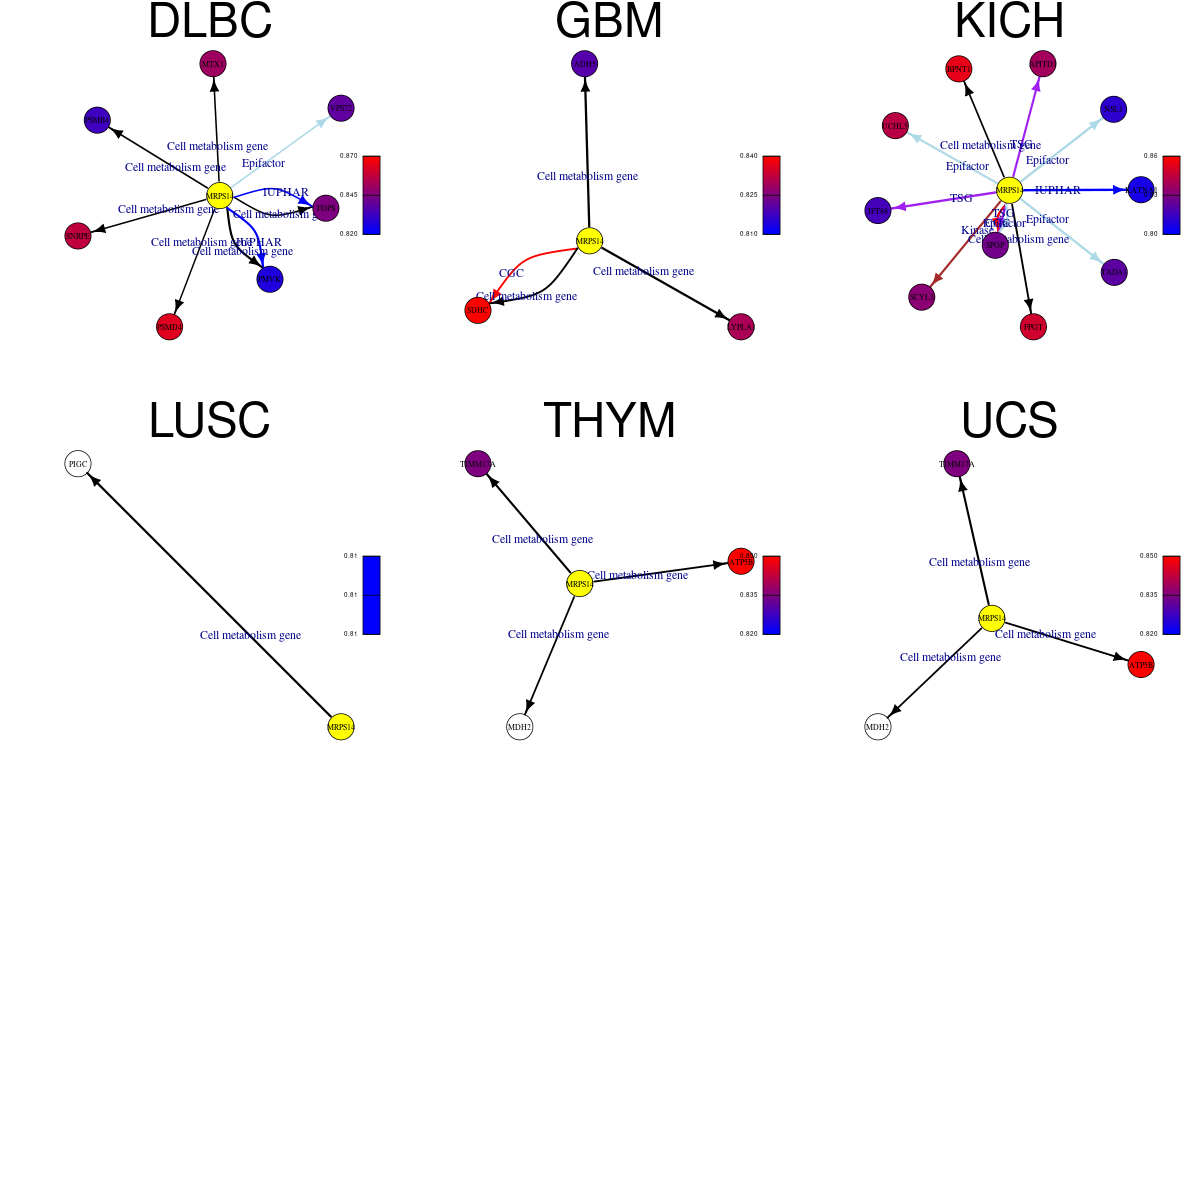
| Strongly correlated genes belong to cellular important gene groups with MRPS14 (coefficient>0.8, pval<0.05, node color based on FC between tumor and matched normal). Significantly associated important genes in the individual cancer types. * Cell metabolism gene: cell metabolism genes from REACTOME (black edge), IUPHAR: drug target genes from IUPHAR (blue edge), Kinase: human kinase genes (brown edge), CGC: cancer gene census genes (orange edge), TSG: tumor suppresor genes (purple edge), Epifactor: epigenetic factors (light blue edge), TF: transcription factors (green) |
 |
| Cancer type | Gene group | Translation factor | Correlated gene | Coefficient | Pvalue |
| DLBC | Cell metabolism gene | MRPS14 | PMVK | 0.820222156 | 9.81E-13 |
| DLBC | Cell metabolism gene | MRPS14 | PSMB4 | 0.857229308 | 7.46E-15 |
| DLBC | Cell metabolism gene | MRPS14 | FDPS | 0.866142876 | 1.87E-15 |
| DLBC | Cell metabolism gene | MRPS14 | MTX1 | 0.866912865 | 1.65E-15 |
| DLBC | Cell metabolism gene | MRPS14 | SNRPE | 0.868416476 | 1.29E-15 |
| DLBC | Cell metabolism gene | MRPS14 | PSMD4 | 0.873537439 | 5.50E-16 |
| DLBC | Epifactor | MRPS14 | VPS72 | 0.864274716 | 2.52E-15 |
| DLBC | IUPHAR | MRPS14 | PMVK | 0.820222156 | 9.81E-13 |
| DLBC | IUPHAR | MRPS14 | FDPS | 0.866142876 | 1.87E-15 |
| GBM | Cell metabolism gene | MRPS14 | ADH5 | 0.809271647 | 3.98E-41 |
| GBM | Cell metabolism gene | MRPS14 | LYPLA1 | 0.810677257 | 2.26E-41 |
| GBM | Cell metabolism gene | MRPS14 | SDHC | 0.838962418 | 8.69E-47 |
| GBM | CGC | MRPS14 | SDHC | 0.838962418 | 8.69E-47 |
| KICH | Cell metabolism gene | MRPS14 | FPGT | 0.839357188 | 2.75E-25 |
| KICH | Cell metabolism gene | MRPS14 | BPNT1 | 0.85559735 | 3.47E-27 |
| KICH | CGC | MRPS14 | SPOP | 0.811603709 | 1.73E-22 |
| KICH | Epifactor | MRPS14 | NSL1 | 0.803394977 | 9.54E-22 |
| KICH | Epifactor | MRPS14 | TADA1 | 0.807722087 | 3.92E-22 |
| KICH | Epifactor | MRPS14 | SPOP | 0.811603709 | 1.73E-22 |
| KICH | Epifactor | MRPS14 | UCHL5 | 0.821027218 | 2.20E-23 |
| KICH | IUPHAR | MRPS14 | KATNA1 | 0.80277401 | 1.08E-21 |
| KICH | Kinase | MRPS14 | SCYL3 | 0.817421799 | 4.91E-23 |
| KICH | TSG | MRPS14 | IFT88 | 0.804055515 | 8.34E-22 |
| KICH | TSG | MRPS14 | SPOP | 0.811603709 | 1.73E-22 |
| KICH | TSG | MRPS14 | APITD1 | 0.819023019 | 3.45E-23 |
| LUSC | Cell metabolism gene | MRPS14 | PIGC | 0.812534283 | 2.94E-131 |
| THYM | Cell metabolism gene | MRPS14 | TIMM17A | 0.822606206 | 3.33E-31 |
| THYM | Cell metabolism gene | MRPS14 | ATP5B | 0.841848345 | 6.23E-34 |
| THYM | Cell metabolism gene | MRPS14 | MDH2 | 0.848129495 | 6.67E-35 |
| UCS | Cell metabolism gene | MRPS14 | TIMM17A | 0.822606206 | 3.33E-31 |
| UCS | Cell metabolism gene | MRPS14 | ATP5B | 0.841848345 | 6.23E-34 |
| UCS | Cell metabolism gene | MRPS14 | MDH2 | 0.848129495 | 6.67E-35 |
Top |
|
| Protein 3D structure Visit iCn3D. |
Top |
|
| Protein-protein interaction networks * Overlap between up-regulated DEGs (log2FC<-1 and adj.P<0.05) and STRING PPI network (center: Translation factor, node: DEGs, edges: weighted by -log2(adj.P)) |
 |
| Overlap between down-regulated DEGs (log2FC>1 and adj.P<0.05) and STRING PPI network (center: Translation factor, node: DEGs, edges: weighted by -log2(adj.P)) |
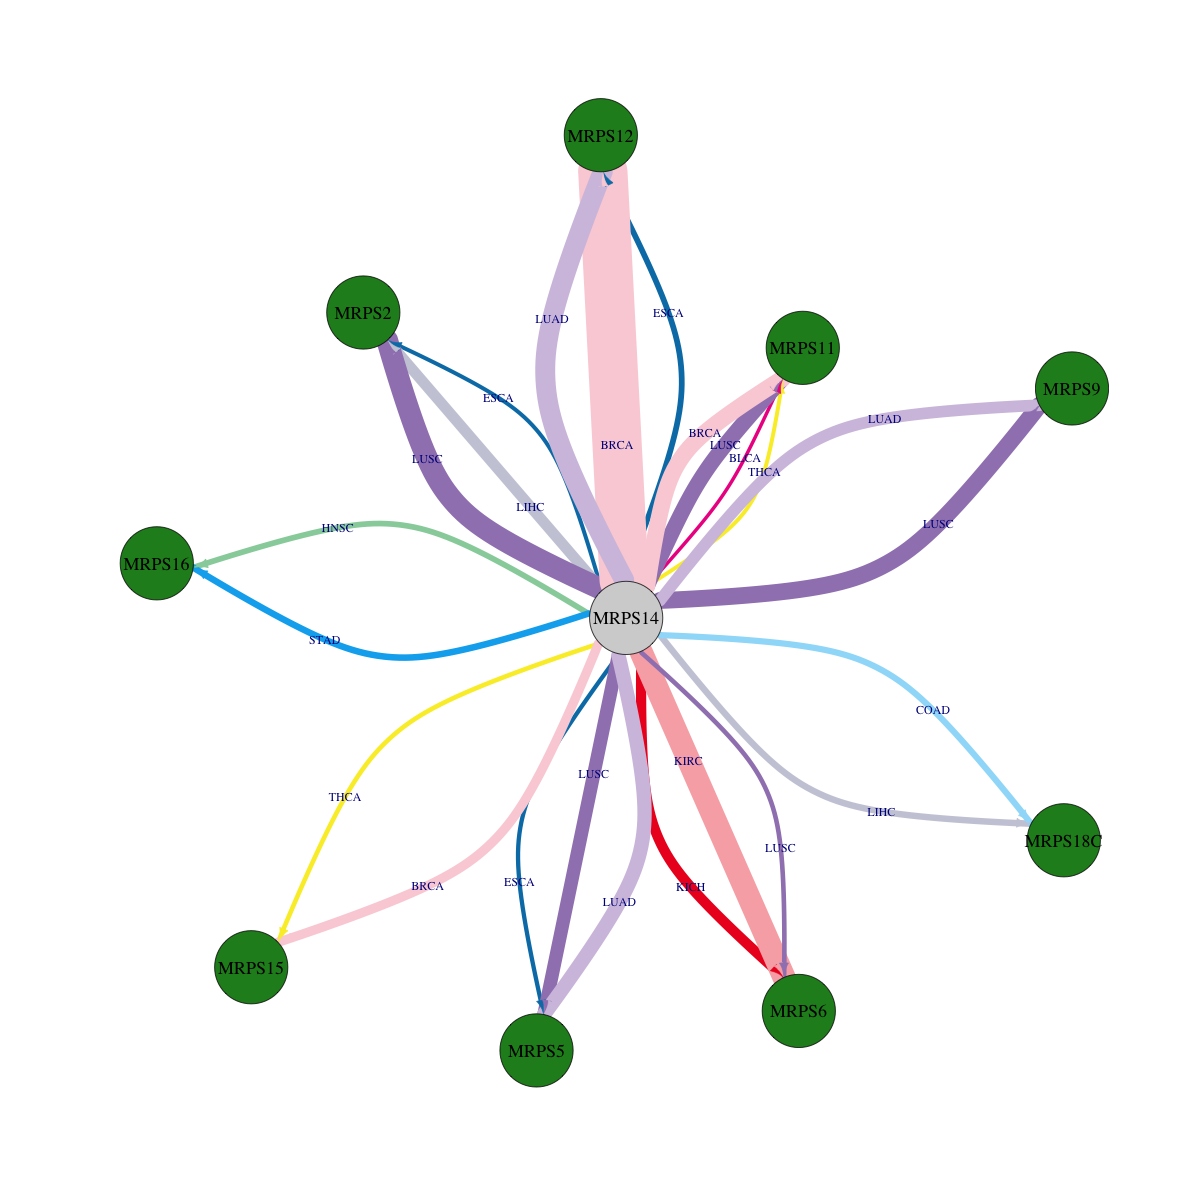 |
 * Edge colors based on TCGA cancer types. |
| * Overlap between DEGs (log2FC>1 and adj.P<0.05) and STRING PPI network per cancer (center: Translation factor, node: DEGs, node color: log2FC, edges: weighted by -log2(adj.P)) |
 |
| Cancer type | Translation factor | Interacting protein coding gene | FC | adj.pval |
| COAD | MRPS14 | MRPS12 | 2.11566333114824 | 0.000125885009765625 |
| BRCA | MRPS14 | MRPS15 | -2.19567551682318 | 0.000188684660674703 |
| KICH | MRPS14 | MRPS5 | 1.25108287838437 | 0.000249803066253662 |
| STAD | MRPS14 | MRPS16 | -1.64208084987431 | 0.00239070039242506 |
| LIHC | MRPS14 | MRPS18C | -1.25336042046698 | 0.00251545393492315 |
| COAD | MRPS14 | MRPS18C | -3.48505830240365 | 0.00322914123535157 |
| KIRC | MRPS14 | MRPS15 | 1.11572283836012 | 0.00361818577801855 |
| ESCA | MRPS14 | MRPS12 | -1.86248549814506 | 0.0048828125 |
| PRAD | MRPS14 | MRPS9 | 1.04379115553269 | 0.00496210155254694 |
| HNSC | MRPS14 | MRPS16 | -2.01564621821803 | 0.00518989327406416 |
| CHOL | MRPS14 | MRPS6 | 2.57097392409939 | 0.0078125 |
| KICH | MRPS14 | MRPS2 | 1.26543989555015 | 0.0114533305168152 |
| LUSC | MRPS14 | MRPS6 | -1.26158810839259 | 0.013873001943322 |
| THCA | MRPS14 | MRPS15 | -1.19960602422995 | 0.0140154883942907 |
| ESCA | MRPS14 | MRPS5 | -2.15440118747854 | 0.0185546875 |
| ESCA | MRPS14 | MRPS2 | -3.20556788084675 | 0.0244140625 |
| HNSC | MRPS14 | MRPS12 | 1.33677139927136 | 0.0248336488591576 |
| THCA | MRPS14 | MRPS11 | -3.10694728540962 | 0.0252226935182201 |
| BLCA | MRPS14 | MRPS11 | -2.30276998968219 | 0.040130615234375 |
| LUAD | MRPS14 | MRPS12 | -5.3399185683719 | 1.00823612619819e-08 |
| THCA | MRPS14 | MRPS10 | 1.33413691764991 | 1.55171507174296e-05 |
| BRCA | MRPS14 | MRPS12 | -1.59537235222597 | 1.66215672512325e-20 |
| LUAD | MRPS14 | MRPS5 | -2.20881945885927 | 1.77904381378076e-06 |
| LUSC | MRPS14 | MRPS9 | -3.60637641031661 | 1.82498668910368e-07 |
| LUSC | MRPS14 | MRPS2 | -2.70930846488508 | 1.92864354932136e-09 |
| LUAD | MRPS14 | MRPS9 | -1.32894454884901 | 1.98978698949574e-05 |
| BRCA | MRPS14 | MRPS11 | -1.24304977976804 | 2.31302509538916e-07 |
| LIHC | MRPS14 | MRPS12 | 2.67189430810317 | 2.56696988045444e-05 |
| KICH | MRPS14 | MRPS12 | 1.48941080926405 | 3.19480895996094e-05 |
| PRAD | MRPS14 | MRPS6 | 1.00673230965164 | 3.48152859299693e-07 |
| LIHC | MRPS14 | MRPS2 | -1.14771055358828 | 4.2584580238307e-05 |
| LUSC | MRPS14 | MRPS5 | -7.65956389962319 | 4.27210217182982e-06 |
| KIRC | MRPS14 | MRPS6 | -3.12621933743663 | 4.95376546353503e-10 |
| LUSC | MRPS14 | MRPS11 | -2.9004097541444 | 5.43966600483641e-07 |
| KICH | MRPS14 | MRPS6 | -1.34376231922276 | 7.49826431274414e-05 |
| Protein-protein interactors with this translation factor (BIOGRID-3.4.160) |
| PPI interactors with MRPS14 |
| DDX56, USP42, ICT1, MRPL14, MRPS11, MRPL23, MRPS10, ILF3, TUFM, FLOT2, RPS15A, COX15, RPL23, SLC25A10, MPV17, CEP250, TP53, TUBGCP3, TUBGCP4, NOL12, TRA2A, RPL6, MRPS2, ZC3H3, RPS8, TRMT10B, MRPS31, RPS2, HNRNPU, RAB5C, Gtf3c4, ERBB3, CDC14B, MRPS34, MRPS27, MRPS15, SNRNP70, RBM42, ZFC3H1, ZNF274, DLST, BRD1, ATP1A1, C6orf203, COX16, CTNNBL1, EMC7, LEO1, MINOS1-NBL1, MRPL10, MRPS28, MRPS5, MRPS9, NCAPD2, TAZ, FBXO7, EFTUD2, BPLF1, MEPCE, LARP7, RECQL4, CDK9, MRM1, SCO1, HSPD1, PDK1, TRMT61B, AURKAIP1, RC3H2, FBXW8, OBSL1, CUL9, PLEKHA4, AXL, FGFR1, GRB7, MTA2, PTPRR, SRC, ESR1, GRSF1, ZC3HAV1, ELAVL1, IGF2BP2, MEX3B, XRN2, MCF2L2, DOCK6, OCRL, ACAD9, AUH, C12orf65, C17orf80, C1QBP, C21orf33, C8orf82, MCUR1, CCDC90B, CHCHD1, CRYZ, CS, DDX28, DHX30, FASTKD2, FASTKD3, FASTKD5, GFM1, GFM2, HINT2, LONP1, LRPPRC, MCU, CCDC109B, MDH2, METTL15, METTL17, MRPL11, MRPS12, MRPS26, MRRF, MTERF3, MTFMT, MTG2, MTIF2, MTIF3, MTRF1, MTRF1L, NGRN, OTC, PMPCA, PMPCB, RMND1, RPUSD3, RPUSD4, SLC25A12, SLIRP, SSBP1, SURF1, TACO1, TBRG4, TEFM, TFAM, TMEM70, TRUB2, TSFM, VWA8, EXD2, MKI67, RBM39, NR3C1, DNAJA3, DNAJC15, DNAJC19, HSCB, MRPS23, AMOTL1, REPIN1, MRPS7, REXO4, MRPS35, MRPS24, MRPS16, MRPS17, DAP3, AARS2, COX8A, PDHA1, MAP4K3, TATDN3, UBAC1, MRPS18C, RNF123, MRPS25, MRPS18B, MRPL18, HIST1H4I, MRPS6, RBMS2, RPL35, RPL3, SRSF1, LIN28A, PRR3, APOBEC3D, CBX6, RPL10, SRP14, H1FNT, FGF17, RPL13, RPL13A, ABT1, RPL23A, SRSF7, RPL19, RPL31, RPL17, FBXW7, KLF12, KLF15, KLF4, TLX1, |
Top |
|
| Clinically associated variants from ClinVar. |
| Gene | Chr | Position | RefSeq | VarSeq | RefSeeq | VarType | Pathogenic | Disease | VarInfo |
| MRPS14 | chr1 | 174983841 | A | G | single_nucleotide_variant | Likely_benign | not_provided | SO:0001619|non-coding_transcript_variant,SO:0001819|synonymous_variant | SO:0001619|non-coding_transcript_variant,SO:0001819|synonymous_variant |
| MRPS14 | chr1 | 174983870 | G | A | single_nucleotide_variant | Pathogenic | Combined_oxidative_phosphorylation_deficiency_38 | SO:0001583|missense_variant,SO:0001619|non-coding_transcript_variant | SO:0001583|missense_variant,SO:0001619|non-coding_transcript_variant |
| nsSNVs with sample frequency (size of circle) from TCGA 33 cancers. |
 |
| SNVs and Indels |
| Gene | Cancer type | Chromosome | Start | End | RefSeeq | MutSeq | Mutation type | AAchange | # samples |
| MRPS14 | BRCA | chr1 | 174983888 | 174983888 | G | A | Missense_Mutation | p.R102W | 3 |
| MRPS14 | ESCA | chr1 | 174983880 | 174983880 | C | A | Missense_Mutation | p.W104C | 3 |
| MRPS14 | UCEC | chr1 | 174983923 | 174983923 | C | T | Missense_Mutation | p.R90Q | 2 |
| MRPS14 | CESC | chr1 | 174987559 | 174987559 | G | A | Missense_Mutation | 2 | |
| MRPS14 | UCEC | chr1 | 174987681 | 174987681 | C | T | Missense_Mutation | p.R26Q | 2 |
| MRPS14 | STAD | chr1 | 174987569 | 174987569 | C | A | Missense_Mutation | 2 | |
| MRPS14 | STAD | chr1 | 174987569 | 174987569 | C | A | Missense_Mutation | p.L63F | 2 |
| MRPS14 | LUAD | chr1 | 174983875 | 174983875 | A | G | Missense_Mutation | p.L106P | 2 |
| MRPS14 | STAD | chr1 | 174987651 | 174987651 | C | T | Missense_Mutation | p.R36H | 2 |
| MRPS14 | ESCA | chr1 | 174983880 | 174983880 | C | A | Missense_Mutation | 2 | |
| MRPS14 | UCEC | chr1 | 174983858 | 174983858 | G | A | Missense_Mutation | p.R112C | 2 |
| MRPS14 | KIRP | chr1 | 174987712 | 174987712 | T | C | Missense_Mutation | p.M16V | 2 |
| MRPS14 | UCEC | chr1 | 174983899 | 174983899 | C | T | Missense_Mutation | p.R98H | 2 |
| MRPS14 | KIRP | chr1 | 174987712 | 174987712 | T | C | Splice_Site | p.M16_splice | 2 |
| MRPS14 | SARC | chr1 | 174992537 | 174992537 | G | T | Missense_Mutation | 1 | |
| MRPS14 | KIRP | chr1 | 174987712 | 174987712 | T | C | Missense_Mutation | 1 | |
| MRPS14 | SKCM | chr1 | 174983953 | 174983953 | C | T | Missense_Mutation | p.R80Q | 1 |
| MRPS14 | LIHC | chr1 | 174983827 | 174983827 | C | A | Missense_Mutation | 1 | |
| MRPS14 | SKCM | chr1 | 174987584 | 174987584 | C | T | Silent | p.R58R | 1 |
| MRPS14 | CESC | chr1 | 174987689 | 174987689 | G | G | Silent | 1 | |
| MRPS14 | LIHC | chr1 | 174983957 | 174983957 | G | A | Missense_Mutation | 1 | |
| MRPS14 | CESC | chr1 | 174987559 | 174987559 | G | A | Missense_Mutation | p.L67F | 1 |
| MRPS14 | LIHC | chr1 | 174987688 | 174987688 | G | - | Frame_Shift_Del | p.Q24fs | 1 |
| MRPS14 | BLCA | chr1 | 174983913 | 174983913 | C | T | Missense_Mutation | 1 | |
| MRPS14 | BLCA | chr1 | 174983887 | 174983887 | C | T | Missense_Mutation | 1 | |
| MRPS14 | ESCA | chr1 | 174987553 | 174987553 | C | T | Splice_Site | e2+1 | 1 |
| MRPS14 | LUAD | chr1 | 174983830 | 174983830 | G | A | Missense_Mutation | p.S121F | 1 |
| MRPS14 | BLCA | chr1 | 174987626 | 174987626 | G | T | Silent | 1 | |
| MRPS14 | STAD | chr1 | 174987603 | 174987603 | A | G | Missense_Mutation | p.L52P | 1 |
| MRPS14 | LUSC | chr1 | 174987657 | 174987657 | A | G | Missense_Mutation | p.M34T | 1 |
| MRPS14 | BLCA | chr1 | 174983913 | 174983913 | C | T | Missense_Mutation | p.M93I | 1 |
| MRPS14 | THYM | chr1 | 174992503 | 174992503 | C | A | Missense_Mutation | 1 | |
| MRPS14 | ESCA | chr1 | 174987553 | 174987553 | C | T | Splice_Site | 1 | |
| MRPS14 | LUSC | chr1 | 174987652 | 174987652 | G | T | Missense_Mutation | p.R36S | 1 |
| MRPS14 | BLCA | chr1 | 174987626 | 174987626 | G | T | Silent | p.A44A | 1 |
| MRPS14 | THYM | chr1 | 174992503 | 174992503 | C | A | Missense_Mutation | p.K14N | 1 |
| MRPS14 | ESCA | chr1 | 174987553 | 174987553 | C | T | Splice_Site | . | 1 |
| MRPS14 | PAAD | chr1 | 174983906 | 174983906 | G | A | Missense_Mutation | p.R96C | 1 |
| MRPS14 | BLCA | chr1 | 174983887 | 174983887 | C | T | Missense_Mutation | p.R102Q | 1 |
| MRPS14 | READ | chr1 | 174987577 | 174987577 | T | C | Missense_Mutation | p.T61A | 1 |
| MRPS14 | BLCA | chr1 | 174987587 | 174987587 | G | C | Silent | p.L57L | 1 |
| Copy number variation (CNV) of MRPS14 * Click on the image to open the original image in a new window. |
 |
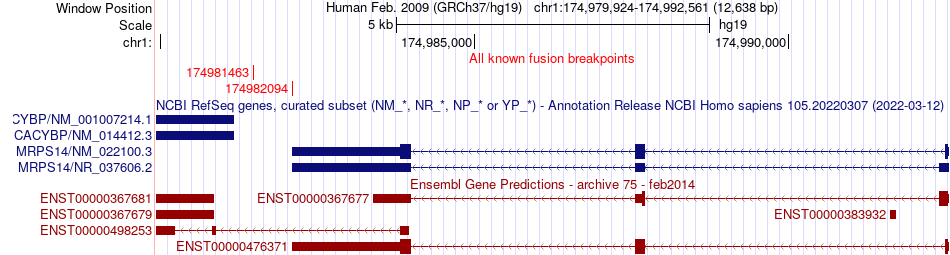
| Fusion gene breakpoints (product of the structural variants (SVs)) across MRPS14 * Click on the image to open the UCSC genome browser with custom track showing this image in a new window. |
 |
| Fusion genes with this translation factor from FusionGDB2.0. |
| FusionGDB2 ID | Disease | Sample | Hgene | Hchr | Hbp | Hstrand | Tgene | Tchr | Tbp | Tstrand |
| 89935 | N/A | AI674594 | PLCH1 | chr3 | 155424943 | - | MRPS14 | chr1 | 174981463 | + |
| 89935 | N/A | AA164318 | RP11-556I14.2 | chr4 | 105833355 | + | MRPS14 | chr1 | 174982094 | + |
| 89937 | N/A | BF475636 | TDRD3 | chr13 | 61109041 | - | MRPS14 | chr1 | 174981463 | + |
Top |
|
| Kaplan-Meier plots with logrank tests of overall survival (OS) |
 |
| Cancer type | Translation factor | Coefficent | Hazard ratio | Wald test pval | Likelihool ratio pval | Logrank test pval | # samples |
Top |
|
| Differential gene expression between female and male. (Wilcoxon test, pval<0.05) |
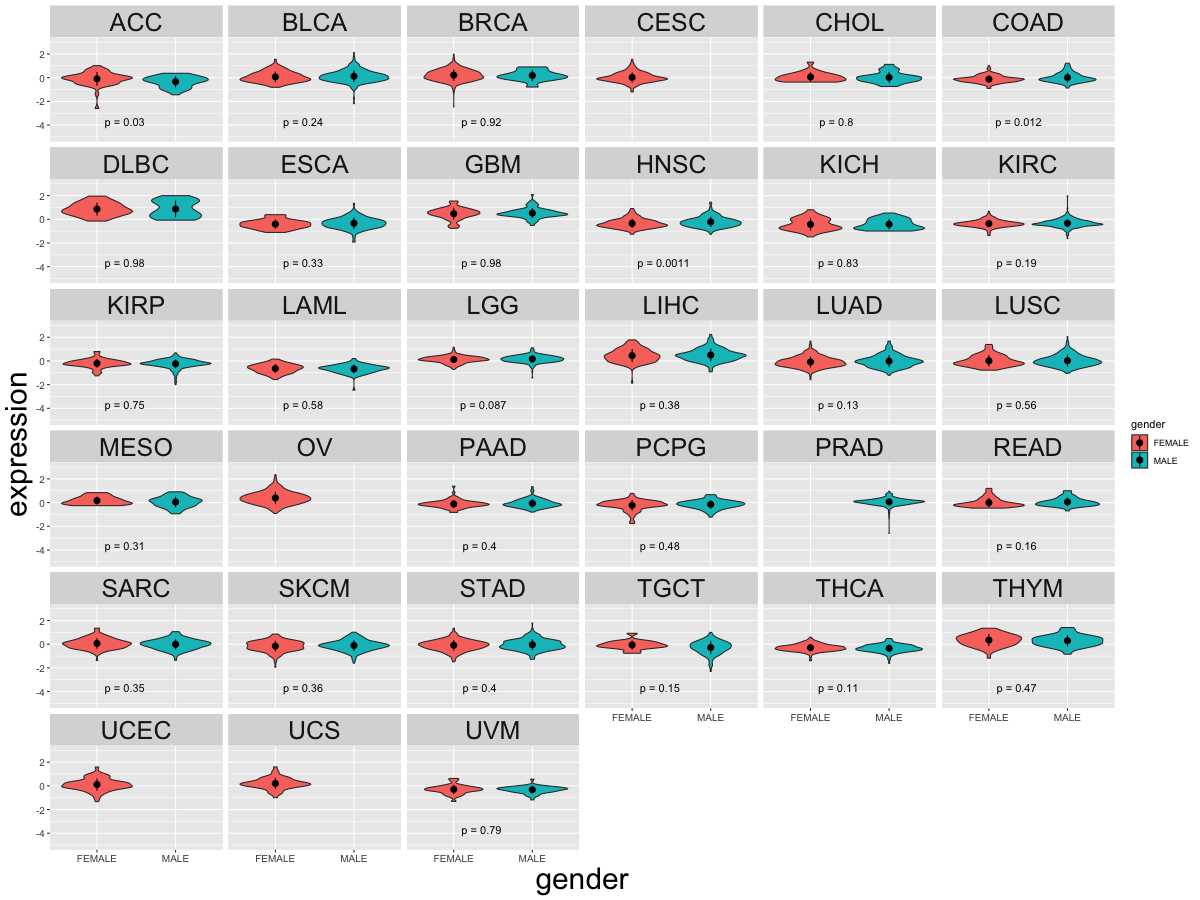 |
| Cancer type | Translation factor | pval | adj.p |
| HNSC | MRPS14 | 0.00114788778252649 | 0.032 |
| COAD | MRPS14 | 0.0122105256102617 | 0.33 |
| ACC | MRPS14 | 0.0299053963155853 | 0.78 |
Top |
|
| Differential gene expression between young and old age groups (Wilcoxon test, pval<0.05) |
 |
| Cancer type | Translation factor | pval | adj.p |
| LIHC | MRPS14 | 0.0135553889440037 | 0.41 |
| LUSC | MRPS14 | 0.000932974143932154 | 0.03 |
| KIRC | MRPS14 | 0.0292874864531711 | 0.82 |
| BRCA | MRPS14 | 6.54221876784969e-05 | 0.0022 |
| PAAD | MRPS14 | 0.00319375758003019 | 0.099 |
| THYM | MRPS14 | 0.0263258804571082 | 0.76 |
Top |
|
| Drugs targeting genes involved in this translation factor. (DrugBank Version 5.1.8 2021-05-08) |
| UniProtAcc | DrugBank ID | Drug name | Drug activity | Drug type | Drug status |
Top |
|
| Diseases associated with this translation factor. (DisGeNet 4.0) |
| Disease ID | Disease Name | # PubMeds | Disease source |
(UTHealth)
Web File Viewing | Emergency Information |Campus Carry|Site Policies