
|
||||||
|

Translation Factor: ZAR1L (NCBI Gene ID:646799) |
|
 Gene Summary Gene Summary |
| Gene Information | Gene Name: ZAR1L | Gene ID: 646799 | Gene Symbol | ZAR1L | Gene ID | 646799 |
| Gene Name | zygote arrest 1 like | |
| Synonyms | Z3CXXC7|ZAR2 | |
| Cytomap | 13q13.1 | |
| Type of Gene | protein-coding | |
| Description | ZAR1-like proteinzinc finger, 3CxxC-type 7 | |
| Modification date | 20200313 | |
| UniProtAcc | A6NP61 | |
| Child GO biological process term(s) under GO:0006412 |
| GO ID | GO term |
| GO:0006412 | Translation |
| Gene ontology of translaction factor with evidence of Inferred from Direct Assay (IDA) from Entrez |
| Partner | Gene | GO ID | GO term | PubMed ID |
| Inferred gene age of translation factor. |
| Gene | Inferred gene age group among (0 - 67.6], (67.6 - 355.7], (355.7 - 733], (733 - 1119.25], >1119.25 |
| ZAR1L | (355.7 - 733] |
Top |
|
| We searched PubMed using 'ZAR1L[title] AND translation [title] AND human.' |
| Gene | Title | PMID |
| ZAR1L | . | . |
Top |
|
| Skipped exons in TCGA and GTEx based on Ensembl gene isoform structure. * Click on the image to open the UCSC genome browser with custom track showing this image in a new window. For more annotations, please visit our ExonSkipDB. |
 |
| Open reading frame (ORF) analsis of exon skipping events based on Ensembl gene isoform structure. * Click on the break point to see the gene structure around the break point region using the UCSC Genome Browser. |
| ENST | Exon skip start (DNA) | Exon Skip end (DNA) | ORF |
| Exon skipping position in the amino acid sequence. |
| ENST | Exon skip start (DNA) | Exon Skip end (DNA) | Len(transcript seq) | Exon skip start (mRNA) | Exon Skip end (mRNA) | Len(amino acid seq) | Exon skip start (AA) | Exon Skip end (AA) |
| Potentially (partially) lost protein functional features of UniProt. |
| UniProtAcc | Exon skip start (AA) | Exon Skip end (AA) | Function feature start (AA) | Function feature end (AA) | Functional feature type | Functional feature desc. |
Top |
|
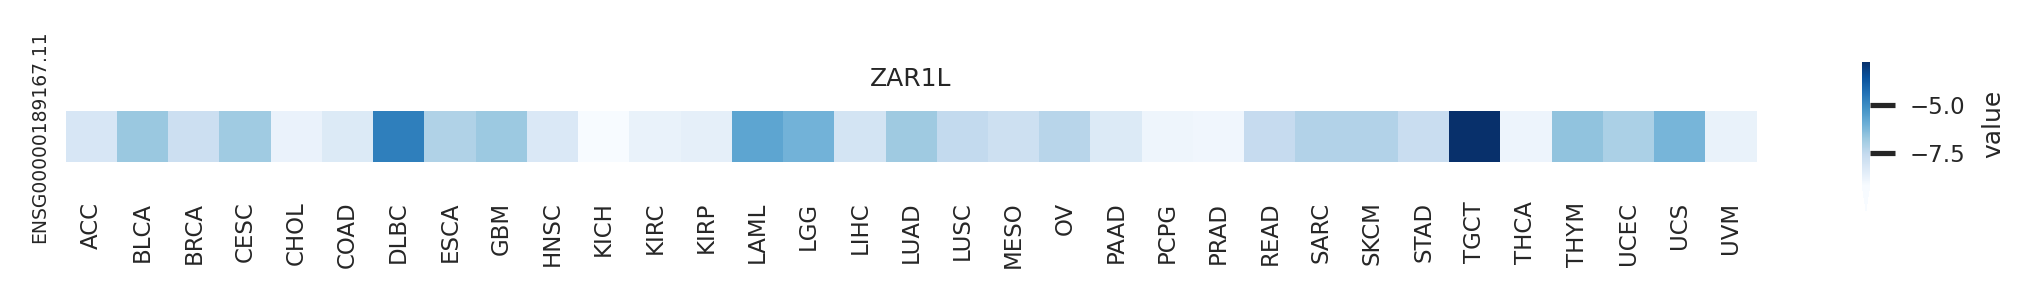
| Gene expression level across TCGA pancancer |
 |
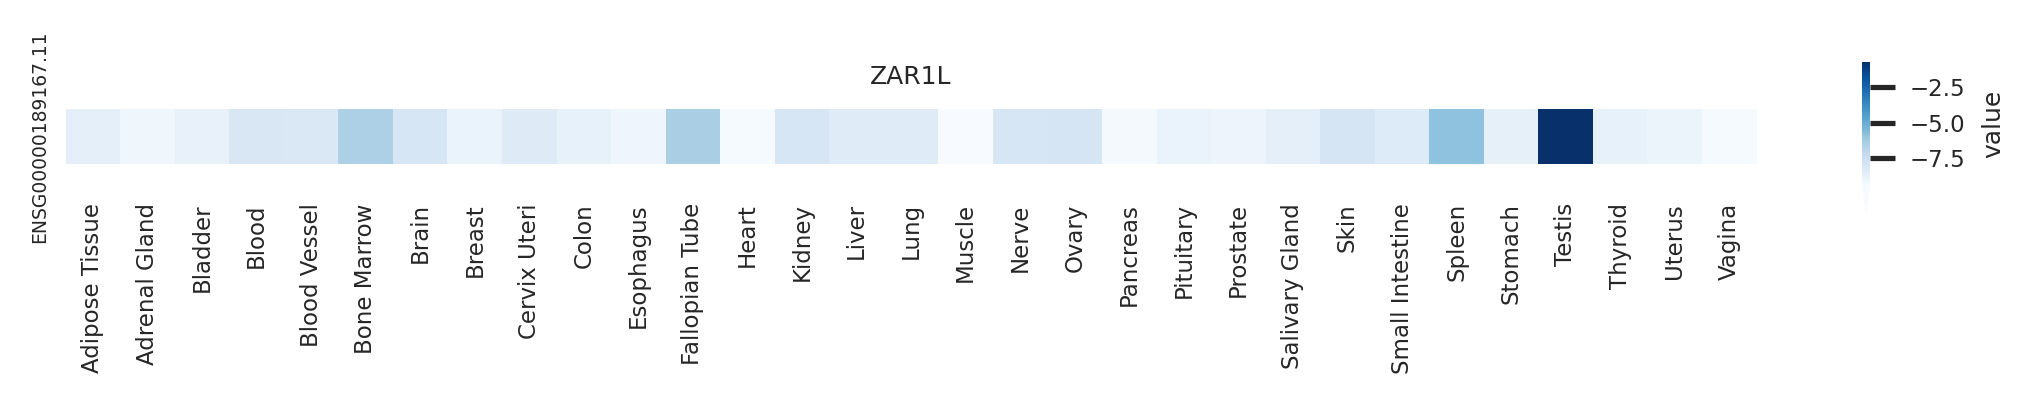
| Gene expression level across GTEx pantissue |
 |
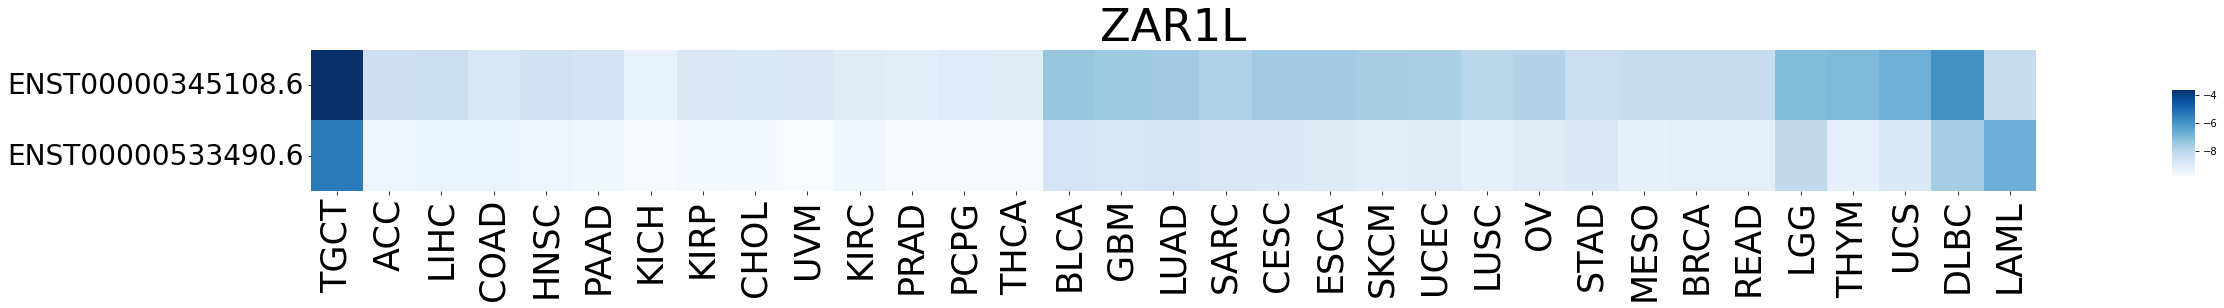
| Expression level of gene isoforms across TCGA pancancer |
 |
| Expression level of gene isoforms across GTEx pantissue |
 |
| Cancer(tissue) type-specific expression level of Translation factor using z-score distriution |
 |
| Differential expression between tumor and matched normal (in the cancer types with more than 10 matched samples) |
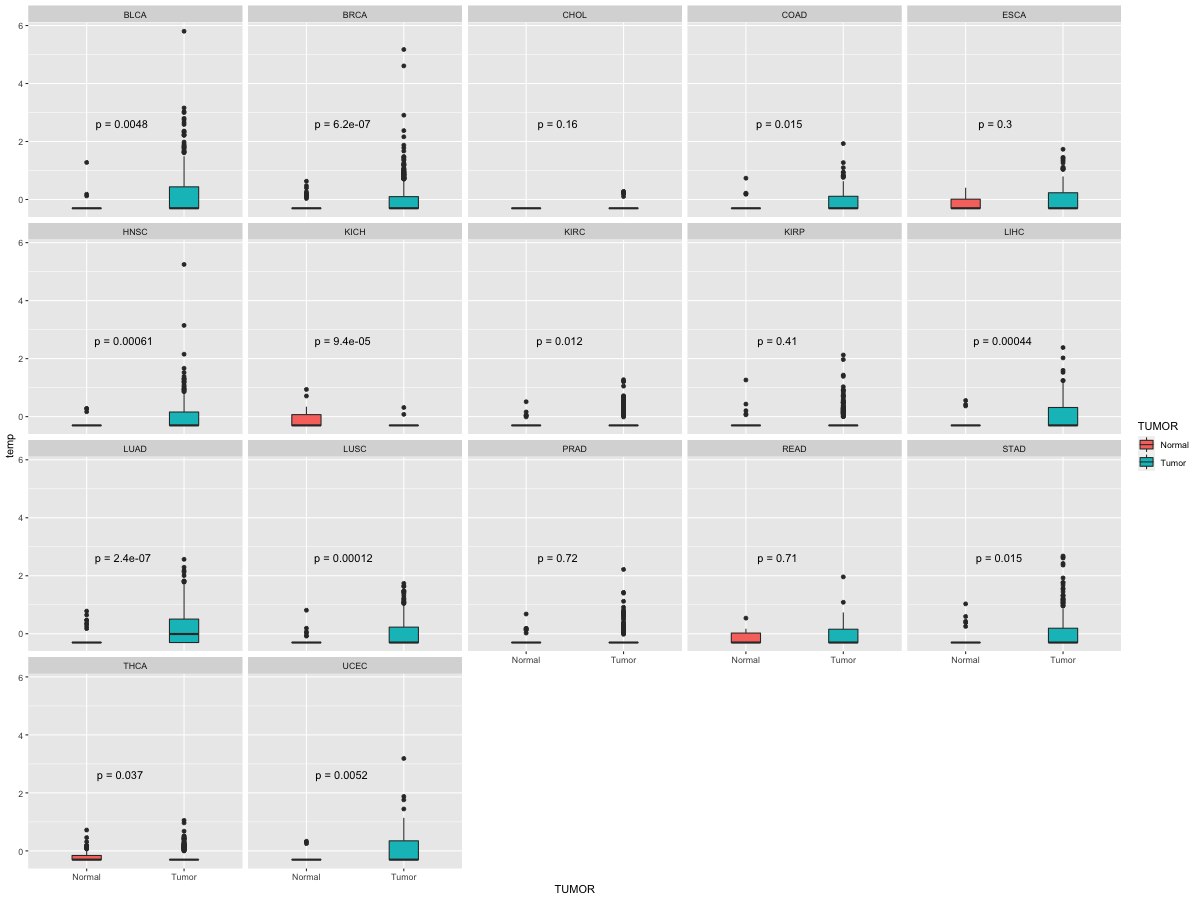 |
| Cancer type | Translation factor | FC | adj.pval |
| BRCA | ZAR1L | -1.43552662887974 | 0.00130864564001974 |
| LUSC | ZAR1L | -2.58031809554772 | 0.00182371710054537 |
| LIHC | ZAR1L | -2.82831742915807 | 0.00584076338898049 |
| KICH | ZAR1L | 1.40471366673396 | 0.0208625823327655 |
| HNSC | ZAR1L | -1.35969590956752 | 0.0454587523438197 |
Top |
|
| Translation factor expression regulation through miRNA binding |
| Cancer type | Gene | miRNA | TargetScan binding score (Context++ score percentile) | Coefficient | Pvalue |
| Translation factor expression regulation through methylation in the promoter of Translation factor |
| Cancer type | Gene | methyl group b | methyl group a | DEG pval | avg methyl in b | avg methyl in a | avg exp in b | avg exp in a |
| Translation factor expression regulation through methylation in the gene body of Translation factor (positive regulation) |
| Cancer type | Gene | methyl group b | methyl group a | DEG pval | avg methyl in b | avg methyl in a | avg exp in b | avg exp in a |
| Translation factor expression regulation through copy number variation of Translation factor |
| Cancer type | Gene | Coefficient | Pvalue |
Top |
|
| Strongly correlated genes belong to cellular important gene groups with ZAR1L (coefficient>0.8, pval<0.05, node color based on FC between tumor and matched normal). Significantly associated important genes in the individual cancer types. * Cell metabolism gene: cell metabolism genes from REACTOME (black edge), IUPHAR: drug target genes from IUPHAR (blue edge), Kinase: human kinase genes (brown edge), CGC: cancer gene census genes (orange edge), TSG: tumor suppresor genes (purple edge), Epifactor: epigenetic factors (light blue edge), TF: transcription factors (green) |
| Cancer type | Gene group | Translation factor | Correlated gene | Coefficient | Pvalue |
Top |
|
| Protein 3D structure Visit iCn3D. |
Top |
|
| Protein-protein interaction networks * Overlap between up-regulated DEGs (log2FC<-1 and adj.P<0.05) and STRING PPI network (center: Translation factor, node: DEGs, edges: weighted by -log2(adj.P)) |
 |
| Overlap between down-regulated DEGs (log2FC>1 and adj.P<0.05) and STRING PPI network (center: Translation factor, node: DEGs, edges: weighted by -log2(adj.P)) |
 |
 * Edge colors based on TCGA cancer types. |
| * Overlap between DEGs (log2FC>1 and adj.P<0.05) and STRING PPI network per cancer (center: Translation factor, node: DEGs, node color: log2FC, edges: weighted by -log2(adj.P)) |
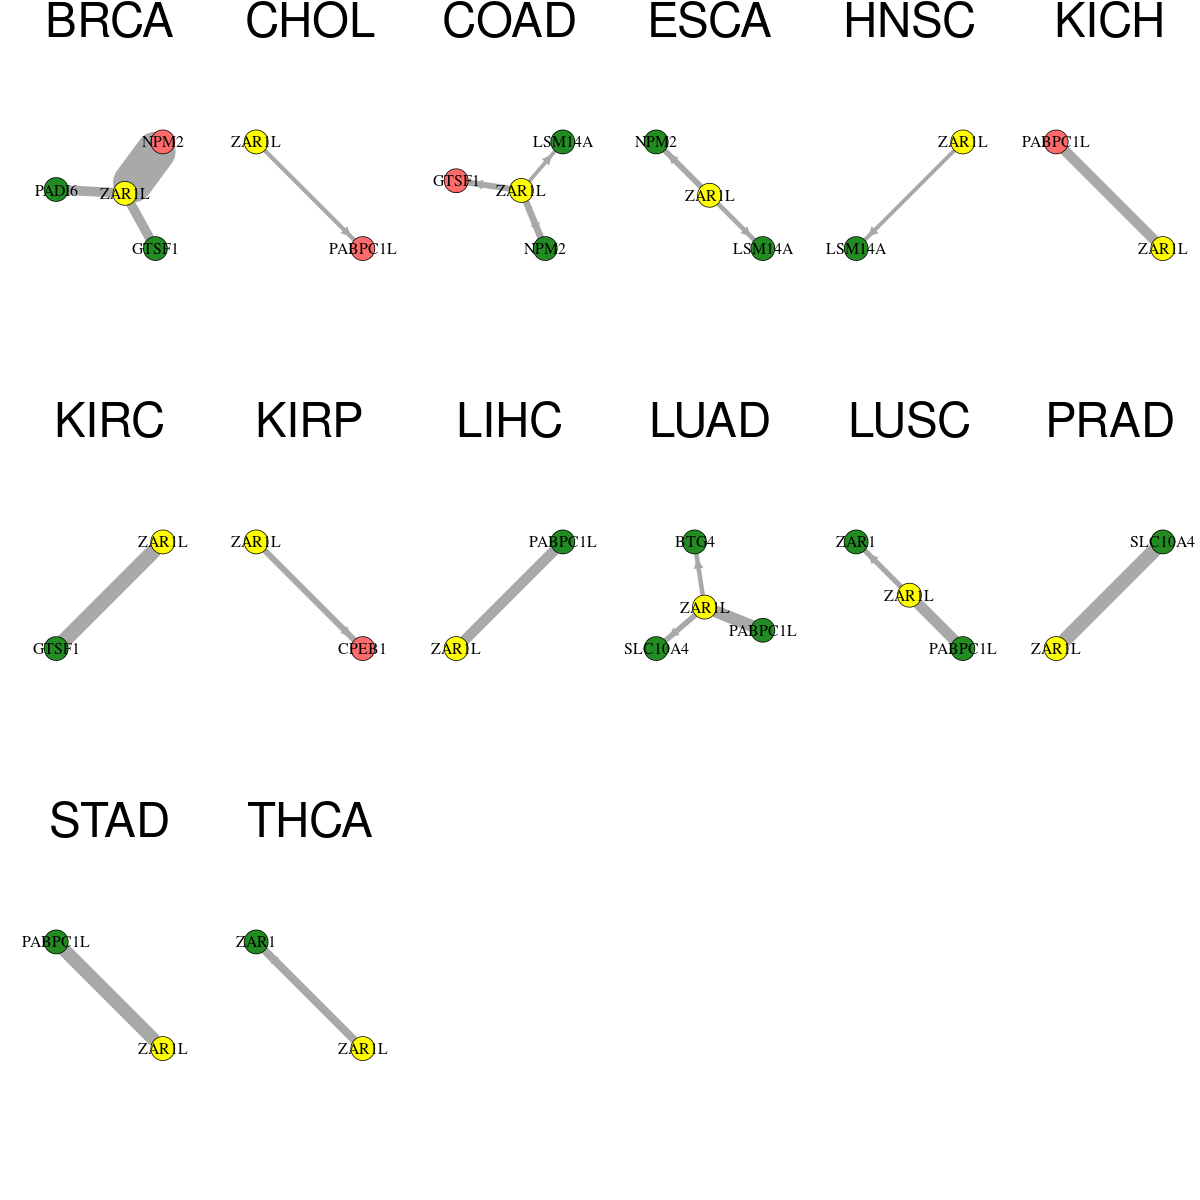 |
| Cancer type | Translation factor | Interacting protein coding gene | FC | adj.pval |
| BRCA | ZAR1L | PADI6 | -3.78499078181357 | 0.000129376845570936 |
| BRCA | ZAR1L | GTSF1 | -1.73423011618186 | 0.00014616362609347 |
| THCA | ZAR1L | ZAR1 | -6.3115942625464 | 0.000643096429992795 |
| COAD | ZAR1L | NPM2 | -1.35899338598868 | 0.00197160243988037 |
| COAD | ZAR1L | GTSF1 | 2.32874350767831 | 0.00355097651481629 |
| KIRP | ZAR1L | CPEB1 | 2.39393200480884 | 0.00361521635204554 |
| ESCA | ZAR1L | NPM2 | -6.41448801325906 | 0.0048828125 |
| LUAD | ZAR1L | SLC10A4 | -1.66322304654157 | 0.00642418213663947 |
| LUSC | ZAR1L | ZAR1 | -4.76596582823308 | 0.00753148348807362 |
| ESCA | ZAR1L | LSM14A | -3.69586672689126 | 0.013671875 |
| LUAD | ZAR1L | BTG4 | -1.52263207213354 | 0.0148465704687343 |
| CHOL | ZAR1L | PABPC1L | 2.78331172494241 | 0.01953125 |
| HNSC | ZAR1L | LSM14A | -1.43426729122269 | 0.0256568653412614 |
| COAD | ZAR1L | LSM14A | -1.67535009491501 | 0.0291509032249451 |
| KIRC | ZAR1L | GTSF1 | -2.22345513241124 | 1.03594308119664e-06 |
| BRCA | ZAR1L | NPM2 | 2.33682708030626 | 1.21368585808608e-16 |
| LUAD | ZAR1L | PABPC1L | -2.51583026501524 | 1.30692790027182e-05 |
| PRAD | ZAR1L | SLC10A4 | -2.78648661747506 | 1.78303573859803e-06 |
| LUSC | ZAR1L | PABPC1L | -2.50538171229714 | 3.79466966402315e-05 |
| STAD | ZAR1L | PABPC1L | -2.43245436541992 | 4.02145087718964e-06 |
| LIHC | ZAR1L | PABPC1L | -2.77562492714404 | 6.17267413816717e-05 |
| KICH | ZAR1L | PABPC1L | 2.22531868187715 | 7.49826431274414e-05 |
| Protein-protein interactors with this translation factor (BIOGRID-3.4.160) |
| PPI interactors with ZAR1L |
| FAM83D, MCL1, CLUH, ANGEL1, CDK5RAP2, FAM73A, PXN, FAM117A, GLCCI1, BCL2L1, HMBOX1, BCL2L11, GPHN, EML3, ELAVL2, SECISBP2L, |
Top |
|
| Clinically associated variants from ClinVar. |
| Gene | Chr | Position | RefSeq | VarSeq | RefSeeq | VarType | Pathogenic | Disease | VarInfo |
| nsSNVs with sample frequency (size of circle) from TCGA 33 cancers. |
 |
| SNVs and Indels |
| Gene | Cancer type | Chromosome | Start | End | RefSeeq | MutSeq | Mutation type | AAchange | # samples |
| ZAR1L | COAD | chr13 | 32885654 | 32885654 | T | C | Missense_Mutation | p.T137A | 10 |
| ZAR1L | COAD | chr13 | 32885658 | 32885658 | G | A | Silent | p.P135P | 9 |
| ZAR1L | LIHC | chr13 | 32878064 | 32878064 | G | C | Missense_Mutation | p.D306E | 3 |
| ZAR1L | COAD | chr13 | 32884822 | 32884822 | G | A | Missense_Mutation | p.T234I | 3 |
| ZAR1L | UCEC | chr13 | 32878056 | 32878056 | A | C | Missense_Mutation | p.F309C | 2 |
| ZAR1L | UCEC | chr13 | 32885607 | 32885607 | C | T | Silent | p.A152 | 2 |
| ZAR1L | UCEC | chr13 | 32885806 | 32885806 | G | A | Missense_Mutation | p.P86L | 2 |
| ZAR1L | UCEC | chr13 | 32885823 | 32885823 | G | A | Silent | p.S80 | 2 |
| ZAR1L | UCEC | chr13 | 32885865 | 32885865 | C | T | Silent | p.A66 | 2 |
| ZAR1L | SARC | chr13 | 32886050 | 32886050 | C | T | Missense_Mutation | 2 | |
| ZAR1L | UCEC | chr13 | 32885904 | 32885904 | C | T | Silent | p.A53 | 2 |
| ZAR1L | SARC | chr13 | 32886059 | 32886059 | C | T | Missense_Mutation | 2 | |
| ZAR1L | BRCA | chr13 | 32885924 | 32885924 | G | C | Missense_Mutation | p.P47A | 2 |
| ZAR1L | ESCA | chr13 | 32885527 | 32885527 | T | C | Missense_Mutation | p.E179G | 2 |
| ZAR1L | CESC | chr13 | 32885503 | 32885503 | G | A | Missense_Mutation | 2 | |
| ZAR1L | ESCA | chr13 | 32885527 | 32885527 | T | C | Missense_Mutation | 2 | |
| ZAR1L | SARC | chr13 | 32886050 | 32886050 | C | T | Missense_Mutation | p.V5I | 2 |
| ZAR1L | SARC | chr13 | 32886059 | 32886059 | C | T | Missense_Mutation | p.E2K | 2 |
| ZAR1L | CESC | chr13 | 32878152 | 32878152 | G | C | Nonsense_Mutation | 2 | |
| ZAR1L | LIHC | chr13 | 32878064 | 32878064 | G | C | Missense_Mutation | 1 | |
| ZAR1L | CESC | chr13 | 32885503 | 32885503 | G | A | Missense_Mutation | p.S187L | 1 |
| ZAR1L | CESC | chr13 | 32885681 | 32885681 | G | T | Missense_Mutation | p.P128T | 1 |
| ZAR1L | LIHC | chr13 | 32878112 | 32878112 | A | - | Frame_Shift_Del | p.I290fs | 1 |
| ZAR1L | READ | chr13 | 32878092 | 32878092 | C | T | Missense_Mutation | p.R297Q | 1 |
| ZAR1L | READ | chr13 | 32884782 | 32884782 | C | T | Silent | p.T247T | 1 |
| ZAR1L | COAD | chr13 | 32885866 | 32885866 | G | A | Missense_Mutation | p.A66V | 1 |
| ZAR1L | SARC | chr13 | 32885654 | 32885654 | T | C | Missense_Mutation | 1 | |
| ZAR1L | COAD | chr13 | 32885905 | 32885905 | G | A | Missense_Mutation | p.A53V | 1 |
| ZAR1L | SARC | chr13 | 32885529 | 32885529 | C | T | Silent | 1 | |
| ZAR1L | CESC | chr13 | 32885681 | 32885681 | G | T | Missense_Mutation | 1 | |
| ZAR1L | ESCA | chr13 | 32885658 | 32885658 | G | A | Silent | 1 |
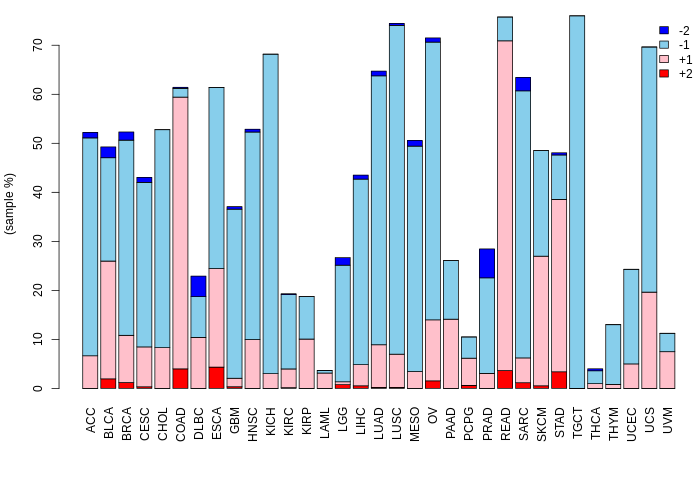
| Copy number variation (CNV) of ZAR1L * Click on the image to open the original image in a new window. |
 |
| Fusion gene breakpoints (product of the structural variants (SVs)) across ZAR1L * Click on the image to open the UCSC genome browser with custom track showing this image in a new window. |
 |
| Fusion genes with this translation factor from FusionGDB2.0. |
| FusionGDB2 ID | Disease | Sample | Hgene | Hchr | Hbp | Hstrand | Tgene | Tchr | Tbp | Tstrand |
| 79128 | BRCA | TCGA-AN-A04D-01A | N4BP2L2 | chr13 | 33101545 | - | ZAR1L | chr13 | 32878159 | - |
| 79128 | N/A | BM153481 | SAMM50 | chr22 | 44385052 | - | ZAR1L | chr13 | 32885919 | + |
| 102045 | N/A | AA564088 | ZAR1L | chr13 | 32883150 | + | RPLP2 | chr11 | 812876 | - |
Top |
|
| Kaplan-Meier plots with logrank tests of overall survival (OS) |
 |
| Cancer type | Translation factor | Coefficent | Hazard ratio | Wald test pval | Likelihool ratio pval | Logrank test pval | # samples |
Top |
|
| Differential gene expression between female and male. (Wilcoxon test, pval<0.05) |
 |
| Cancer type | Translation factor | pval | adj.p |
| TGCT | ZAR1L | 0.000375285789860204 | 0.011 |
| HNSC | ZAR1L | 0.00317786229669038 | 0.086 |
| STAD | ZAR1L | 0.0396695645794709 | 1 |
Top |
|
| Differential gene expression between young and old age groups (Wilcoxon test, pval<0.05) |
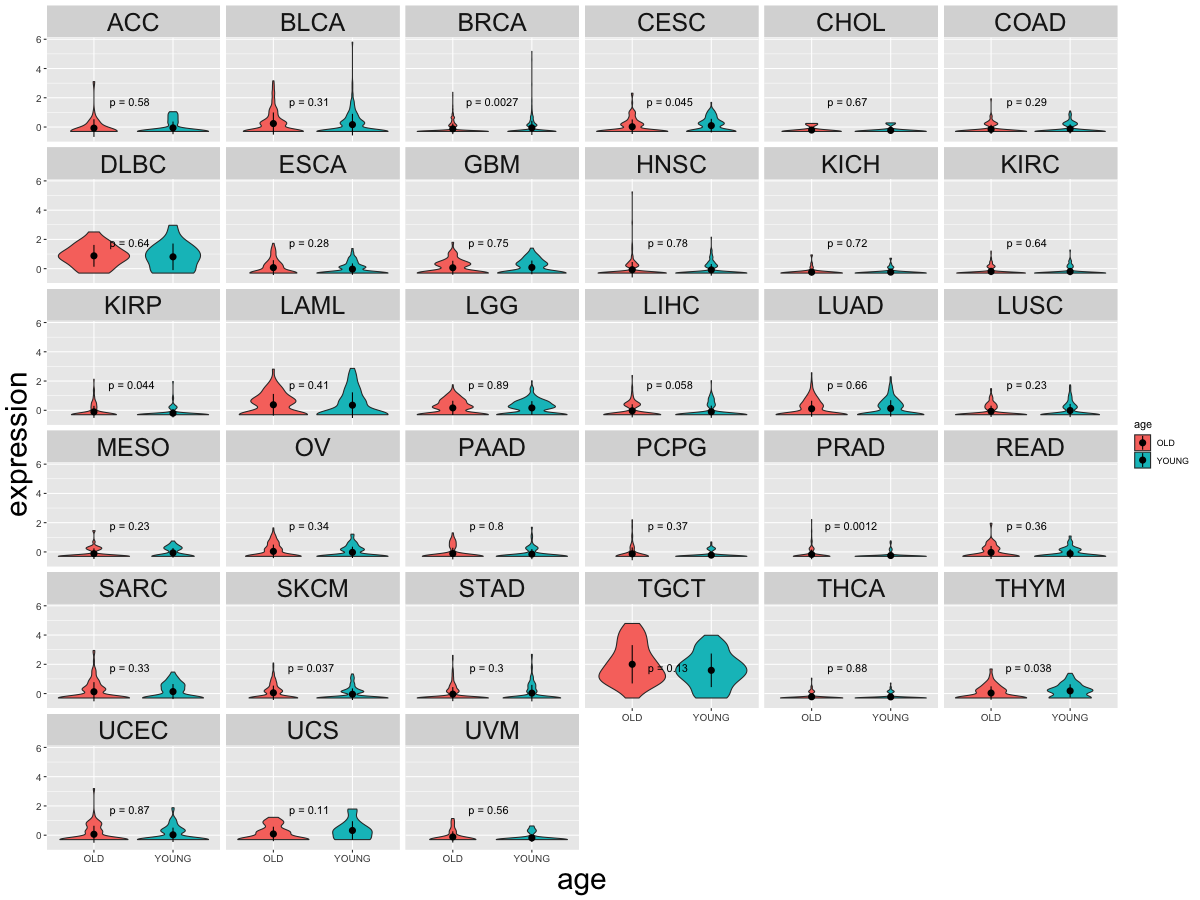 |
| Cancer type | Translation factor | pval | adj.p |
| KIRP | ZAR1L | 0.0437168978816362 | 1 |
| BRCA | ZAR1L | 0.00268058898370705 | 0.086 |
| PRAD | ZAR1L | 0.0011938442082026 | 0.039 |
| SKCM | ZAR1L | 0.0368208010542047 | 1 |
| CESC | ZAR1L | 0.0449200939686949 | 1 |
| THYM | ZAR1L | 0.038020708171996 | 1 |
Top |
|
| Drugs targeting genes involved in this translation factor. (DrugBank Version 5.1.8 2021-05-08) |
| UniProtAcc | DrugBank ID | Drug name | Drug activity | Drug type | Drug status |
Top |
|
| Diseases associated with this translation factor. (DisGeNet 4.0) |
| Disease ID | Disease Name | # PubMeds | Disease source |
(UTHealth)
Web File Viewing | Emergency Information |Campus Carry|Site Policies