
|
||||||
|

Translation Factor: MRPL57 (NCBI Gene ID:78988) |
|
 Gene Summary Gene Summary |
| Gene Information | Gene Name: MRPL57 | Gene ID: 78988 | Gene Symbol | MRPL57 | Gene ID | 78988 |
| Gene Name | mitochondrial ribosomal protein L57 | |
| Synonyms | MRP63|bMRP63 | |
| Cytomap | 13q12.11 | |
| Type of Gene | protein-coding | |
| Description | ribosomal protein 63, mitochondrialhMRP63mitochondrial large ribosomal subunit protein mL63mitochondrial ribosomal protein 63mitochondrial ribosomal protein bMRP63 | |
| Modification date | 20200313 | |
| UniProtAcc | Q9BQC6 | |
| Child GO biological process term(s) under GO:0006412 |
| GO ID | GO term |
| GO:0032543 | Mitochondrial translation |
| GO:0005840 | Ribosome |
| GO:0006412 | Translation |
| Gene ontology of translaction factor with evidence of Inferred from Direct Assay (IDA) from Entrez |
| Partner | Gene | GO ID | GO term | PubMed ID |
| Inferred gene age of translation factor. |
| Gene | Inferred gene age group among (0 - 67.6], (67.6 - 355.7], (355.7 - 733], (733 - 1119.25], >1119.25 |
| MRPL57 | (733 - 1119.25] |
Top |
|
| We searched PubMed using 'MRPL57[title] AND translation [title] AND human.' |
| Gene | Title | PMID |
| MRPL57 | . | . |
Top |
|
| Skipped exons in TCGA and GTEx based on Ensembl gene isoform structure. * Click on the image to open the UCSC genome browser with custom track showing this image in a new window. For more annotations, please visit our ExonSkipDB. |
 |
| Open reading frame (ORF) analsis of exon skipping events based on Ensembl gene isoform structure. * Click on the break point to see the gene structure around the break point region using the UCSC Genome Browser. |
| ENST | Exon skip start (DNA) | Exon Skip end (DNA) | ORF |
| Exon skipping position in the amino acid sequence. |
| ENST | Exon skip start (DNA) | Exon Skip end (DNA) | Len(transcript seq) | Exon skip start (mRNA) | Exon Skip end (mRNA) | Len(amino acid seq) | Exon skip start (AA) | Exon Skip end (AA) |
| Potentially (partially) lost protein functional features of UniProt. |
| UniProtAcc | Exon skip start (AA) | Exon Skip end (AA) | Function feature start (AA) | Function feature end (AA) | Functional feature type | Functional feature desc. |
Top |
|
| Gene expression level across TCGA pancancer |
 |
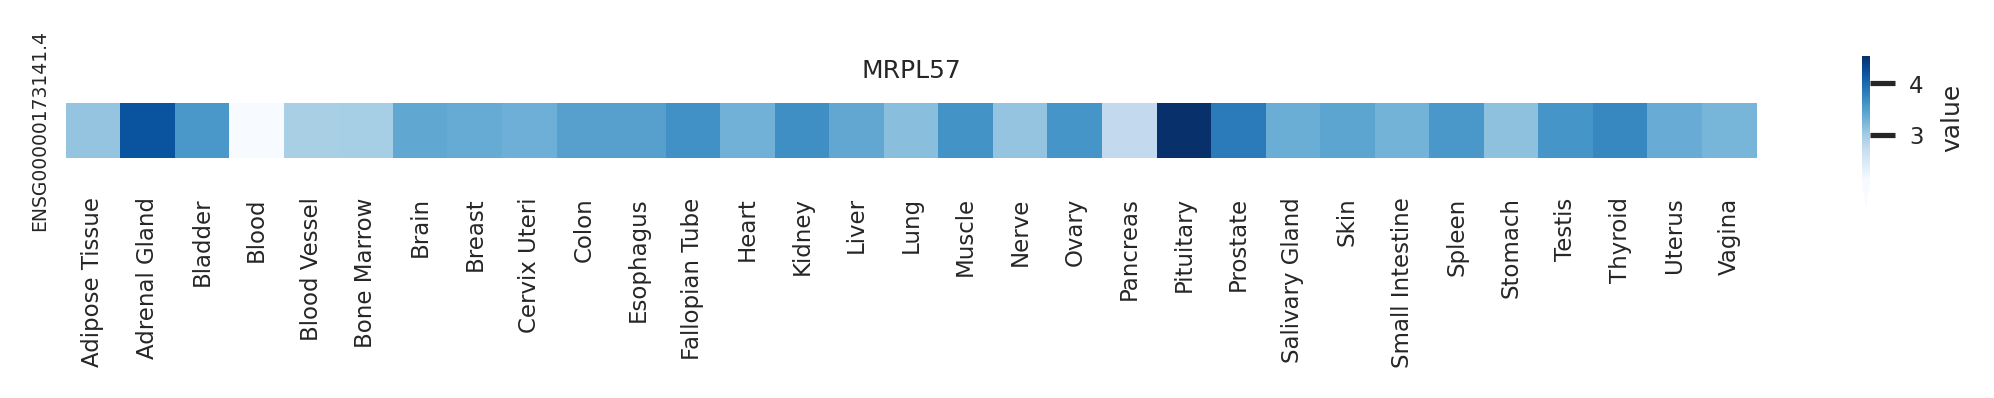
| Gene expression level across GTEx pantissue |
 |
| Expression level of gene isoforms across TCGA pancancer |
 |
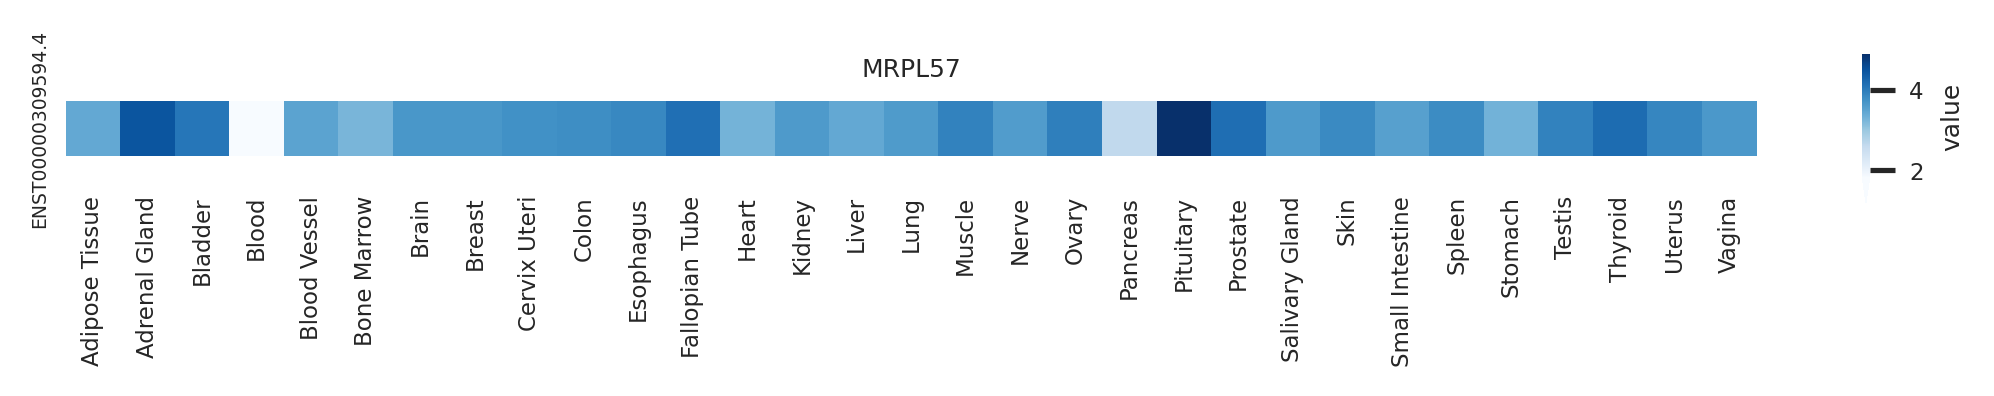
| Expression level of gene isoforms across GTEx pantissue |
 |
| Cancer(tissue) type-specific expression level of Translation factor using z-score distriution |
| Differential expression between tumor and matched normal (in the cancer types with more than 10 matched samples) |
| Cancer type | Translation factor | FC | adj.pval |
Top |
|
| Translation factor expression regulation through miRNA binding |
| Cancer type | Gene | miRNA | TargetScan binding score (Context++ score percentile) | Coefficient | Pvalue |
| Translation factor expression regulation through methylation in the promoter of Translation factor |
| Cancer type | Gene | methyl group b | methyl group a | DEG pval | avg methyl in b | avg methyl in a | avg exp in b | avg exp in a |
| Translation factor expression regulation through methylation in the gene body of Translation factor (positive regulation) |
| Cancer type | Gene | methyl group b | methyl group a | DEG pval | avg methyl in b | avg methyl in a | avg exp in b | avg exp in a |
| Translation factor expression regulation through copy number variation of Translation factor |
| Cancer type | Gene | Coefficient | Pvalue |
Top |
|
| Strongly correlated genes belong to cellular important gene groups with MRPL57 (coefficient>0.8, pval<0.05, node color based on FC between tumor and matched normal). Significantly associated important genes in the individual cancer types. * Cell metabolism gene: cell metabolism genes from REACTOME (black edge), IUPHAR: drug target genes from IUPHAR (blue edge), Kinase: human kinase genes (brown edge), CGC: cancer gene census genes (orange edge), TSG: tumor suppresor genes (purple edge), Epifactor: epigenetic factors (light blue edge), TF: transcription factors (green) |
| Cancer type | Gene group | Translation factor | Correlated gene | Coefficient | Pvalue |
Top |
|
| Protein 3D structure Visit iCn3D. |
Top |
|
| Protein-protein interaction networks * Overlap between up-regulated DEGs (log2FC<-1 and adj.P<0.05) and STRING PPI network (center: Translation factor, node: DEGs, edges: weighted by -log2(adj.P)) |
 |
| Overlap between down-regulated DEGs (log2FC>1 and adj.P<0.05) and STRING PPI network (center: Translation factor, node: DEGs, edges: weighted by -log2(adj.P)) |
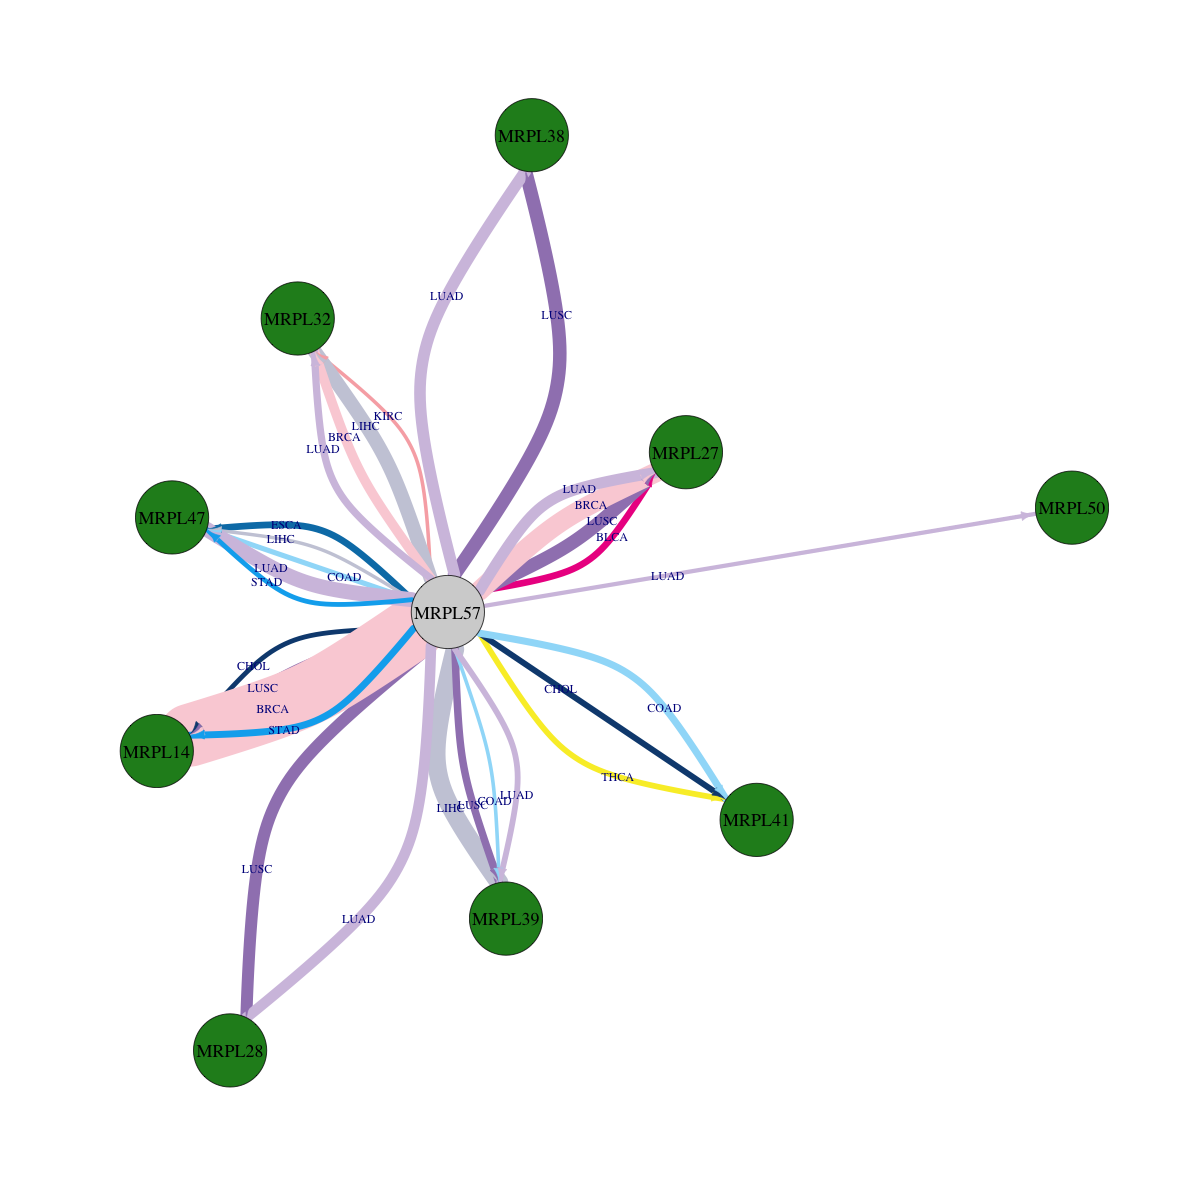 |
 * Edge colors based on TCGA cancer types. |
| * Overlap between DEGs (log2FC>1 and adj.P<0.05) and STRING PPI network per cancer (center: Translation factor, node: DEGs, node color: log2FC, edges: weighted by -log2(adj.P)) |
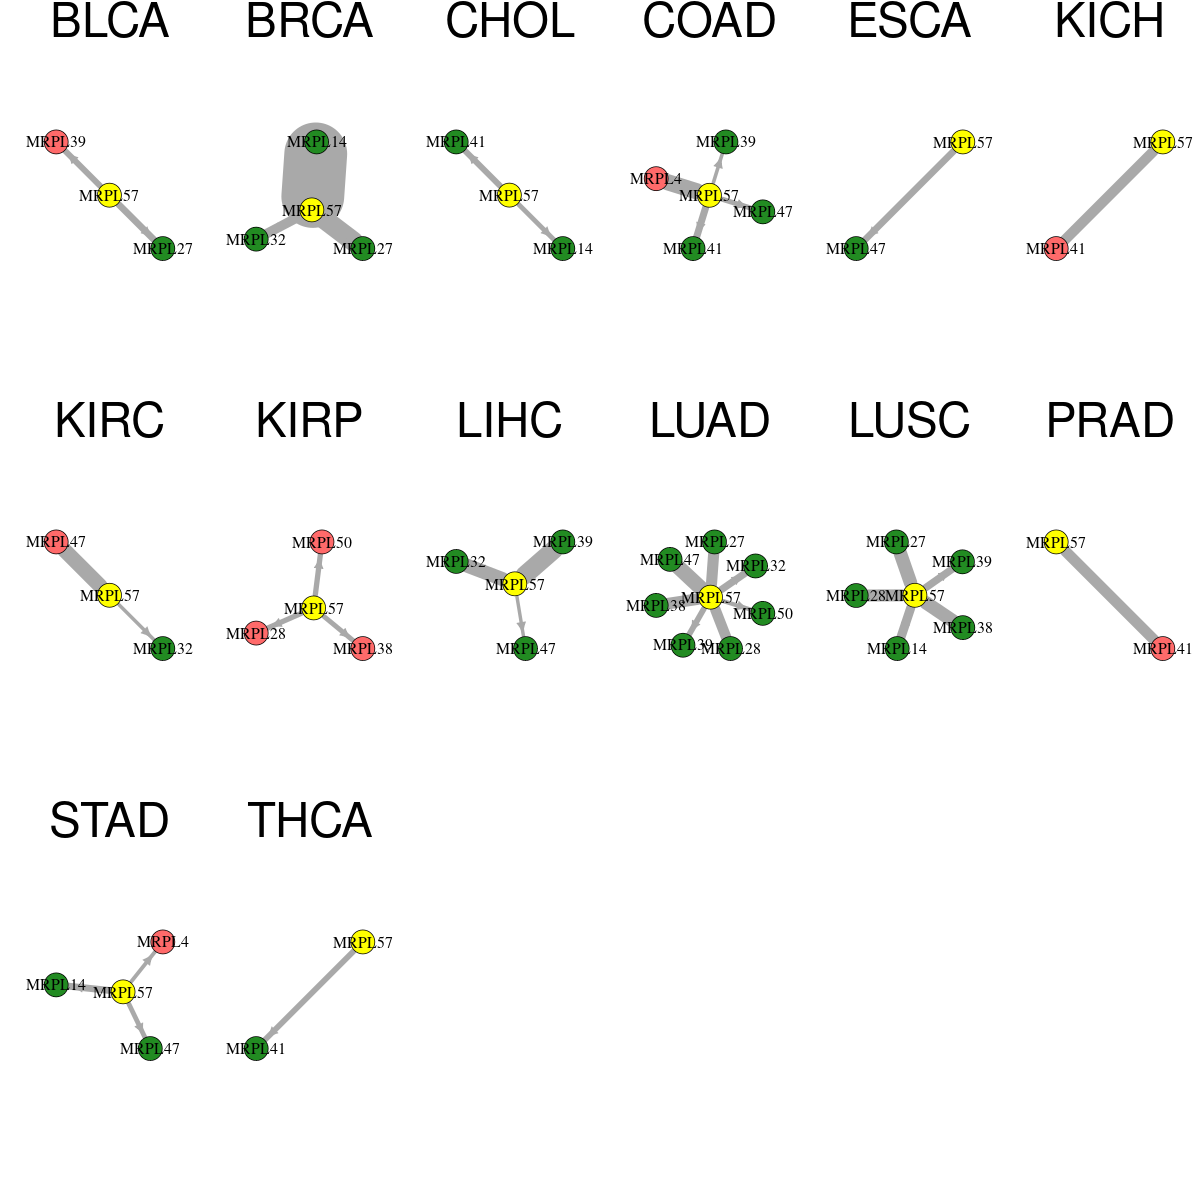 |
| Cancer type | Translation factor | Interacting protein coding gene | FC | adj.pval |
| BRCA | MRPL57 | MRPL32 | -3.7979134181794 | 0.000134327661287861 |
| LUSC | MRPL57 | MRPL14 | -1.71268240841587 | 0.000225616184179674 |
| LUSC | MRPL57 | MRPL39 | -3.50411737429004 | 0.000985010025625636 |
| LUAD | MRPL57 | MRPL32 | -2.1966239418264 | 0.00121089428940613 |
| COAD | MRPL57 | MRPL41 | -2.99561502382389 | 0.00144392251968384 |
| STAD | MRPL57 | MRPL14 | -1.63635821135563 | 0.00166679499670863 |
| ESCA | MRPL57 | MRPL47 | -2.26373711796715 | 0.001953125 |
| BLCA | MRPL57 | MRPL27 | -4.19270554058168 | 0.00202178955078125 |
| CHOL | MRPL57 | MRPL41 | -4.96379377542225 | 0.00390625 |
| BLCA | MRPL57 | MRPL39 | 1.69896851960452 | 0.00391769409179688 |
| LUAD | MRPL57 | MRPL39 | -1.1049452981592 | 0.00471395891927286 |
| THCA | MRPL57 | MRPL41 | -3.88188543554269 | 0.00492925389458784 |
| KIRP | MRPL57 | MRPL50 | 1.73501379972723 | 0.00733334058895707 |
| KIRP | MRPL57 | MRPL28 | 1.10848699852281 | 0.00779616041108966 |
| COAD | MRPL57 | MRPL47 | -2.29582381838246 | 0.00863465666770936 |
| KIRP | MRPL57 | MRPL38 | 1.28078686740376 | 0.0105091729201376 |
| CHOL | MRPL57 | MRPL14 | -2.77508784578606 | 0.01171875 |
| STAD | MRPL57 | MRPL47 | -1.4008685687155 | 0.0118026207201183 |
| LUAD | MRPL57 | MRPL50 | -2.00209640961088 | 0.0197825515973911 |
| STAD | MRPL57 | MRPL4 | 1.4393539135682 | 0.0279771662317216 |
| COAD | MRPL57 | MRPL39 | -1.15285953291756 | 0.0357243716716767 |
| KIRC | MRPL57 | MRPL32 | -2.79664327578899 | 0.0376051795400881 |
| LIHC | MRPL57 | MRPL47 | -6.59586850948538 | 0.0416658979324166 |
| KIRC | MRPL57 | MRPL47 | 1.74758475364701 | 1.00533732476669e-06 |
| BRCA | MRPL57 | MRPL27 | -1.5584165725499 | 1.16393956539382e-08 |
| LUSC | MRPL57 | MRPL28 | -2.17870242177449 | 1.51941378521463e-05 |
| LUAD | MRPL57 | MRPL38 | -1.82500284003406 | 2.20741561246108e-05 |
| LIHC | MRPL57 | MRPL32 | -1.20074144698753 | 2.24402029682138e-06 |
| COAD | MRPL57 | MRPL4 | 2.77705897514473 | 2.98023223876954e-07 |
| LUAD | MRPL57 | MRPL27 | -1.39404329671842 | 3.44055922076328e-05 |
| LUSC | MRPL57 | MRPL27 | -1.81809468729316 | 3.90393047420304e-06 |
| LUSC | MRPL57 | MRPL38 | -1.46267889332591 | 3.90393047420304e-06 |
| LIHC | MRPL57 | MRPL39 | -1.65461683386216 | 3.95799979560965e-08 |
| PRAD | MRPL57 | MRPL41 | 1.31179686307216 | 4.41809300064344e-05 |
| LUAD | MRPL57 | MRPL28 | -1.41031503837636 | 5.67286357063566e-05 |
| BRCA | MRPL57 | MRPL14 | -2.04484091387488 | 6.1798840626103e-26 |
| KICH | MRPL57 | MRPL41 | 1.05103651319563 | 7.49826431274414e-05 |
| LUAD | MRPL57 | MRPL47 | -1.74990909879567 | 9.53955602455483e-07 |
| Protein-protein interactors with this translation factor (BIOGRID-3.4.160) |
| PPI interactors with MRPL57 |
| MRPL32, MRPL38, ABCC2, DDX28, MRPL19, MRPL15, MRPL50, PLP2, EWSR1, MRPL28, MRPL4, HNRNPA1, MRPL39, MRPS30, MRPL47, CREB3, MRPL1, Sars, C7orf55, XPNPEP3, KBTBD7, MRPL42, MRPL10, MRPL41, FBXW11, MRPL12, RPS8, LEO1, MINOS1, MRPL27, MRPS11, MRPS5, GATB, PGK1, PSMC1, PSMD1, PSMD4, PSMD6, SKA3, TAZ, WDR61, AGR2, CIDEB, LEUTX, VAV1, C12orf65, C21orf33, C6orf203, GFM1, MDH2, METTL17, MTIF2, NGRN, PMPCB, TRUB2, VWA8, DDX39A, MRPL18, MRPL53, ABT1, MALSU1, GNL3, RPL7A, FAM120A, SRSF3, LIN28A, H1FNT, MRPL52, LIN28B, MRPL2, RBMS2, HNRNPU, GLI4, PRR3, MRPL30, MRPL13, RPL37, YBX2, YBX1, HIST1H2AE, ZC3H3, RPS6, RPL13A, RPL10, RPL19, FAHD1, RPL17, RPL23A, ZNF574, MRPL23, MRPS18A, MRPL46, MRPL37, FTL, GADD45GIP1, MRPL51, |
Top |
|
| Clinically associated variants from ClinVar. |
| Gene | Chr | Position | RefSeq | VarSeq | RefSeeq | VarType | Pathogenic | Disease | VarInfo |
| nsSNVs with sample frequency (size of circle) from TCGA 33 cancers. |
| SNVs and Indels |
| Gene | Cancer type | Chromosome | Start | End | RefSeeq | MutSeq | Mutation type | AAchange | # samples |
| Copy number variation (CNV) of MRPL57 * Click on the image to open the original image in a new window. |
 |
| Fusion gene breakpoints (product of the structural variants (SVs)) across MRPL57 * Click on the image to open the UCSC genome browser with custom track showing this image in a new window. |
 |
| Fusion genes with this translation factor from FusionGDB2.0. |
| FusionGDB2 ID | Disease | Sample | Hgene | Hchr | Hbp | Hstrand | Tgene | Tchr | Tbp | Tstrand |
Top |
|
| Kaplan-Meier plots with logrank tests of overall survival (OS) |
| Cancer type | Translation factor | Coefficent | Hazard ratio | Wald test pval | Likelihool ratio pval | Logrank test pval | # samples |
Top |
|
| Differential gene expression between female and male. (Wilcoxon test, pval<0.05) |
| Cancer type | Translation factor | pval | adj.p |
Top |
|
| Differential gene expression between young and old age groups (Wilcoxon test, pval<0.05) |
| Cancer type | Translation factor | pval | adj.p |
Top |
|
| Drugs targeting genes involved in this translation factor. (DrugBank Version 5.1.8 2021-05-08) |
| UniProtAcc | DrugBank ID | Drug name | Drug activity | Drug type | Drug status |
Top |
|
| Diseases associated with this translation factor. (DisGeNet 4.0) |
| Disease ID | Disease Name | # PubMeds | Disease source |
(UTHealth)
Web File Viewing | Emergency Information |Campus Carry|Site Policies