
|
||||||
|

Translation Factor: EIF1AD (NCBI Gene ID:84285) |
|
 Gene Summary Gene Summary |
| Gene Information | Gene Name: EIF1AD | Gene ID: 84285 | Gene Symbol | EIF1AD | Gene ID | 84285 |
| Gene Name | eukaryotic translation initiation factor 1A domain containing | |
| Synonyms | OBELIX|haponin | |
| Cytomap | 11q13.1 | |
| Type of Gene | protein-coding | |
| Description | probable RNA-binding protein EIF1ADeukaryotic translation initiation factor 1A domain-containing protein | |
| Modification date | 20200313 | |
| UniProtAcc | Q8N9N8 | |
| Child GO biological process term(s) under GO:0006412 |
| GO ID | GO term |
| GO:0006417 | Regulation of translation |
| GO:0008135 | Translation factor activity, RNA binding |
| GO:0006413 | Translational initiation |
| GO:0006412 | Translation |
| Gene ontology of translaction factor with evidence of Inferred from Direct Assay (IDA) from Entrez |
| Partner | Gene | GO ID | GO term | PubMed ID |
| Inferred gene age of translation factor. |
| Gene | Inferred gene age group among (0 - 67.6], (67.6 - 355.7], (355.7 - 733], (733 - 1119.25], >1119.25 |
| EIF1AD | >1119.25 |
Top |
|
| We searched PubMed using 'EIF1AD[title] AND translation [title] AND human.' |
| Gene | Title | PMID |
| EIF1AD | . | . |
Top |
|
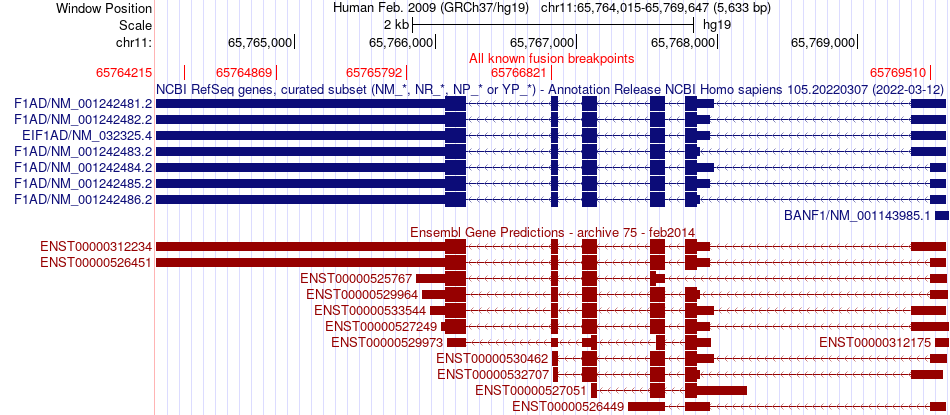
| Skipped exons in TCGA and GTEx based on Ensembl gene isoform structure. * Click on the image to open the UCSC genome browser with custom track showing this image in a new window. For more annotations, please visit our ExonSkipDB. |
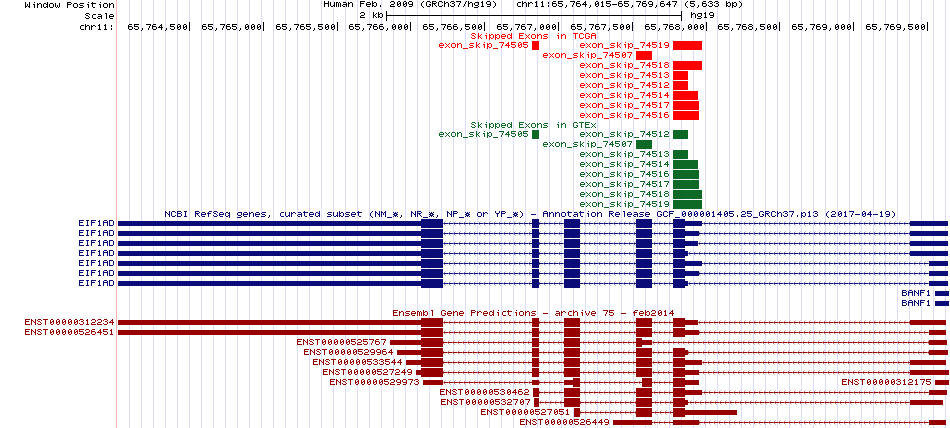 |
| Open reading frame (ORF) analsis of exon skipping events based on Ensembl gene isoform structure. * Click on the break point to see the gene structure around the break point region using the UCSC Genome Browser. |
| ENST | Exon skip start (DNA) | Exon Skip end (DNA) | ORF |
| ENST00000312234 | 65766820 | 65766868 | In-frame |
| ENST00000526451 | 65766820 | 65766868 | In-frame |
| ENST00000527249 | 65766820 | 65766868 | In-frame |
| ENST00000529964 | 65766820 | 65766868 | In-frame |
| ENST00000533544 | 65766820 | 65766868 | In-frame |
| ENST00000312234 | 65767773 | 65767947 | 3UTR-3CDS |
| ENST00000527249 | 65767773 | 65767952 | 3UTR-3CDS |
| ENST00000529964 | 65767773 | 65767877 | 3UTR-3CDS |
| ENST00000533544 | 65767773 | 65767976 | 3UTR-3CDS |
| Exon skipping position in the amino acid sequence. |
| ENST | Exon skip start (DNA) | Exon Skip end (DNA) | Len(transcript seq) | Exon skip start (mRNA) | Exon Skip end (mRNA) | Len(amino acid seq) | Exon skip start (AA) | Exon Skip end (AA) |
| ENST00000529964 | 65766820 | 65766868 | 825 | 450 | 497 | 165 | 102 | 117 |
| ENST00000527249 | 65766820 | 65766868 | 906 | 665 | 712 | 165 | 102 | 117 |
| ENST00000533544 | 65766820 | 65766868 | 982 | 667 | 714 | 165 | 102 | 117 |
| ENST00000526451 | 65766820 | 65766868 | 2778 | 515 | 562 | 165 | 102 | 117 |
| ENST00000312234 | 65766820 | 65766868 | 2904 | 641 | 688 | 165 | 102 | 117 |
| Potentially (partially) lost protein functional features of UniProt. |
| UniProtAcc | Exon skip start (AA) | Exon Skip end (AA) | Function feature start (AA) | Function feature end (AA) | Functional feature type | Functional feature desc. |
| Q8N9N8 | 102 | 117 | 1 | 165 | Chain | ID=PRO_0000314151;Note=Probable RNA-binding protein EIF1AD |
| Q8N9N8 | 102 | 117 | 1 | 165 | Chain | ID=PRO_0000314151;Note=Probable RNA-binding protein EIF1AD |
| Q8N9N8 | 102 | 117 | 1 | 165 | Chain | ID=PRO_0000314151;Note=Probable RNA-binding protein EIF1AD |
| Q8N9N8 | 102 | 117 | 1 | 165 | Chain | ID=PRO_0000314151;Note=Probable RNA-binding protein EIF1AD |
| Q8N9N8 | 102 | 117 | 1 | 165 | Chain | ID=PRO_0000314151;Note=Probable RNA-binding protein EIF1AD |
| Q8N9N8 | 102 | 117 | 104 | 110 | Helix | Ontology_term=ECO:0000244;evidence=ECO:0000244|PDB:2DGY |
| Q8N9N8 | 102 | 117 | 104 | 110 | Helix | Ontology_term=ECO:0000244;evidence=ECO:0000244|PDB:2DGY |
| Q8N9N8 | 102 | 117 | 104 | 110 | Helix | Ontology_term=ECO:0000244;evidence=ECO:0000244|PDB:2DGY |
| Q8N9N8 | 102 | 117 | 104 | 110 | Helix | Ontology_term=ECO:0000244;evidence=ECO:0000244|PDB:2DGY |
| Q8N9N8 | 102 | 117 | 104 | 110 | Helix | Ontology_term=ECO:0000244;evidence=ECO:0000244|PDB:2DGY |
Top |
|
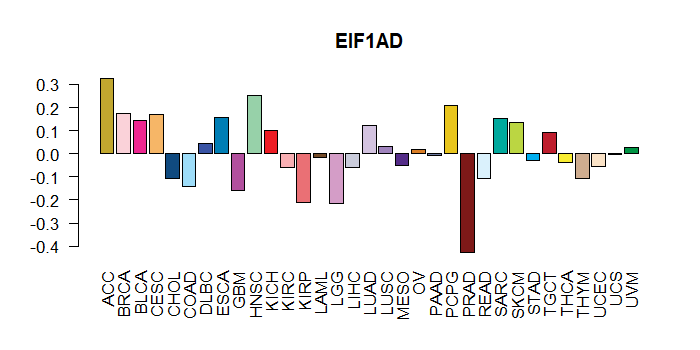
| Gene expression level across TCGA pancancer |
 |
| Gene expression level across GTEx pantissue |
 |
| Expression level of gene isoforms across TCGA pancancer |
 |
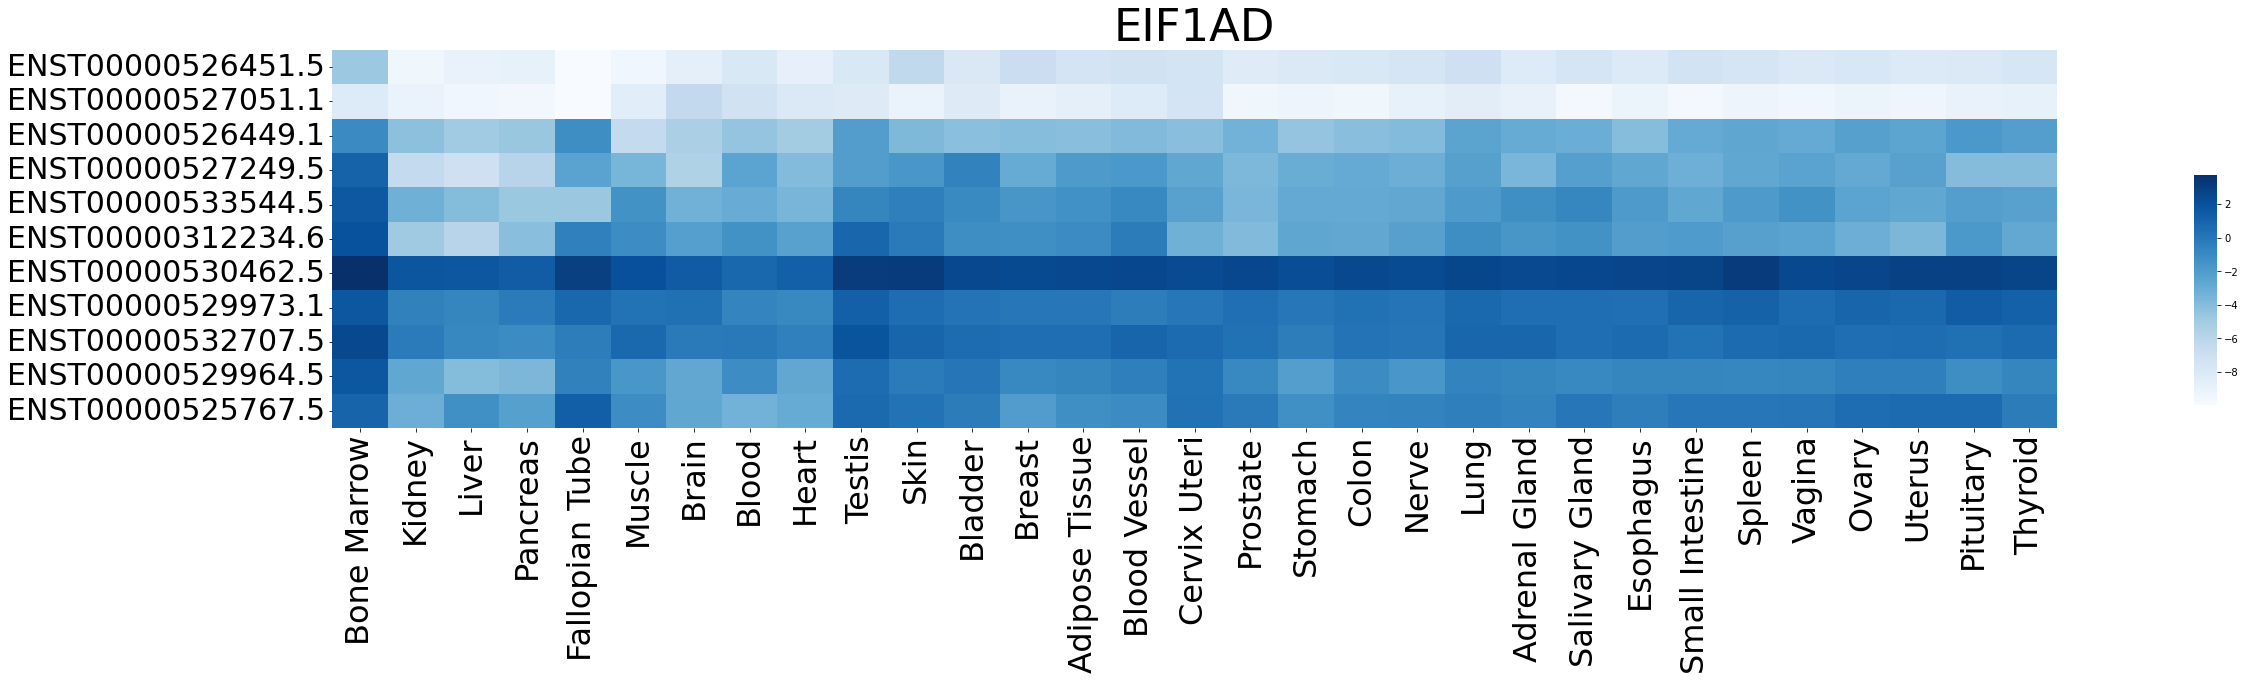
| Expression level of gene isoforms across GTEx pantissue |
 |
| Cancer(tissue) type-specific expression level of Translation factor using z-score distriution |
 |
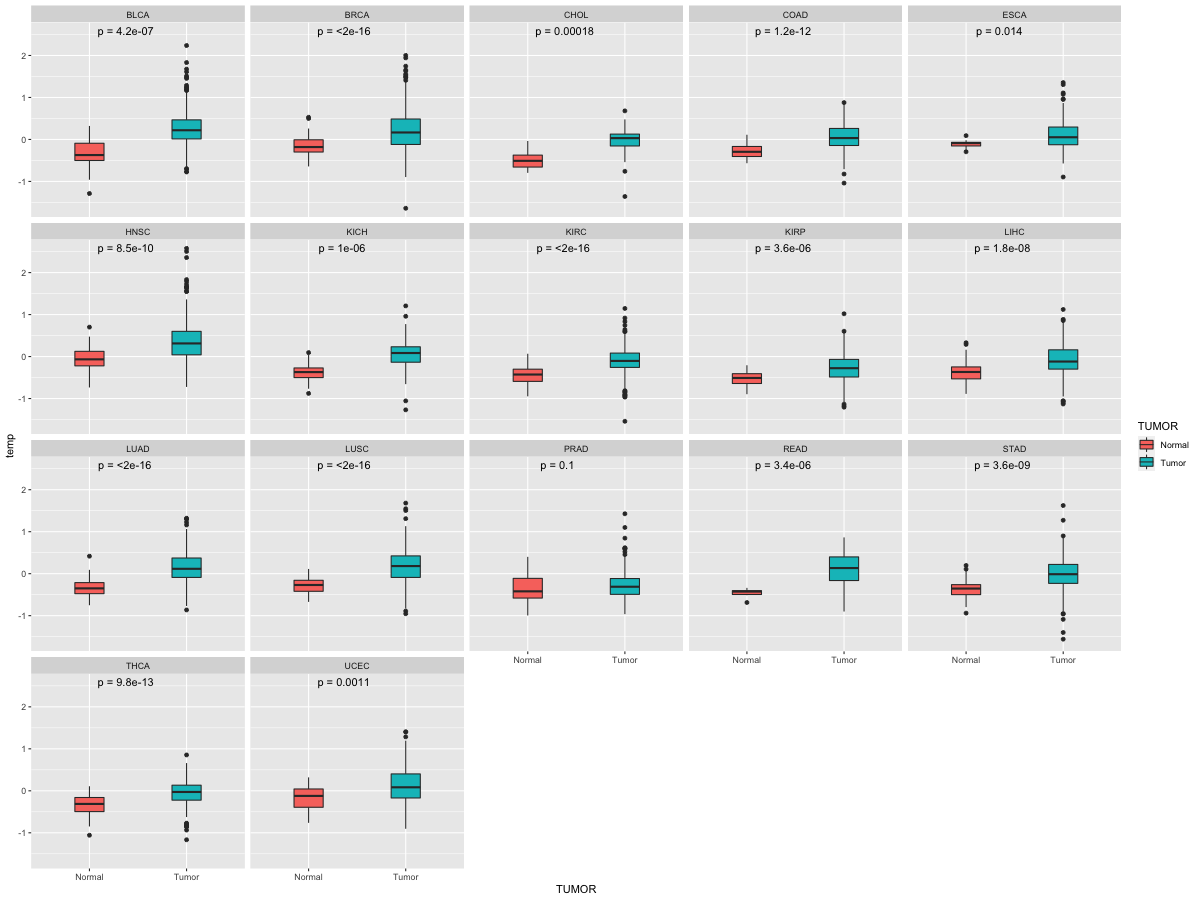
| Differential expression between tumor and matched normal (in the cancer types with more than 10 matched samples) |
 |
| Cancer type | Translation factor | FC | adj.pval |
| LIHC | EIF1AD | -1.65012204005365 | 0.000117320704426747 |
| CHOL | EIF1AD | -3.62190257170509 | 0.01171875 |
| STAD | EIF1AD | -3.23866252215241 | 5.4334755986929e-05 |
| KIRC | EIF1AD | -1.77843667843124 | 6.13619476098216e-10 |
Top |
|
| Translation factor expression regulation through miRNA binding |
| Cancer type | Gene | miRNA | TargetScan binding score (Context++ score percentile) | Coefficient | Pvalue |
| UCS | EIF1AD | hsa-miR-206 | 93 | 0.406766917293233 | 0.00201819928268806 |
| Translation factor expression regulation through methylation in the promoter of Translation factor |
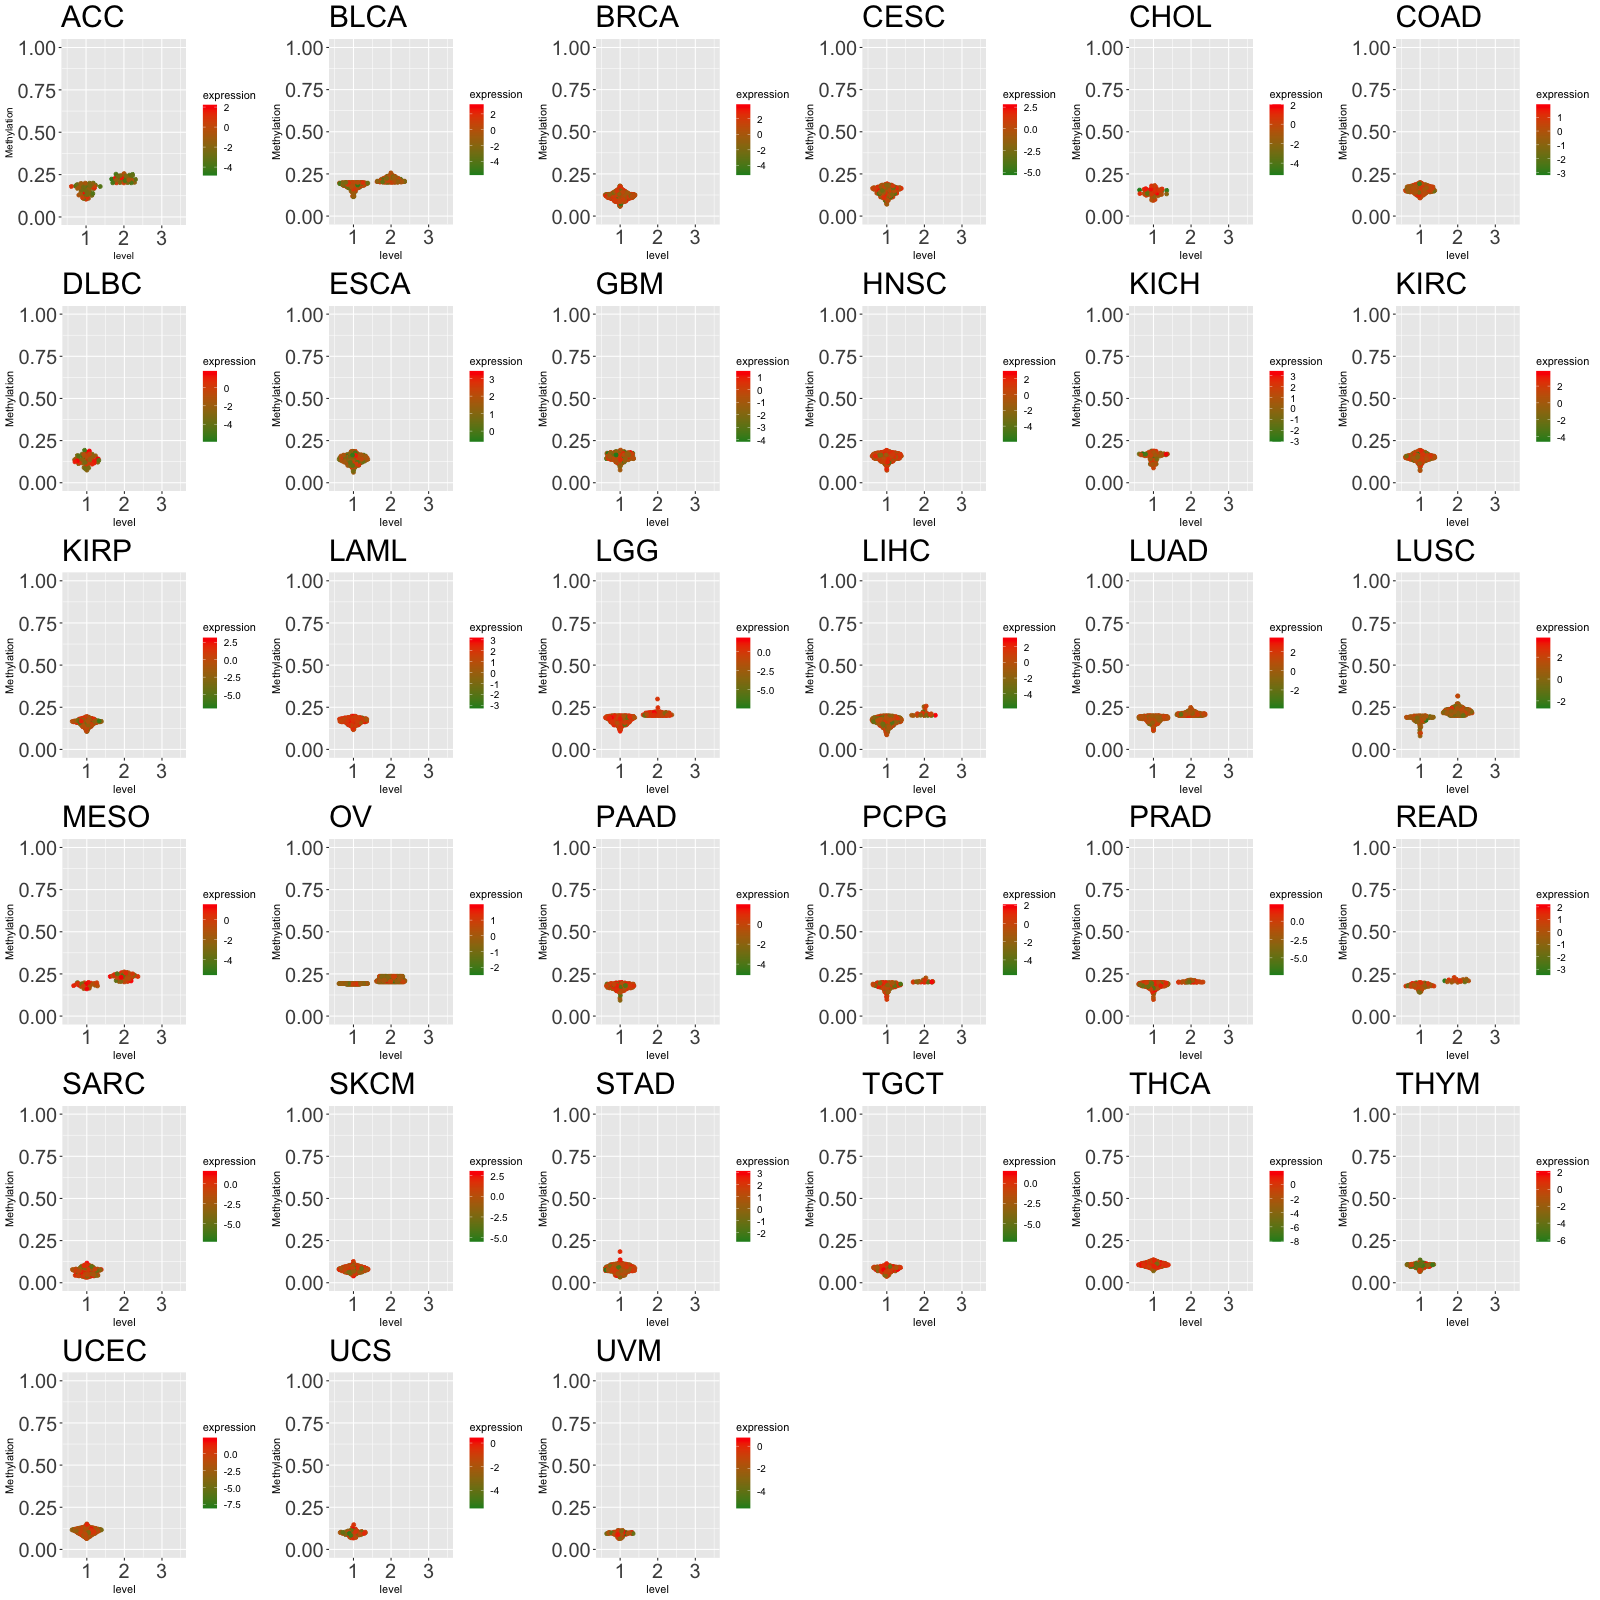 |
| Cancer type | Gene | methyl group b | methyl group a | DEG pval | avg methyl in b | avg methyl in a | avg exp in b | avg exp in a |
| Translation factor expression regulation through methylation in the gene body of Translation factor (positive regulation) |
 |
| Cancer type | Gene | methyl group b | methyl group a | DEG pval | avg methyl in b | avg methyl in a | avg exp in b | avg exp in a |
| Translation factor expression regulation through copy number variation of Translation factor |
 |
| Cancer type | Gene | Coefficient | Pvalue |
| HNSC | EIF1AD | -0.149637115 | 0.011457252 |
| OV | EIF1AD | -0.102929092 | 0.026175937 |
| COAD | EIF1AD | 0.029927644 | 0.02975498 |
Top |
|
| Strongly correlated genes belong to cellular important gene groups with EIF1AD (coefficient>0.8, pval<0.05, node color based on FC between tumor and matched normal). Significantly associated important genes in the individual cancer types. * Cell metabolism gene: cell metabolism genes from REACTOME (black edge), IUPHAR: drug target genes from IUPHAR (blue edge), Kinase: human kinase genes (brown edge), CGC: cancer gene census genes (orange edge), TSG: tumor suppresor genes (purple edge), Epifactor: epigenetic factors (light blue edge), TF: transcription factors (green) |
| Cancer type | Gene group | Translation factor | Correlated gene | Coefficient | Pvalue |
Top |
|
| Protein 3D structure Visit iCn3D. |
Top |
|
| Protein-protein interaction networks * Overlap between up-regulated DEGs (log2FC<-1 and adj.P<0.05) and STRING PPI network (center: Translation factor, node: DEGs, edges: weighted by -log2(adj.P)) |
 |
| Overlap between down-regulated DEGs (log2FC>1 and adj.P<0.05) and STRING PPI network (center: Translation factor, node: DEGs, edges: weighted by -log2(adj.P)) |
 |
 * Edge colors based on TCGA cancer types. |
| * Overlap between DEGs (log2FC>1 and adj.P<0.05) and STRING PPI network per cancer (center: Translation factor, node: DEGs, node color: log2FC, edges: weighted by -log2(adj.P)) |
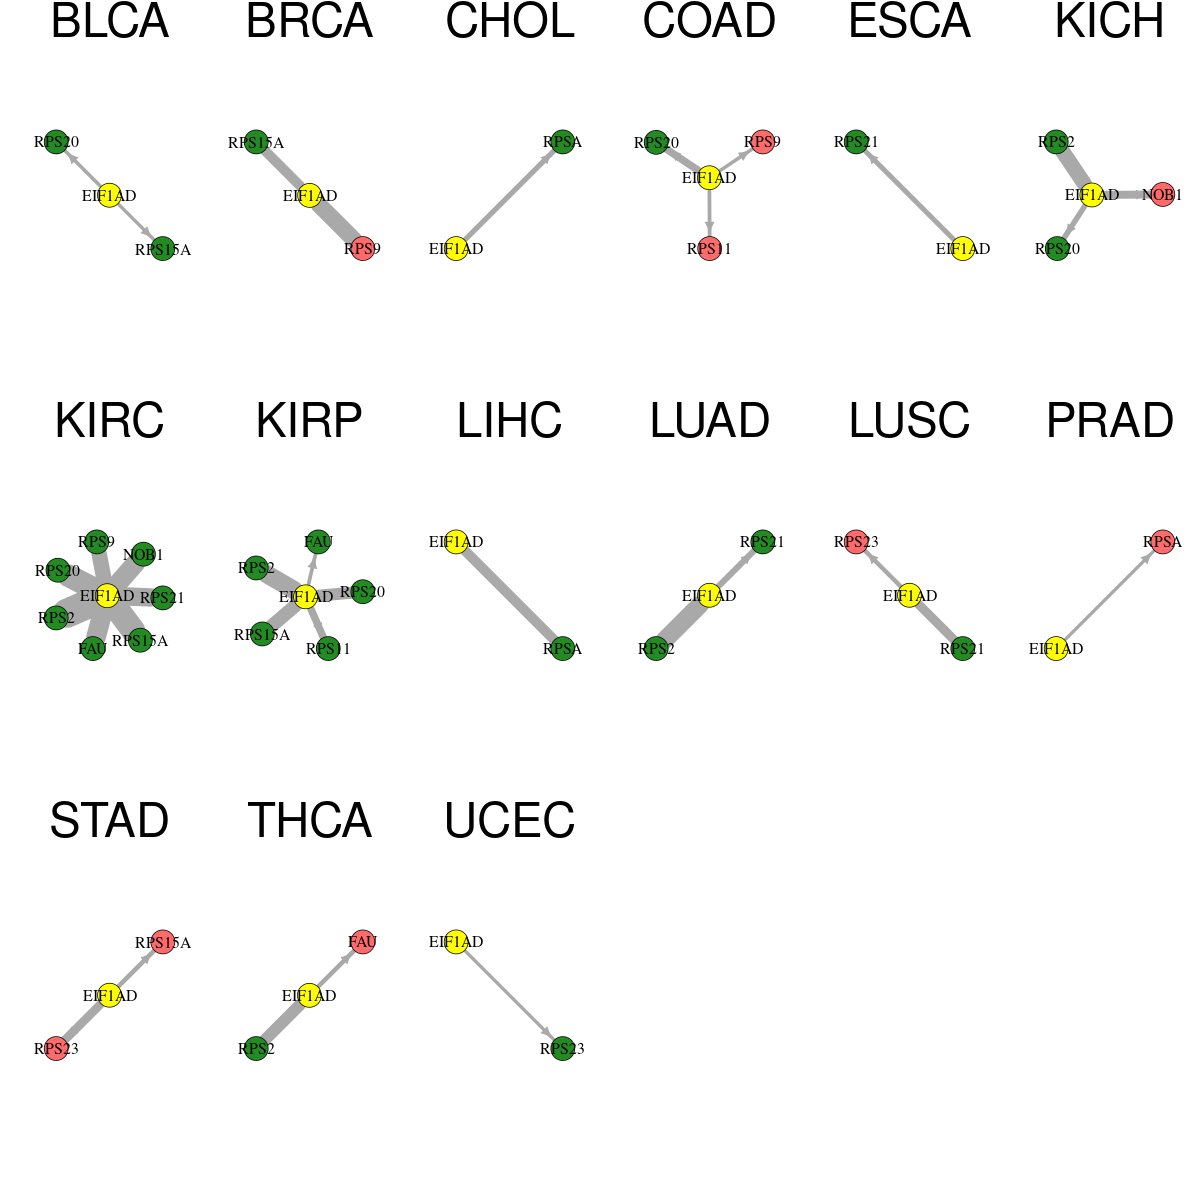 |
| Cancer type | Translation factor | Interacting protein coding gene | FC | adj.pval |
| LIHC | EIF1AD | RPSA | -2.66181804625988 | 0.00010013220697745 |
| BRCA | EIF1AD | RPS15A | -1.39403174309699 | 0.000110797167056844 |
| LUSC | EIF1AD | RPS21 | -3.86646295834554 | 0.000217448138016549 |
| STAD | EIF1AD | RPS23 | 1.85076760664576 | 0.000364991836249828 |
| KICH | EIF1AD | NOB1 | 1.35676719277562 | 0.000631332397460937 |
| COAD | EIF1AD | RPS20 | -3.55214827660447 | 0.0010443925857544 |
| KIRP | EIF1AD | RPS11 | -1.01861570565103 | 0.00105937570333481 |
| LUAD | EIF1AD | RPS21 | -2.06355209027984 | 0.00342681008979313 |
| KICH | EIF1AD | RPS20 | -2.30757233561727 | 0.00612920522689819 |
| CHOL | EIF1AD | RPSA | -1.88501253711962 | 0.0078125 |
| ESCA | EIF1AD | RPS21 | -3.39437219011366 | 0.009765625 |
| STAD | EIF1AD | RPS15A | 1.10140997786082 | 0.0148032568395138 |
| THCA | EIF1AD | FAU | 1.18509450470262 | 0.0152379297688856 |
| LUSC | EIF1AD | RPS23 | 1.46751169891047 | 0.0174932185880974 |
| KIRP | EIF1AD | FAU | -1.04355048353271 | 0.0309218638576567 |
| COAD | EIF1AD | RPS11 | 1.35307548998204 | 0.0312207043170929 |
| BLCA | EIF1AD | RPS20 | -3.2869410015055 | 0.0360679626464844 |
| COAD | EIF1AD | RPS9 | 1.18612014402235 | 0.0381683111190796 |
| BLCA | EIF1AD | RPS15A | -3.67919690742966 | 0.0445594787597656 |
| UCEC | EIF1AD | RPS23 | -2.03658159814007 | 0.046875 |
| PRAD | EIF1AD | RPSA | 1.15183588990872 | 0.0476188245531179 |
| KIRC | EIF1AD | FAU | -2.50135425883801 | 1.33253564327251e-08 |
| KIRP | EIF1AD | RPS20 | -1.44580921357944 | 1.60322524607182e-05 |
| THCA | EIF1AD | RPS2 | -2.9749691422722 | 1.8399565126656e-05 |
| KIRC | EIF1AD | RPS15A | -4.14252623992016 | 2.15831756070263e-10 |
| KIRC | EIF1AD | RPS2 | -3.31623058345719 | 2.17100738110179e-12 |
| KIRC | EIF1AD | NOB1 | -1.76222058371577 | 2.17245182514006e-08 |
| BRCA | EIF1AD | RPS9 | 1.9331477546349 | 2.31299392089389e-07 |
| KIRP | EIF1AD | RPS15A | -1.51145101417385 | 4.02145087718964e-06 |
| KIRC | EIF1AD | RPS21 | -1.2222651512906 | 4.25761914751048e-08 |
| KIRP | EIF1AD | RPS2 | -2.72788021566791 | 5.12227416038514e-08 |
| LUAD | EIF1AD | RPS2 | -2.88992098496468 | 6.51132046672323e-08 |
| KIRC | EIF1AD | RPS9 | -1.32680816440987 | 6.53264115309597e-07 |
| KIRC | EIF1AD | RPS20 | -2.62380824779569 | 7.86590430905899e-10 |
| KICH | EIF1AD | RPS2 | -4.73426315307469 | 8.34465026855468e-07 |
| Protein-protein interactors with this translation factor (BIOGRID-3.4.160) |
| PPI interactors with EIF1AD |
| STAT1, ELAVL1, MEOX2, SDCBP, ZBTB14, STX11, TBC1D5, SDCBP2, CEP55, GLYR1, BEND7, ZBTB8A, MOV10, NXF1, DPPA2, HBS1L, KRAS, PAX6, LNX1, MID2, PICK1, CEP76, AES, PBX4, MREG, RBM48, GAS8, RBAK, TNNI1, AP2M1, ENTHD2, ZNF558, GCSAML, ZNF280A, CCDC106, RASSF10, ZNF521, GTF2H4, PINX1, KDM8, ATG3, MAP4K5, CAMKV, POLD2, CARKD, MID1, DIP2B, GATA6, HEXIM1, HOXB9, ARRB2, CD3EAP, CSNK1G3, LRRC47, MGME1, CSNK1E, GRK6, PDCD2L, MPP6, CHEK1, RBPJ, GNB1L, IP6K1, PSMC3IP, TRMT61B, RNF138, TRMT1L, MND1, UTP6, DUS3L, ECT2, POLR1E, MCAT, KLHL42, WDR45B, AMPD2, DLG3, TBC1D23, ISL2, HNRNPLL, CASK, CTC1, OBFC1, SNX27, MTERF1, SCLY, |
Top |
|
| Clinically associated variants from ClinVar. |
| Gene | Chr | Position | RefSeq | VarSeq | RefSeeq | VarType | Pathogenic | Disease | VarInfo |
| nsSNVs with sample frequency (size of circle) from TCGA 33 cancers. |
 |
| SNVs and Indels |
| Gene | Cancer type | Chromosome | Start | End | RefSeeq | MutSeq | Mutation type | AAchange | # samples |
| EIF1AD | BRCA | chr11 | 65767848 | 65767848 | T | C | Missense_Mutation | p.T5A | 3 |
| EIF1AD | STAD | chr11 | 65767122 | 65767122 | A | G | Missense_Mutation | p.I74T | 2 |
| EIF1AD | STAD | chr11 | 65767776 | 65767776 | T | C | Missense_Mutation | p.R29G | 2 |
| EIF1AD | KIRP | chr11 | 65767117 | 65767117 | C | A | Nonsense_Mutation | 2 | |
| EIF1AD | LIHC | chr11 | 65766855 | 65766855 | A | G | Missense_Mutation | 2 | |
| EIF1AD | STAD | chr11 | 65767548 | 65767548 | G | A | Missense_Mutation | 2 | |
| EIF1AD | STAD | chr11 | 65767548 | 65767548 | G | A | Missense_Mutation | p.R58C | 2 |
| EIF1AD | LUAD | chr11 | 65767113 | 65767113 | C | T | Missense_Mutation | p.G77E | 1 |
| EIF1AD | CHOL | chr11 | 65767103 | 65767103 | C | T | Silent | p.V80V | 1 |
| EIF1AD | LUAD | chr11 | 65766116 | 65766116 | T | A | Missense_Mutation | p.Q151L | 1 |
| EIF1AD | CHOL | chr11 | 65767103 | 65767103 | C | T | Silent | 1 | |
| EIF1AD | LUAD | chr11 | 65766820 | 65766820 | C | A | Splice_Site | 1 | |
| EIF1AD | DLBC | chr11 | 65767578 | 65767578 | G | A | Missense_Mutation | p.R48C | 1 |
| EIF1AD | LUSC | chr11 | 65767582 | 65767582 | C | T | Silent | p.G46G | 1 |
| EIF1AD | HNSC | chr11 | 65766195 | 65766195 | G | A | Missense_Mutation | 1 | |
| EIF1AD | LUSC | chr11 | 65767038 | 65767038 | C | A | Missense_Mutation | p.W102_splice | 1 |
| EIF1AD | HNSC | chr11 | 65766195 | 65766195 | G | A | Missense_Mutation | p.P125S | 1 |
| EIF1AD | LUSC | chr11 | 65766854 | 65766854 | G | T | Missense_Mutation | p.S107Y | 1 |
| EIF1AD | PAAD | chr11 | 65767794 | 65767794 | C | A | Missense_Mutation | 1 | |
| EIF1AD | LGG | chr11 | 65766122 | 65766122 | C | T | Missense_Mutation | p.R149H | 1 |
| EIF1AD | PRAD | chr11 | 65767617 | 65767617 | C | A | Translation_Start_Site | 1 | |
| EIF1AD | SKCM | chr11 | 65766099 | 65766099 | C | T | Missense_Mutation | p.E157K | 1 |
| EIF1AD | LIHC | chr11 | 65767088 | 65767088 | C | T | Silent | p.S85S | 1 |
| EIF1AD | LIHC | chr11 | 65767798 | 65767798 | G | - | Frame_Shift_Del | p.P21fs | 1 |
| Copy number variation (CNV) of EIF1AD * Click on the image to open the original image in a new window. |
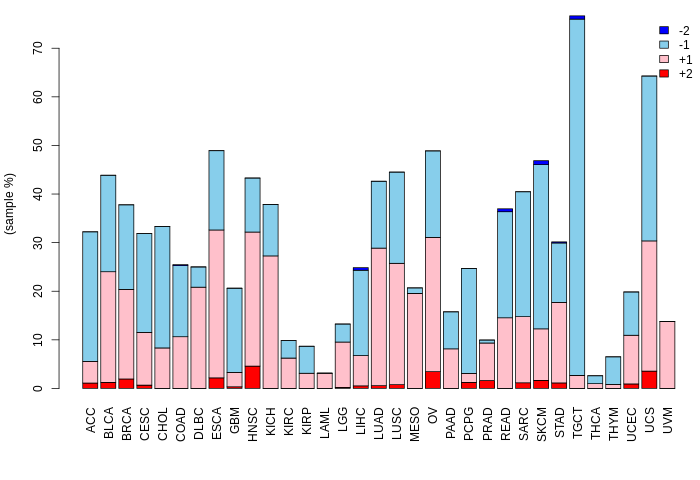 |
| Fusion gene breakpoints (product of the structural variants (SVs)) across EIF1AD * Click on the image to open the UCSC genome browser with custom track showing this image in a new window. |
 |
| Fusion genes with this translation factor from FusionGDB2.0. |
| FusionGDB2 ID | Disease | Sample | Hgene | Hchr | Hbp | Hstrand | Tgene | Tchr | Tbp | Tstrand |
| 25620 | LIHC | TCGA-DD-AADB-01A | EIF1AD | chr11 | 65766821 | - | CATSPER1 | chr11 | 65784645 | - |
| 25620 | N/A | BF515226 | EIF1AD | chr11 | 65764215 | + | EIF1AD | chr11 | 65765792 | - |
| 72495 | STAD | TCGA-BR-7958 | EIF1AD | chr11 | 65769510 | - | NECAP2 | chr1 | 16778332 | + |
Top |
|
| Kaplan-Meier plots with logrank tests of overall survival (OS) |
 |
| Cancer type | Translation factor | Coefficent | Hazard ratio | Wald test pval | Likelihool ratio pval | Logrank test pval | # samples |
Top |
|
| Differential gene expression between female and male. (Wilcoxon test, pval<0.05) |
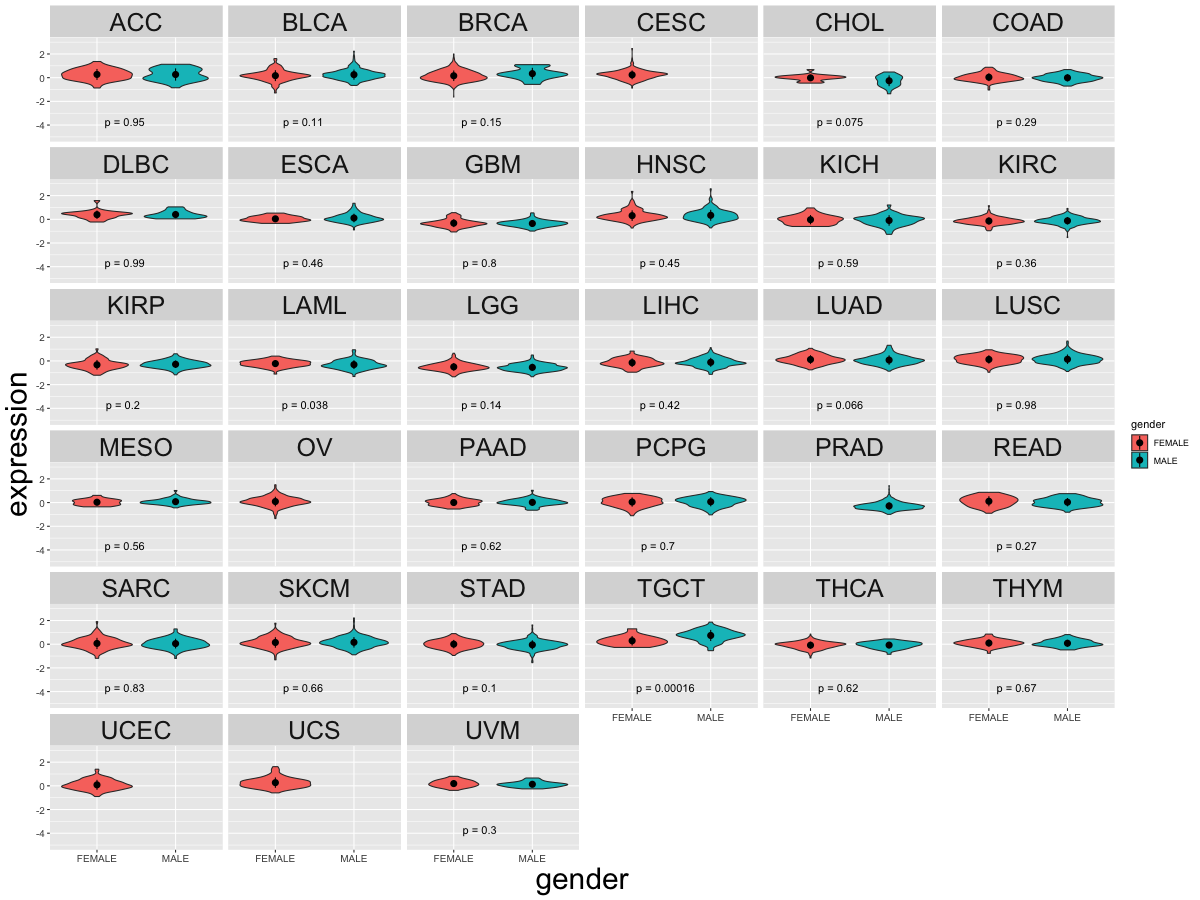 |
| Cancer type | Translation factor | pval | adj.p |
| TGCT | EIF1AD | 0.000159116802979966 | 0.0045 |
| LAML | EIF1AD | 0.0384216200527988 | 1 |
Top |
|
| Differential gene expression between young and old age groups (Wilcoxon test, pval<0.05) |
 |
| Cancer type | Translation factor | pval | adj.p |
| LUAD | EIF1AD | 0.000635936204912317 | 0.021 |
| KICH | EIF1AD | 0.0156830682385602 | 0.47 |
| LGG | EIF1AD | 0.0062731892057083 | 0.2 |
| UCEC | EIF1AD | 0.00679392564630236 | 0.21 |
| HNSC | EIF1AD | 0.0276625166618021 | 0.8 |
Top |
|
| Drugs targeting genes involved in this translation factor. (DrugBank Version 5.1.8 2021-05-08) |
| UniProtAcc | DrugBank ID | Drug name | Drug activity | Drug type | Drug status |
Top |
|
| Diseases associated with this translation factor. (DisGeNet 4.0) |
| Disease ID | Disease Name | # PubMeds | Disease source |
| C0025202 | melanoma | 1 | CTD_human |
(UTHealth)
Web File Viewing | Emergency Information |Campus Carry|Site Policies