
|
||||||
|

Translation Factor: MRPL43 (NCBI Gene ID:84545) |
|
 Gene Summary Gene Summary |
| Gene Information | Gene Name: MRPL43 | Gene ID: 84545 | Gene Symbol | MRPL43 | Gene ID | 84545 |
| Gene Name | mitochondrial ribosomal protein L43 | |
| Synonyms | L43mt|MRP-L43|bMRP36a | |
| Cytomap | 10q24.31 | |
| Type of Gene | protein-coding | |
| Description | 39S ribosomal protein L43, mitochondrialmitochondrial large ribosomal subunit protein mL43mitochondrial ribosomal protein bMRP36a | |
| Modification date | 20200320 | |
| UniProtAcc | Q8N983 | |
| Child GO biological process term(s) under GO:0006412 |
| GO ID | GO term |
| GO:0005840 | Ribosome |
| GO:0006412 | Translation |
| Gene ontology of translaction factor with evidence of Inferred from Direct Assay (IDA) from Entrez |
| Partner | Gene | GO ID | GO term | PubMed ID |
| Inferred gene age of translation factor. |
| Gene | Inferred gene age group among (0 - 67.6], (67.6 - 355.7], (355.7 - 733], (733 - 1119.25], >1119.25 |
Top |
|
| We searched PubMed using 'MRPL43[title] AND translation [title] AND human.' |
| Gene | Title | PMID |
| MRPL43 | . | . |
Top |
|
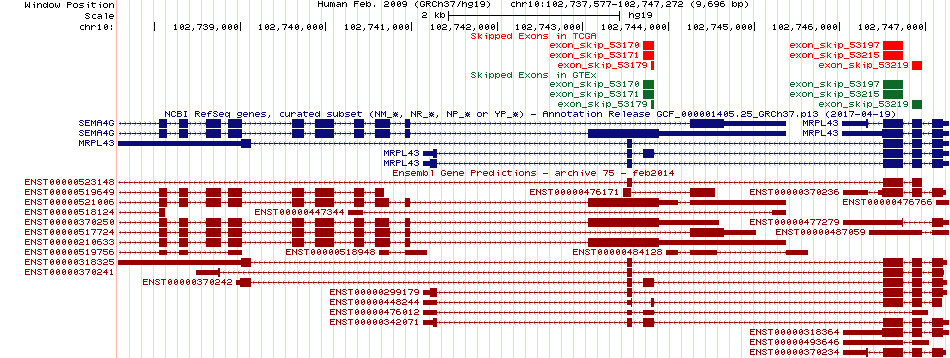
| Skipped exons in TCGA and GTEx based on Ensembl gene isoform structure. * Click on the image to open the UCSC genome browser with custom track showing this image in a new window. For more annotations, please visit our ExonSkipDB. |
 |
| Open reading frame (ORF) analsis of exon skipping events based on Ensembl gene isoform structure. * Click on the break point to see the gene structure around the break point region using the UCSC Genome Browser. |
| ENST | Exon skip start (DNA) | Exon Skip end (DNA) | ORF |
| ENST00000318325 | 102746505 | 102746732 | Frame-shift |
| ENST00000318325 | 102746846 | 102746953 | Frame-shift |
| Exon skipping position in the amino acid sequence. |
| ENST | Exon skip start (DNA) | Exon Skip end (DNA) | Len(transcript seq) | Exon skip start (mRNA) | Exon Skip end (mRNA) | Len(amino acid seq) | Exon skip start (AA) | Exon Skip end (AA) |
| Potentially (partially) lost protein functional features of UniProt. |
| UniProtAcc | Exon skip start (AA) | Exon Skip end (AA) | Function feature start (AA) | Function feature end (AA) | Functional feature type | Functional feature desc. |
Top |
|
| Gene expression level across TCGA pancancer |
 |
| Gene expression level across GTEx pantissue |
 |
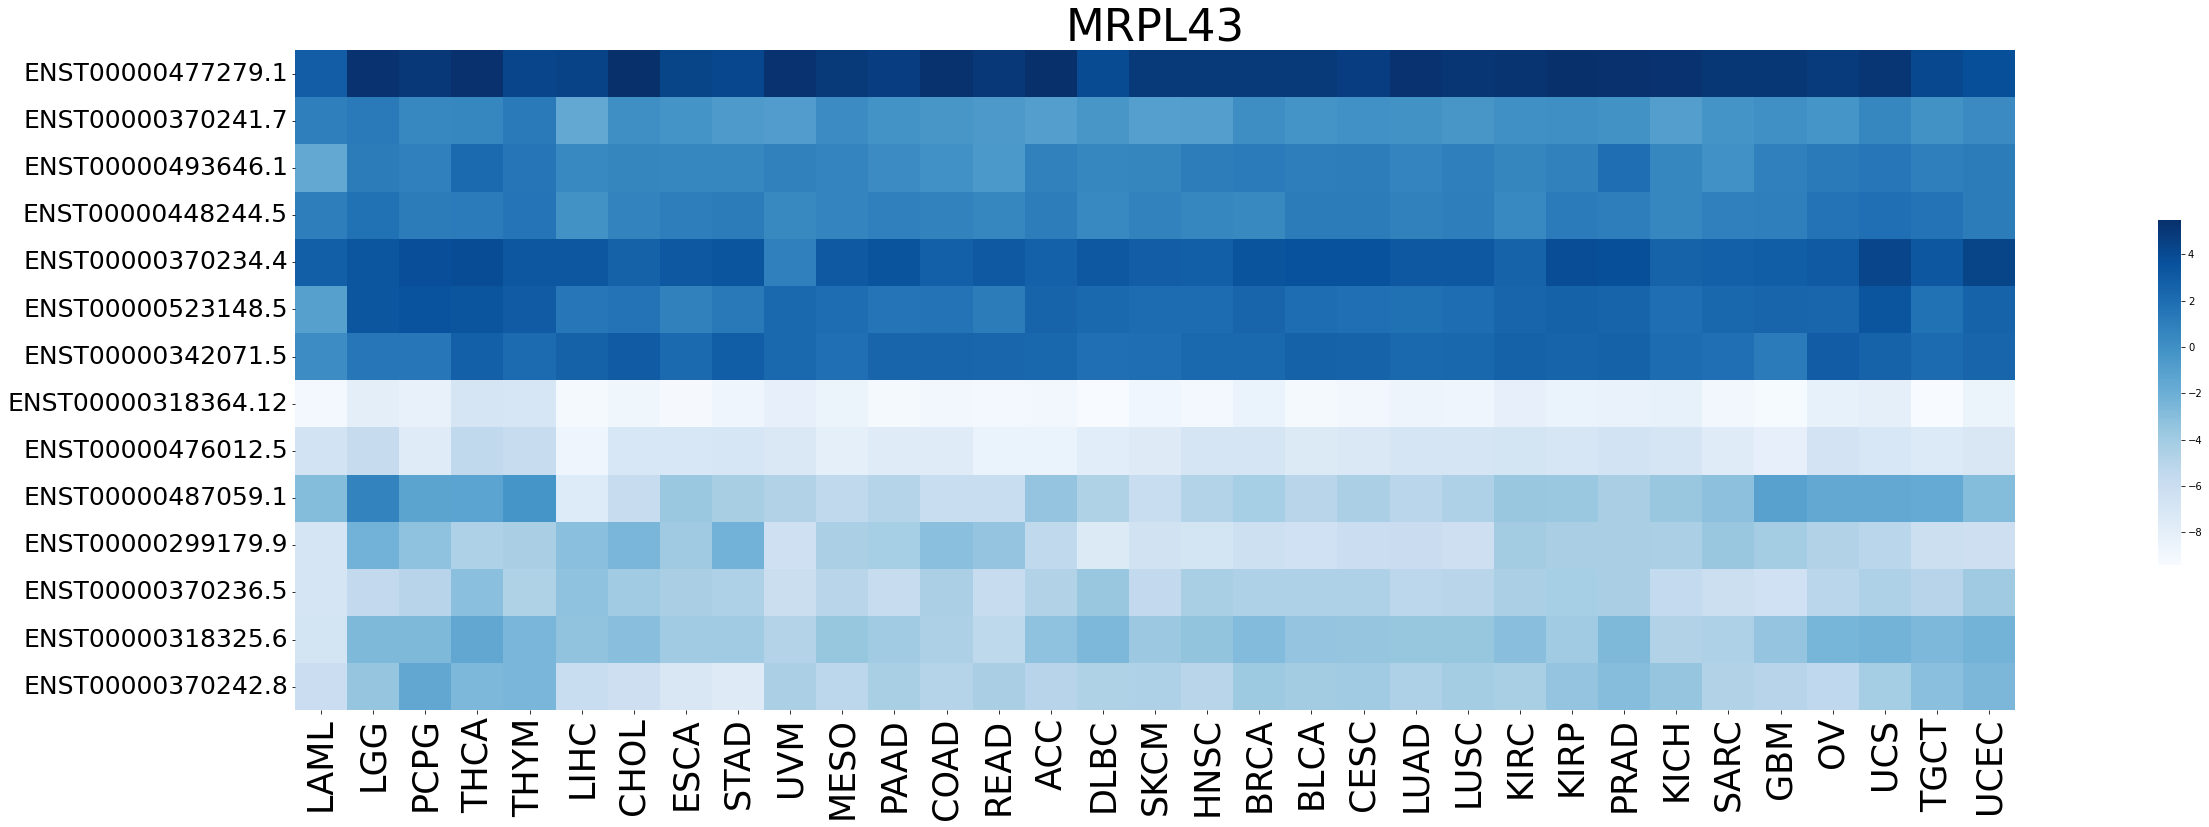
| Expression level of gene isoforms across TCGA pancancer |
 |
| Expression level of gene isoforms across GTEx pantissue |
 |
| Cancer(tissue) type-specific expression level of Translation factor using z-score distriution |
 |
| Differential expression between tumor and matched normal (in the cancer types with more than 10 matched samples) |
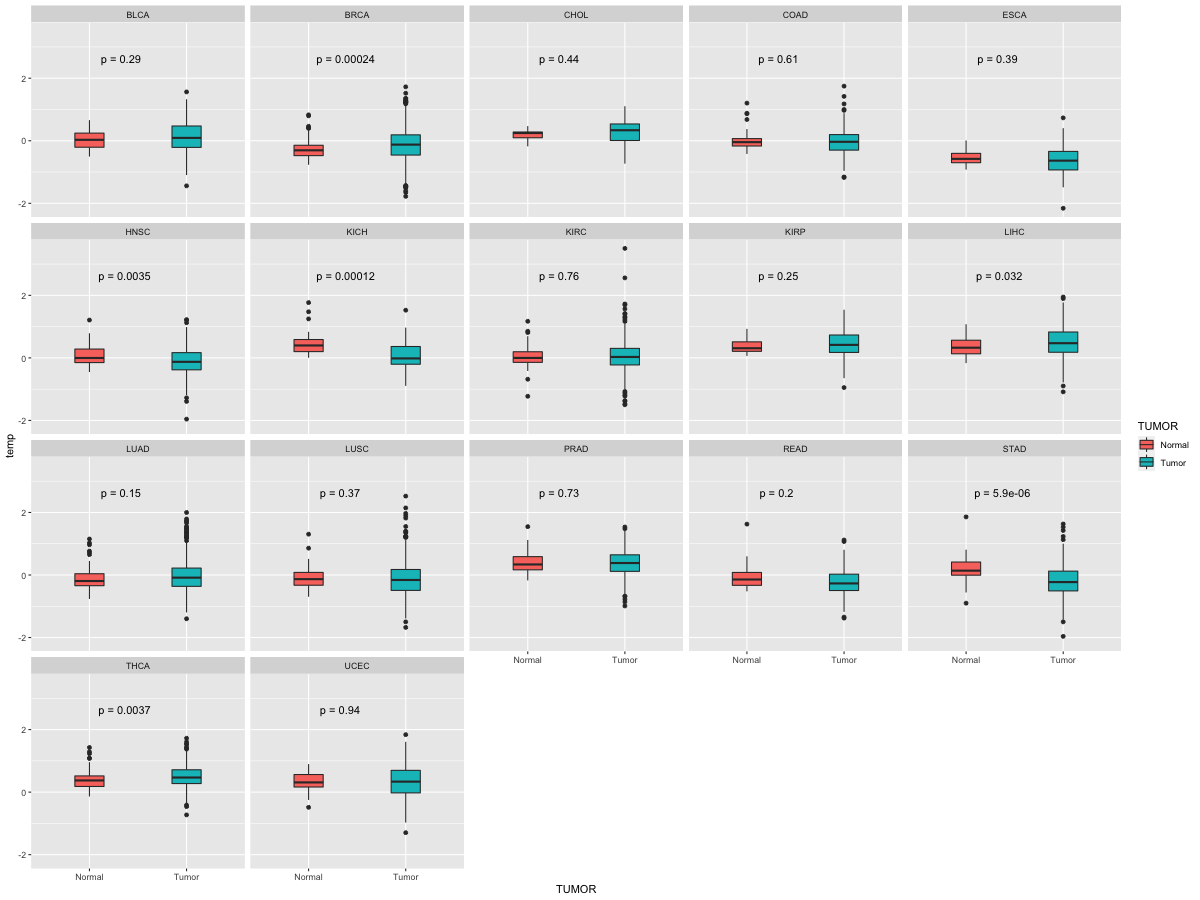 |
| Cancer type | Translation factor | FC | adj.pval |
| KICH | MRPL43 | -2.18179102009894 | 0.00963503122329712 |
Top |
|
| Translation factor expression regulation through miRNA binding |
| Cancer type | Gene | miRNA | TargetScan binding score (Context++ score percentile) | Coefficient | Pvalue |
| THYM | MRPL43 | hsa-miR-193b-3p | 85 | -0.316762185183238 | 0.0051820897248208 |
| Translation factor expression regulation through methylation in the promoter of Translation factor |
 |
| Cancer type | Gene | methyl group b | methyl group a | DEG pval | avg methyl in b | avg methyl in a | avg exp in b | avg exp in a |
| Translation factor expression regulation through methylation in the gene body of Translation factor (positive regulation) |
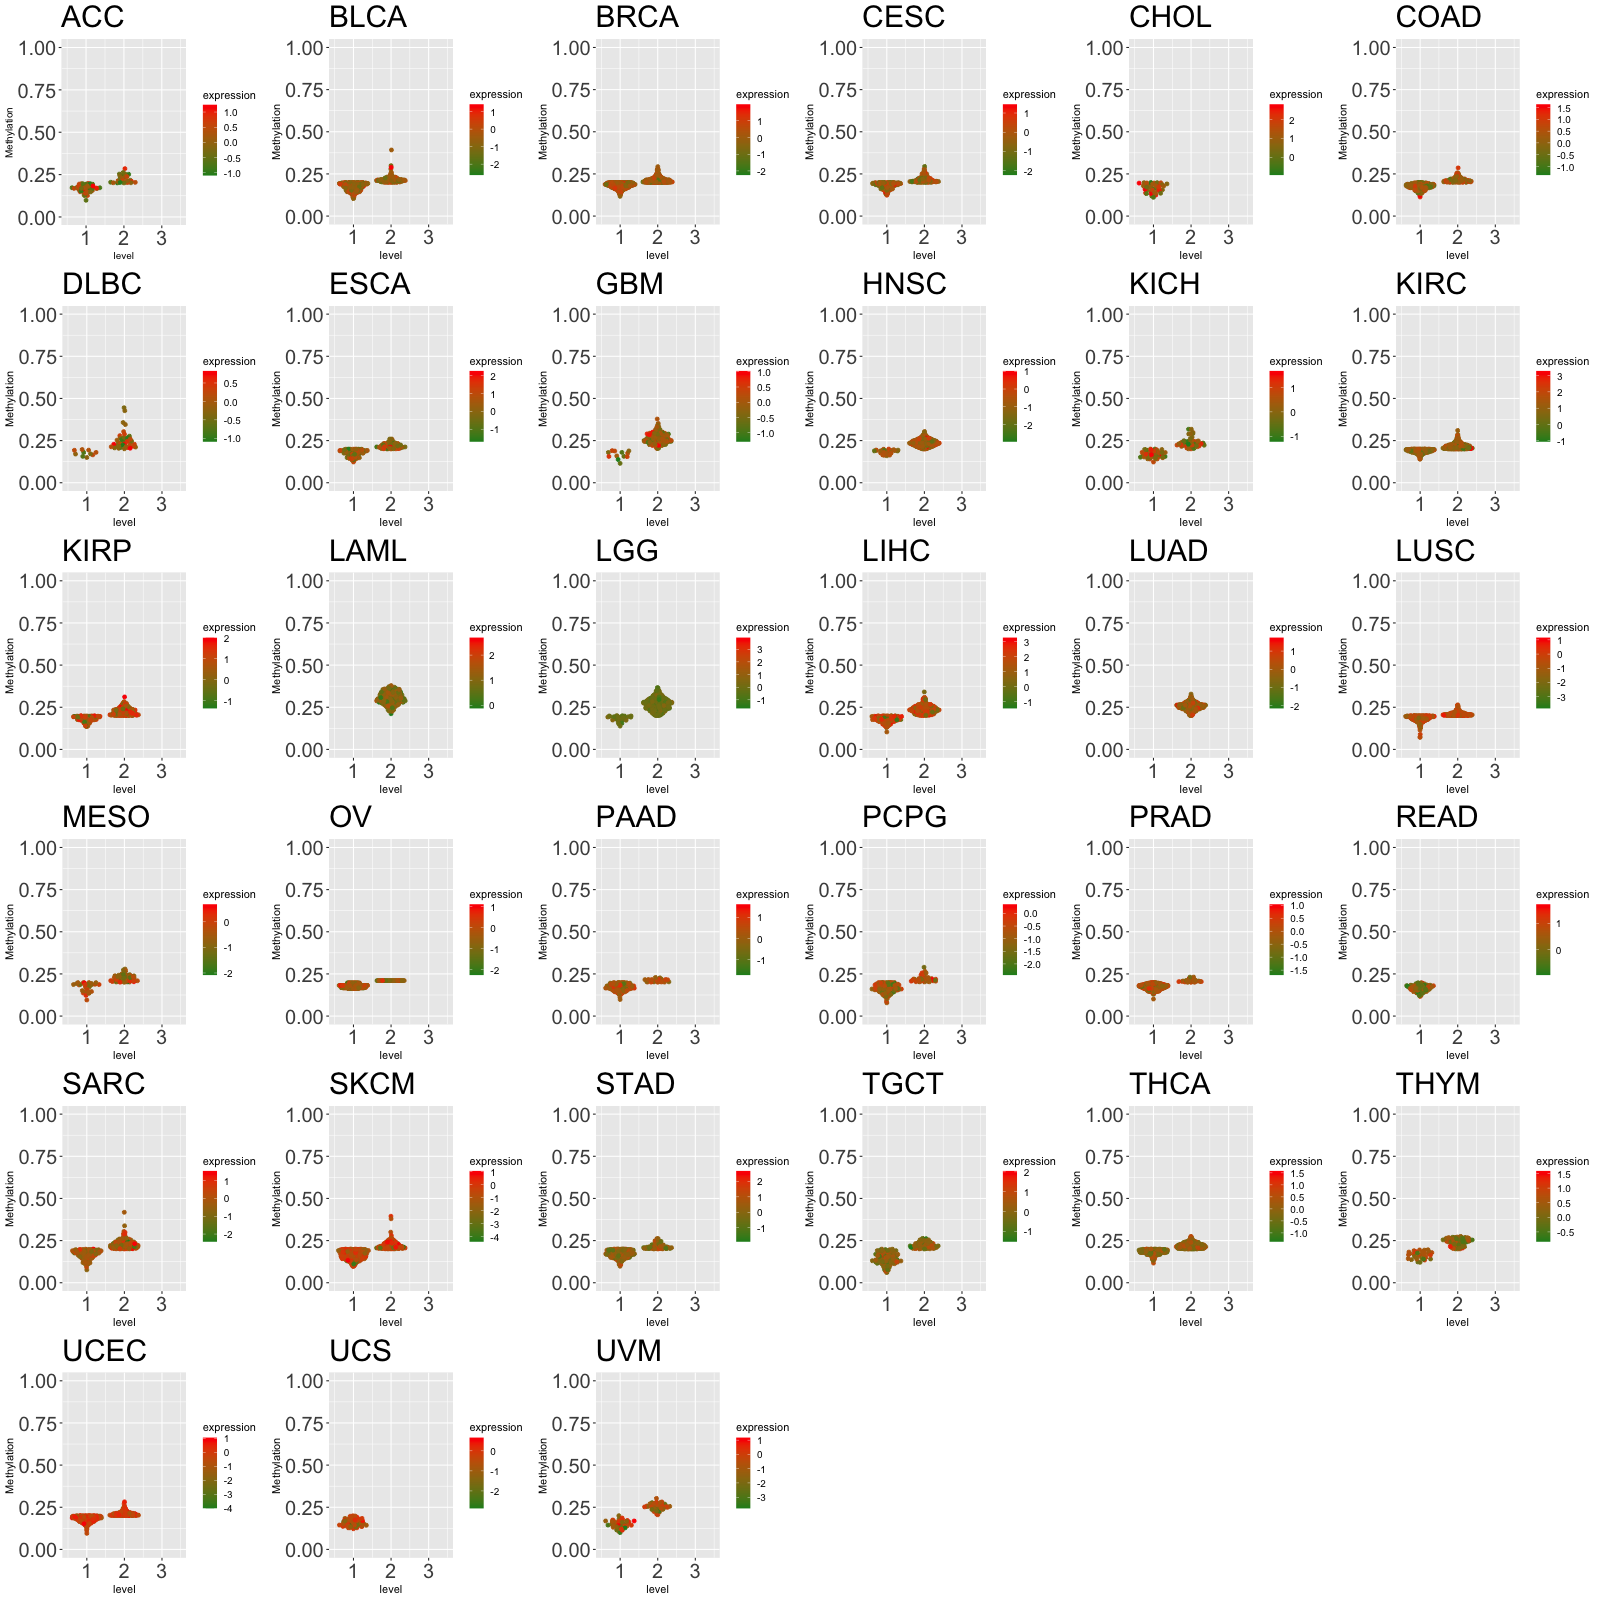 |
| Cancer type | Gene | methyl group b | methyl group a | DEG pval | avg methyl in b | avg methyl in a | avg exp in b | avg exp in a |
| BRCA | MRPL43 | 2 | 1 | 0.0241249952719395 | 0.253348146555842 | 0.186544848484849 | 0.200232333575248 | -0.0679110651583909 |
| THCA | MRPL43 | 2 | 1 | 0.0276654800306328 | 0.267568494208494 | 0.192442016806723 | -0.719023235510525 | -0.267690209543229 |
| Translation factor expression regulation through copy number variation of Translation factor |
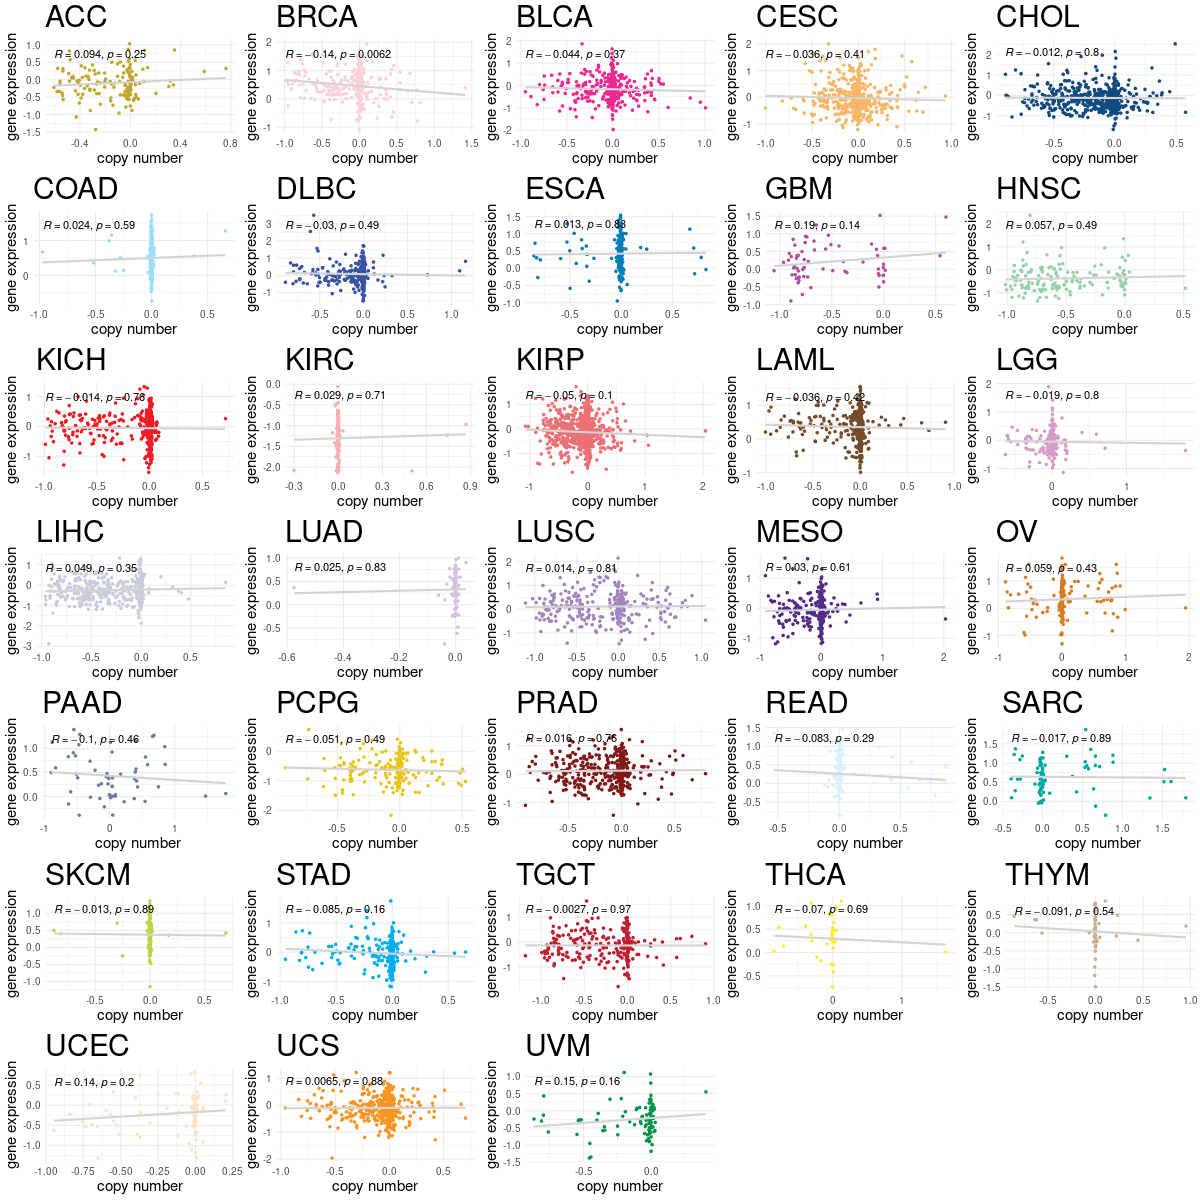 |
| Cancer type | Gene | Coefficient | Pvalue |
| BRCA | MRPL43 | -0.092546902 | 0.006193768 |
Top |
|
| Strongly correlated genes belong to cellular important gene groups with MRPL43 (coefficient>0.8, pval<0.05, node color based on FC between tumor and matched normal). Significantly associated important genes in the individual cancer types. * Cell metabolism gene: cell metabolism genes from REACTOME (black edge), IUPHAR: drug target genes from IUPHAR (blue edge), Kinase: human kinase genes (brown edge), CGC: cancer gene census genes (orange edge), TSG: tumor suppresor genes (purple edge), Epifactor: epigenetic factors (light blue edge), TF: transcription factors (green) |
 |
| Cancer type | Gene group | Translation factor | Correlated gene | Coefficient | Pvalue |
| CHOL | Cell metabolism gene | MRPL43 | FBXW4 | 0.802403939 | 3.41E-11 |
| GBM | Cell metabolism gene | MRPL43 | SUCLG1 | 0.819909572 | 4.92E-43 |
| GBM | TF | MRPL43 | ZNF32 | 0.859409085 | 2.11E-51 |
| KICH | Cell metabolism gene | MRPL43 | UROS | 0.818438756 | 3.92E-23 |
| KICH | TF | MRPL43 | ZNF511 | 0.805314491 | 6.45E-22 |
| THCA | Cell metabolism gene | MRPL43 | UROD | 0.800034091 | 1.41E-128 |
| THCA | Cell metabolism gene | MRPL43 | POLR2I | 0.801929419 | 1.25E-129 |
| THCA | Cell metabolism gene | MRPL43 | DPM3 | 0.82427664 | 6.23E-143 |
| THYM | Cell metabolism gene | MRPL43 | EXOSC4 | 0.801922879 | 1.29E-28 |
| THYM | Cell metabolism gene | MRPL43 | APRT | 0.80264615 | 1.06E-28 |
| THYM | Cell metabolism gene | MRPL43 | MTX1 | 0.81084808 | 1.08E-29 |
| THYM | Cell metabolism gene | MRPL43 | SNRPD2 | 0.813222097 | 5.45E-30 |
| THYM | Cell metabolism gene | MRPL43 | TIMM50 | 0.813599698 | 4.88E-30 |
| THYM | Cell metabolism gene | MRPL43 | ACOT8 | 0.81931135 | 9.05E-31 |
| THYM | Cell metabolism gene | MRPL43 | TIMM13 | 0.821611767 | 4.51E-31 |
| THYM | Cell metabolism gene | MRPL43 | TIMM8B | 0.827746345 | 6.71E-32 |
| THYM | Cell metabolism gene | MRPL43 | EXOSC1 | 0.828944537 | 4.59E-32 |
| THYM | Cell metabolism gene | MRPL43 | PSMC3 | 0.829158019 | 4.29E-32 |
| THYM | Cell metabolism gene | MRPL43 | POLR2I | 0.830579719 | 2.71E-32 |
| THYM | Cell metabolism gene | MRPL43 | ITPA | 0.833778873 | 9.57E-33 |
| THYM | CGC | MRPL43 | MGMT | 0.805821592 | 4.42E-29 |
| THYM | Epifactor | MRPL43 | EXOSC4 | 0.801922879 | 1.29E-28 |
| THYM | Epifactor | MRPL43 | PPP4C | 0.8020254 | 1.25E-28 |
| THYM | Epifactor | MRPL43 | SIRT6 | 0.811132672 | 9.93E-30 |
| THYM | Epifactor | MRPL43 | PRPF31 | 0.811559812 | 8.79E-30 |
| THYM | Epifactor | MRPL43 | TAF10 | 0.812364076 | 6.98E-30 |
| THYM | Epifactor | MRPL43 | RUVBL2 | 0.826084017 | 1.13E-31 |
| THYM | Epifactor | MRPL43 | EXOSC1 | 0.828944537 | 4.59E-32 |
| THYM | IUPHAR | MRPL43 | SIRT6 | 0.811132672 | 9.93E-30 |
| THYM | TF | MRPL43 | ZNF428 | 0.810259925 | 1.27E-29 |
| THYM | TF | MRPL43 | ZNF787 | 0.812871671 | 6.03E-30 |
| THYM | TF | MRPL43 | ZNF511 | 0.852960954 | 1.11E-35 |
| THYM | TSG | MRPL43 | SIRT6 | 0.811132672 | 9.93E-30 |
| THYM | TSG | MRPL43 | PARK7 | 0.834804166 | 6.82E-33 |
| UCS | Cell metabolism gene | MRPL43 | EXOSC4 | 0.801922879 | 1.29E-28 |
| UCS | Cell metabolism gene | MRPL43 | APRT | 0.80264615 | 1.06E-28 |
| UCS | Cell metabolism gene | MRPL43 | MTX1 | 0.81084808 | 1.08E-29 |
| UCS | Cell metabolism gene | MRPL43 | SNRPD2 | 0.813222097 | 5.45E-30 |
| UCS | Cell metabolism gene | MRPL43 | TIMM50 | 0.813599698 | 4.88E-30 |
| UCS | Cell metabolism gene | MRPL43 | ACOT8 | 0.81931135 | 9.05E-31 |
| UCS | Cell metabolism gene | MRPL43 | TIMM13 | 0.821611767 | 4.51E-31 |
| UCS | Cell metabolism gene | MRPL43 | TIMM8B | 0.827746345 | 6.71E-32 |
| UCS | Cell metabolism gene | MRPL43 | EXOSC1 | 0.828944537 | 4.59E-32 |
| UCS | Cell metabolism gene | MRPL43 | PSMC3 | 0.829158019 | 4.29E-32 |
| UCS | Cell metabolism gene | MRPL43 | POLR2I | 0.830579719 | 2.71E-32 |
| UCS | Cell metabolism gene | MRPL43 | ITPA | 0.833778873 | 9.57E-33 |
| UCS | CGC | MRPL43 | MGMT | 0.805821592 | 4.42E-29 |
| UCS | Epifactor | MRPL43 | EXOSC4 | 0.801922879 | 1.29E-28 |
| UCS | Epifactor | MRPL43 | PPP4C | 0.8020254 | 1.25E-28 |
| UCS | Epifactor | MRPL43 | SIRT6 | 0.811132672 | 9.93E-30 |
| UCS | Epifactor | MRPL43 | PRPF31 | 0.811559812 | 8.79E-30 |
| UCS | Epifactor | MRPL43 | TAF10 | 0.812364076 | 6.98E-30 |
| UCS | Epifactor | MRPL43 | RUVBL2 | 0.826084017 | 1.13E-31 |
| UCS | Epifactor | MRPL43 | EXOSC1 | 0.828944537 | 4.59E-32 |
| UCS | IUPHAR | MRPL43 | SIRT6 | 0.811132672 | 9.93E-30 |
| UCS | TF | MRPL43 | ZNF428 | 0.810259925 | 1.27E-29 |
| UCS | TF | MRPL43 | ZNF787 | 0.812871671 | 6.03E-30 |
| UCS | TF | MRPL43 | ZNF511 | 0.852960954 | 1.11E-35 |
| UCS | TSG | MRPL43 | SIRT6 | 0.811132672 | 9.93E-30 |
| UCS | TSG | MRPL43 | PARK7 | 0.834804166 | 6.82E-33 |
Top |
|
| Protein 3D structure Visit iCn3D. |
Top |
|
| Protein-protein interaction networks * Overlap between up-regulated DEGs (log2FC<-1 and adj.P<0.05) and STRING PPI network (center: Translation factor, node: DEGs, edges: weighted by -log2(adj.P)) |
 |
| Overlap between down-regulated DEGs (log2FC>1 and adj.P<0.05) and STRING PPI network (center: Translation factor, node: DEGs, edges: weighted by -log2(adj.P)) |
 |
 * Edge colors based on TCGA cancer types. |
| * Overlap between DEGs (log2FC>1 and adj.P<0.05) and STRING PPI network per cancer (center: Translation factor, node: DEGs, node color: log2FC, edges: weighted by -log2(adj.P)) |
 |
| Cancer type | Translation factor | Interacting protein coding gene | FC | adj.pval |
| STAD | MRPL43 | MRPL15 | -2.15546608137429 | 0.000334546435624361 |
| LUSC | MRPL43 | MRPL44 | -1.0353261138043 | 0.000533204507372277 |
| KIRC | MRPL43 | MRPL46 | -7.36081421944909 | 0.0011460554764592 |
| KIRP | MRPL43 | MRPL46 | -7.17671685013906 | 0.00123529229313135 |
| KIRP | MRPL43 | MRPL19 | -1.9689242575519 | 0.00179363833740354 |
| ESCA | MRPL43 | MRPL47 | -2.26373711796715 | 0.001953125 |
| CHOL | MRPL43 | MRPL2 | -1.49926301466752 | 0.00390625 |
| CHOL | MRPL43 | MRPL3 | -2.68429255990621 | 0.00390625 |
| CHOL | MRPL43 | MRPL46 | -2.73791743817321 | 0.00390625 |
| ESCA | MRPL43 | MRPL3 | -4.97897094908275 | 0.0048828125 |
| COAD | MRPL43 | MRPL15 | 1.17181689924568 | 0.00513318181037904 |
| KICH | MRPL43 | MRPL19 | -2.18550705564541 | 0.00672554969787598 |
| COAD | MRPL43 | MRPL47 | -2.29582381838246 | 0.00863465666770936 |
| ESCA | MRPL43 | MRPL17 | -1.18756178214998 | 0.009765625 |
| CHOL | MRPL43 | MRPL44 | -1.84100898736725 | 0.01171875 |
| STAD | MRPL43 | MRPL47 | -1.4008685687155 | 0.0118026207201183 |
| LIHC | MRPL43 | MRPL17 | -1.06225729770915 | 0.0124123499319886 |
| STAD | MRPL43 | MRPL4 | 1.4393539135682 | 0.0279771662317216 |
| CHOL | MRPL43 | MRPL19 | -2.09295650388558 | 0.0390625 |
| LIHC | MRPL43 | MRPL47 | -6.59586850948538 | 0.0416658979324166 |
| BLCA | MRPL43 | MRPL2 | -3.29210657477178 | 0.0445594787597656 |
| BLCA | MRPL43 | MRPL22 | -2.25969747792543 | 0.0493659973144531 |
| KIRC | MRPL43 | MRPL47 | 1.74758475364701 | 1.00533732476669e-06 |
| LUAD | MRPL43 | MRPL2 | -1.26727646741024 | 1.07341296213058e-06 |
| BRCA | MRPL43 | MRPL22 | -2.3061823226724 | 1.15724909394453e-08 |
| KICH | MRPL43 | MRPL15 | 1.54522142310359 | 1.19209289550781e-07 |
| STAD | MRPL43 | MRPL17 | -3.90880705449186 | 1.49570405483246e-06 |
| LUSC | MRPL43 | MRPL15 | -4.43702988385305 | 1.91594862886626e-08 |
| KIRC | MRPL43 | MRPL3 | 1.69955762234244 | 1.97132191719422e-08 |
| COAD | MRPL43 | MRPL4 | 2.77705897514473 | 2.98023223876954e-07 |
| BRCA | MRPL43 | MRPL44 | -2.66444869593332 | 3.06751315169682e-08 |
| BRCA | MRPL43 | MRPL15 | -3.82448964360727 | 5.49451113259074e-14 |
| LUAD | MRPL43 | MRPL44 | -3.23791370825974 | 5.91982739853218e-07 |
| LUAD | MRPL43 | MRPL22 | -3.64343361732659 | 6.84976461567817e-06 |
| LUSC | MRPL43 | MRPL17 | -6.83409683292749 | 6.93230040561614e-07 |
| LUSC | MRPL43 | MRPL2 | -2.66710222706783 | 7.24218086307245e-08 |
| LUAD | MRPL43 | MRPL47 | -1.74990909879567 | 9.53955602455483e-07 |
| Protein-protein interactors with this translation factor (BIOGRID-3.4.160) |
| PPI interactors with MRPL43 |
| ARRB2, DDX56, ICT1, Ybx1, COPS5, CAND1, MRPL47, MRPL40, NDUFA2, LAMTOR3, RPS18, VCAM1, ITGA4, NPM1, SRPK1, FXR2, NACC1, SLK, MRPL39, GLS, MRPL44, MRPL20, NDUFAF5, MRPL4, MRPL42, MALSU1, MRPS30, RPS8, CASQ2, HNRNPA1, AKAP5, MRPL50, MRPL9, MRPL1, Erp44, Brwd3, EGFR, MRPL10, CYLD, LEO1, MRPS11, MRPS23, PMF1, PSMD4, TAZ, DPF2, RECQL4, SERBP1, RPS6, MRM1, HSPD1, PDK1, TRMT61B, AURKAIP1, RC3H1, RC3H2, ALYREF, SNRNP70, PLEKHA4, PRKCI, PXN, SNIP1, GRSF1, PRRC2A, ARHGAP27, ACAD9, AUH, C12orf65, C17orf80, C1QBP, C21orf33, C6orf203, CCDC90B, CHCHD1, CRYZ, CS, DDX28, DHX30, FASTKD2, FASTKD3, FASTKD5, GFM1, GFM2, HINT2, LONP1, LRPPRC, MCU, CCDC109B, MDH2, METTL15, METTL17, MRPL11, MRPS12, MRPS26, MRRF, MTERF3, MTG1, MTG2, MTIF2, MTIF3, MTRF1, MTRF1L, NGRN, PMPCA, PMPCB, RPUSD4, SLIRP, SSBP1, TACO1, TBRG4, TFAM, TMEM70, TRUB2, TSFM, TUFM, VWA8, EXD2, nsp8ab, DNAJA3, DNAJC15, DNAJC19, HSCB, MRPL19, HIST1H1T, DIEXF, MRPL15, NAP1L4, MRPL27, MRPL38, MRPL18, COX4I1, SMAD4, MRPL30, RBMS2, RPL19, MRPL13, YBX2, RPL37, MRPL51, MRPL12, MRPL53, MRPL23, MRPL28, MRPL52, GADD45GIP1, MRPL2, MRPL21, RPL10, MRPL37, KLF15, |
Top |
|
| Clinically associated variants from ClinVar. |
| Gene | Chr | Position | RefSeq | VarSeq | RefSeeq | VarType | Pathogenic | Disease | VarInfo |
| nsSNVs with sample frequency (size of circle) from TCGA 33 cancers. |
 |
| SNVs and Indels |
| Gene | Cancer type | Chromosome | Start | End | RefSeeq | MutSeq | Mutation type | AAchange | # samples |
| MRPL43 | BLCA | chr10 | 102746503 | 102746503 | C | T | Silent | 3 | |
| MRPL43 | BRCA | chr10 | 102746498 | 102746499 | - | C | Frame_Shift_Ins | p.A158fs | 3 |
| MRPL43 | PAAD | chr10 | 102743779 | 102743779 | A | G | Missense_Mutation | 2 | |
| MRPL43 | UCEC | chr10 | 102746553 | 102746553 | A | G | Missense_Mutation | p.F140L | 2 |
| MRPL43 | BLCA | chr10 | 102746534 | 102746534 | C | T | Missense_Mutation | p.R146Q | 2 |
| MRPL43 | LGG | chr10 | 102739072 | 102739072 | T | C | Missense_Mutation | p.M196V | 2 |
| MRPL43 | BLCA | chr10 | 102741296 | 102741296 | G | A | Missense_Mutation | p.S178L | 2 |
| MRPL43 | LGG | chr10 | 102741298 | 102741298 | T | A | Missense_Mutation | p.I220F | 2 |
| MRPL43 | STAD | chr10 | 102747079 | 102747079 | C | T | Missense_Mutation | p.R41H | 2 |
| MRPL43 | STAD | chr10 | 102739097 | 102739097 | G | T | Silent | p.S187S | 2 |
| MRPL43 | UCEC | chr10 | 102739026 | 102739026 | G | A | Missense_Mutation | p.H253H | 1 |
| MRPL43 | GBM | chr10 | 102732900 | 102732900 | C | T | Missense_Mutation | 1 | |
| MRPL43 | BLCA | chr10 | 102743827 | 102743827 | G | C | Missense_Mutation | 1 | |
| MRPL43 | HNSC | chr10 | 102746724 | 102746724 | C | T | Missense_Mutation | p.A83T | 1 |
| MRPL43 | SARC | chr10 | 102738746 | 102738746 | C | A | Missense_Mutation | 1 | |
| MRPL43 | SARC | chr10 | 102738749 | 102738749 | G | A | Missense_Mutation | 1 | |
| MRPL43 | SKCM | chr10 | 102743797 | 102743797 | G | A | Missense_Mutation | p.P167L | 1 |
| MRPL43 | BLCA | chr10 | 102746590 | 102746590 | C | A | Missense_Mutation | p.Q127H | 1 |
| MRPL43 | LGG | chr10 | 102741298 | 102741298 | T | A | Missense_Mutation | 1 | |
| MRPL43 | SKCM | chr10 | 102739120 | 102739120 | G | A | Missense_Mutation | p.P180S | 1 |
| MRPL43 | LGG | chr10 | 102739072 | 102739072 | T | C | Missense_Mutation | 1 | |
| MRPL43 | SKCM | chr10 | 102741276 | 102741276 | G | A | Missense_Mutation | p.S227F | 1 |
| MRPL43 | CESC | chr10 | 102746715 | 102746715 | C | A | Nonsense_Mutation | p.E86* | 1 |
| MRPL43 | LGG | chr10 | 102746584 | 102746584 | C | A | Missense_Mutation | 1 | |
| MRPL43 | SKCM | chr10 | 102746603 | 102746603 | T | C | Missense_Mutation | p.N123S | 1 |
| MRPL43 | COAD | chr10 | 102743530 | 102743530 | C | A | Missense_Mutation | p.A213S | 1 |
| MRPL43 | LIHC | chr10 | 102739042 | 102739042 | C | T | Missense_Mutation | p.V206I | 1 |
| MRPL43 | ESCA | chr10 | 102739014 | 102739014 | G | T | Missense_Mutation | p.S257R | 1 |
| MRPL43 | LUAD | chr10 | 102743813 | 102743813 | C | T | Missense_Mutation | p.G162S | 1 |
| MRPL43 | BLCA | chr10 | 102746534 | 102746534 | C | T | Missense_Mutation | 1 | |
| MRPL43 | ESCA | chr10 | 102739014 | 102739014 | G | T | Missense_Mutation | 1 | |
| MRPL43 | LUAD | chr10 | 102747076 | 102747076 | C | T | Missense_Mutation | p.G42D | 1 |
| MRPL43 | BLCA | chr10 | 102741296 | 102741296 | G | A | Missense_Mutation | 1 | |
| MRPL43 | THYM | chr10 | 102746882 | 102746882 | C | T | Missense_Mutation | 1 | |
| MRPL43 | ESCA | chr10 | 102746916 | 102746916 | G | T | Silent | p.R57R | 1 |
| MRPL43 | LUAD | chr10 | 102746902 | 102746902 | G | A | Silent | p.V61V | 1 |
| Copy number variation (CNV) of MRPL43 * Click on the image to open the original image in a new window. |
 |
| Fusion gene breakpoints (product of the structural variants (SVs)) across MRPL43 * Click on the image to open the UCSC genome browser with custom track showing this image in a new window. |
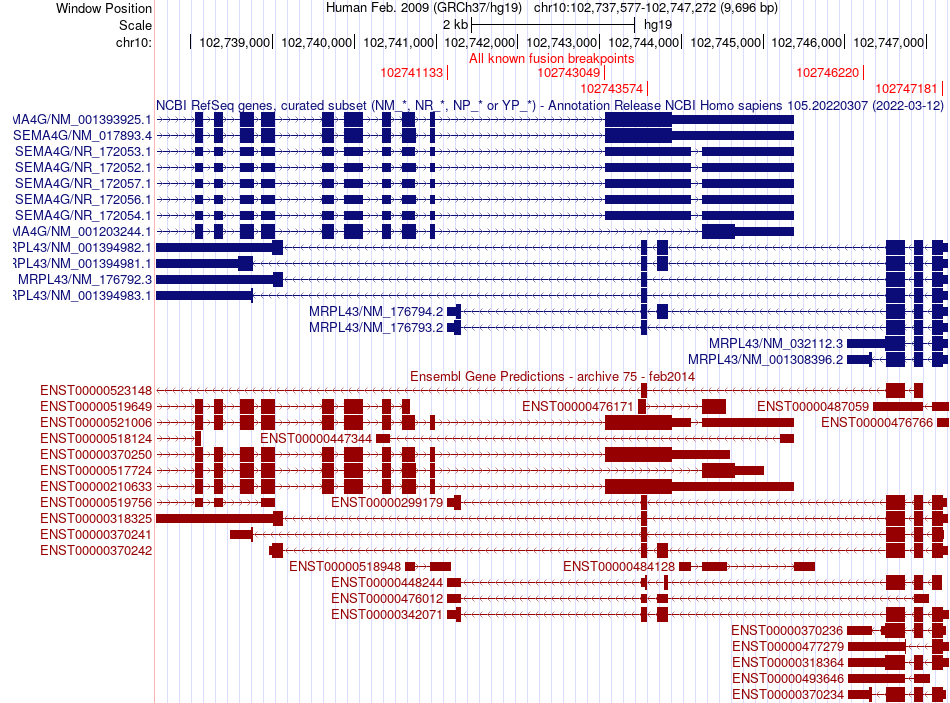 |
| Fusion genes with this translation factor from FusionGDB2.0. |
| FusionGDB2 ID | Disease | Sample | Hgene | Hchr | Hbp | Hstrand | Tgene | Tchr | Tbp | Tstrand |
| 100341 | N/A | AW021215 | MRPL43 | chr10 | 102741133 | - | C3orf14 | chr3 | 62319901 | + |
| 58097 | N/A | BF897742 | MRPL43 | chr10 | 102743049 | - | SEMA4G | chr10 | 102743193 | + |
| 95512 | SKCM | TCGA-EB-A42Z-01A | OSBP2 | chr22 | 31137356 | + | MRPL43 | chr10 | 102743574 | - |
Top |
|
| Kaplan-Meier plots with logrank tests of overall survival (OS) |
 |
| Cancer type | Translation factor | Coefficent | Hazard ratio | Wald test pval | Likelihool ratio pval | Logrank test pval | # samples |
Top |
|
| Differential gene expression between female and male. (Wilcoxon test, pval<0.05) |
 |
| Cancer type | Translation factor | pval | adj.p |
| KIRP | MRPL43 | 0.00395683720744542 | 0.11 |
Top |
|
| Differential gene expression between young and old age groups (Wilcoxon test, pval<0.05) |
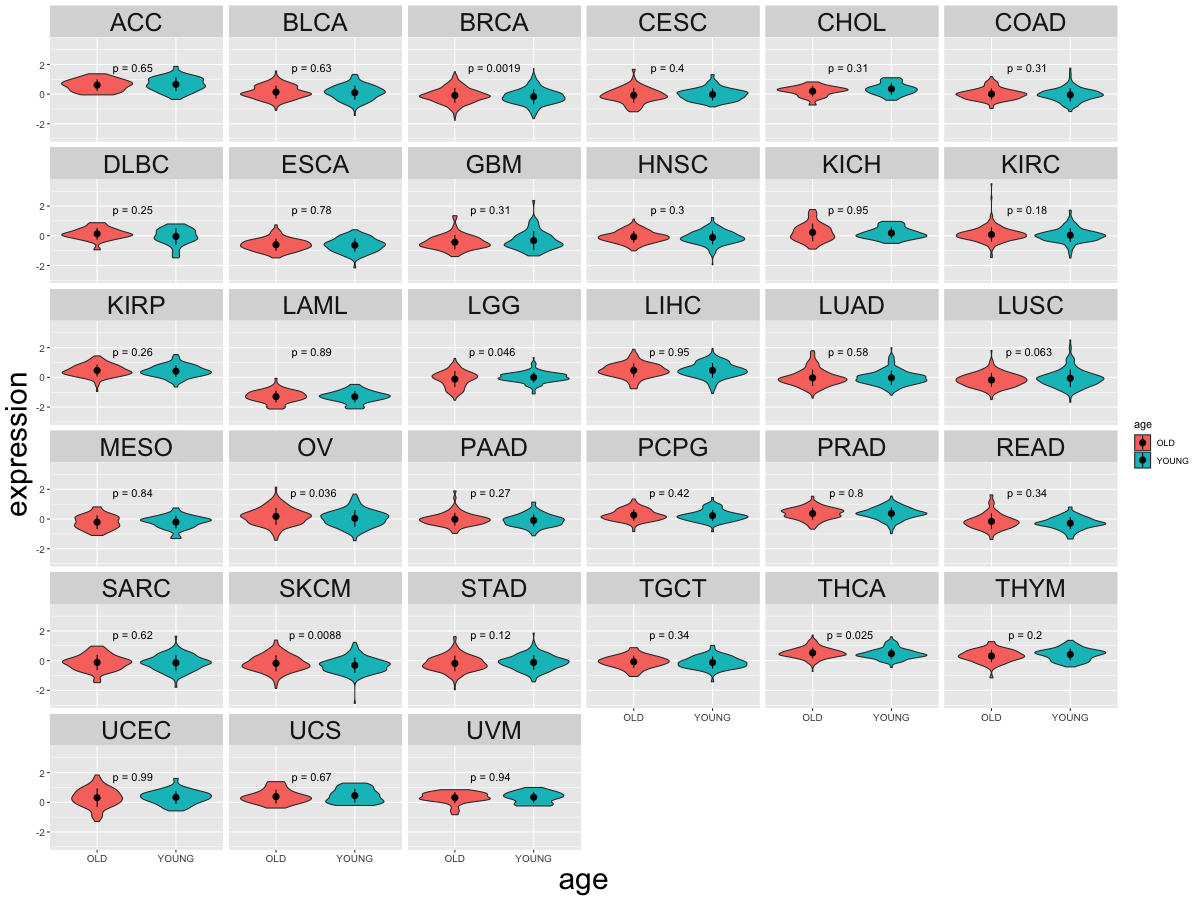 |
| Cancer type | Translation factor | pval | adj.p |
| THCA | MRPL43 | 0.0247711870387306 | 0.77 |
| LGG | MRPL43 | 0.0463806240436381 | 1 |
| BRCA | MRPL43 | 0.00187321617764499 | 0.062 |
| SKCM | MRPL43 | 0.00875638689836256 | 0.28 |
| OV | MRPL43 | 0.0357716145204618 | 1 |
Top |
|
| Drugs targeting genes involved in this translation factor. (DrugBank Version 5.1.8 2021-05-08) |
| UniProtAcc | DrugBank ID | Drug name | Drug activity | Drug type | Drug status |
Top |
|
| Diseases associated with this translation factor. (DisGeNet 4.0) |
| Disease ID | Disease Name | # PubMeds | Disease source |
(UTHealth)
Web File Viewing | Emergency Information |Campus Carry|Site Policies