
|
||||||
|

Translation Factor: MTG1 (NCBI Gene ID:92170) |
|
 Gene Summary Gene Summary |
| Gene Information | Gene Name: MTG1 | Gene ID: 92170 | Gene Symbol | MTG1 | Gene ID | 92170 |
| Gene Name | mitochondrial ribosome associated GTPase 1 | |
| Synonyms | GTP|GTPBP7 | |
| Cytomap | 10q26.3 | |
| Type of Gene | protein-coding | |
| Description | mitochondrial ribosome-associated GTPase 1GTP-binding protein 7 (putative)mitochondrial GTPase 1 homolog | |
| Modification date | 20200313 | |
| UniProtAcc | Q9BT17 | |
| Child GO biological process term(s) under GO:0006412 |
| GO ID | GO term |
| GO:0006417 | Regulation of translation |
| GO:0032543 | Mitochondrial translation |
| GO:0005840 | Ribosome |
| GO:0006412 | Translation |
| Gene ontology of translaction factor with evidence of Inferred from Direct Assay (IDA) from Entrez |
| Partner | Gene | GO ID | GO term | PubMed ID |
| Inferred gene age of translation factor. |
| Gene | Inferred gene age group among (0 - 67.6], (67.6 - 355.7], (355.7 - 733], (733 - 1119.25], >1119.25 |
| MTG1 | >1119.25 |
Top |
|
| We searched PubMed using 'MTG1[title] AND translation [title] AND human.' |
| Gene | Title | PMID |
| MTG1 | Human G-proteins, ObgH1 and Mtg1, associate with the large mitochondrial ribosome subunit and are involved in translation and assembly of respiratory complexes | 23396448 |
Top |
|
| Skipped exons in TCGA and GTEx based on Ensembl gene isoform structure. * Click on the image to open the UCSC genome browser with custom track showing this image in a new window. For more annotations, please visit our ExonSkipDB. |
 |
| Open reading frame (ORF) analsis of exon skipping events based on Ensembl gene isoform structure. * Click on the break point to see the gene structure around the break point region using the UCSC Genome Browser. |
| ENST | Exon skip start (DNA) | Exon Skip end (DNA) | ORF |
| Exon skipping position in the amino acid sequence. |
| ENST | Exon skip start (DNA) | Exon Skip end (DNA) | Len(transcript seq) | Exon skip start (mRNA) | Exon Skip end (mRNA) | Len(amino acid seq) | Exon skip start (AA) | Exon Skip end (AA) |
| Potentially (partially) lost protein functional features of UniProt. |
| UniProtAcc | Exon skip start (AA) | Exon Skip end (AA) | Function feature start (AA) | Function feature end (AA) | Functional feature type | Functional feature desc. |
Top |
|
| Gene expression level across TCGA pancancer |
 |
| Gene expression level across GTEx pantissue |
 |
| Expression level of gene isoforms across TCGA pancancer |
 |
| Expression level of gene isoforms across GTEx pantissue |
 |
| Cancer(tissue) type-specific expression level of Translation factor using z-score distriution |
 |
| Differential expression between tumor and matched normal (in the cancer types with more than 10 matched samples) |
 |
| Cancer type | Translation factor | FC | adj.pval |
| STAD | MTG1 | -1.43160368180665 | 0.018431528005749 |
| LUSC | MTG1 | -9.2533205847158 | 1.09583750788394e-07 |
| LUAD | MTG1 | -1.45502261953375 | 9.14904976982756e-06 |
Top |
|
| Translation factor expression regulation through miRNA binding |
| Cancer type | Gene | miRNA | TargetScan binding score (Context++ score percentile) | Coefficient | Pvalue |
| Translation factor expression regulation through methylation in the promoter of Translation factor |
 |
| Cancer type | Gene | methyl group b | methyl group a | DEG pval | avg methyl in b | avg methyl in a | avg exp in b | avg exp in a |
| Translation factor expression regulation through methylation in the gene body of Translation factor (positive regulation) |
 |
| Cancer type | Gene | methyl group b | methyl group a | DEG pval | avg methyl in b | avg methyl in a | avg exp in b | avg exp in a |
| Translation factor expression regulation through copy number variation of Translation factor |
 |
| Cancer type | Gene | Coefficient | Pvalue |
Top |
|
| Strongly correlated genes belong to cellular important gene groups with MTG1 (coefficient>0.8, pval<0.05, node color based on FC between tumor and matched normal). Significantly associated important genes in the individual cancer types. * Cell metabolism gene: cell metabolism genes from REACTOME (black edge), IUPHAR: drug target genes from IUPHAR (blue edge), Kinase: human kinase genes (brown edge), CGC: cancer gene census genes (orange edge), TSG: tumor suppresor genes (purple edge), Epifactor: epigenetic factors (light blue edge), TF: transcription factors (green) |
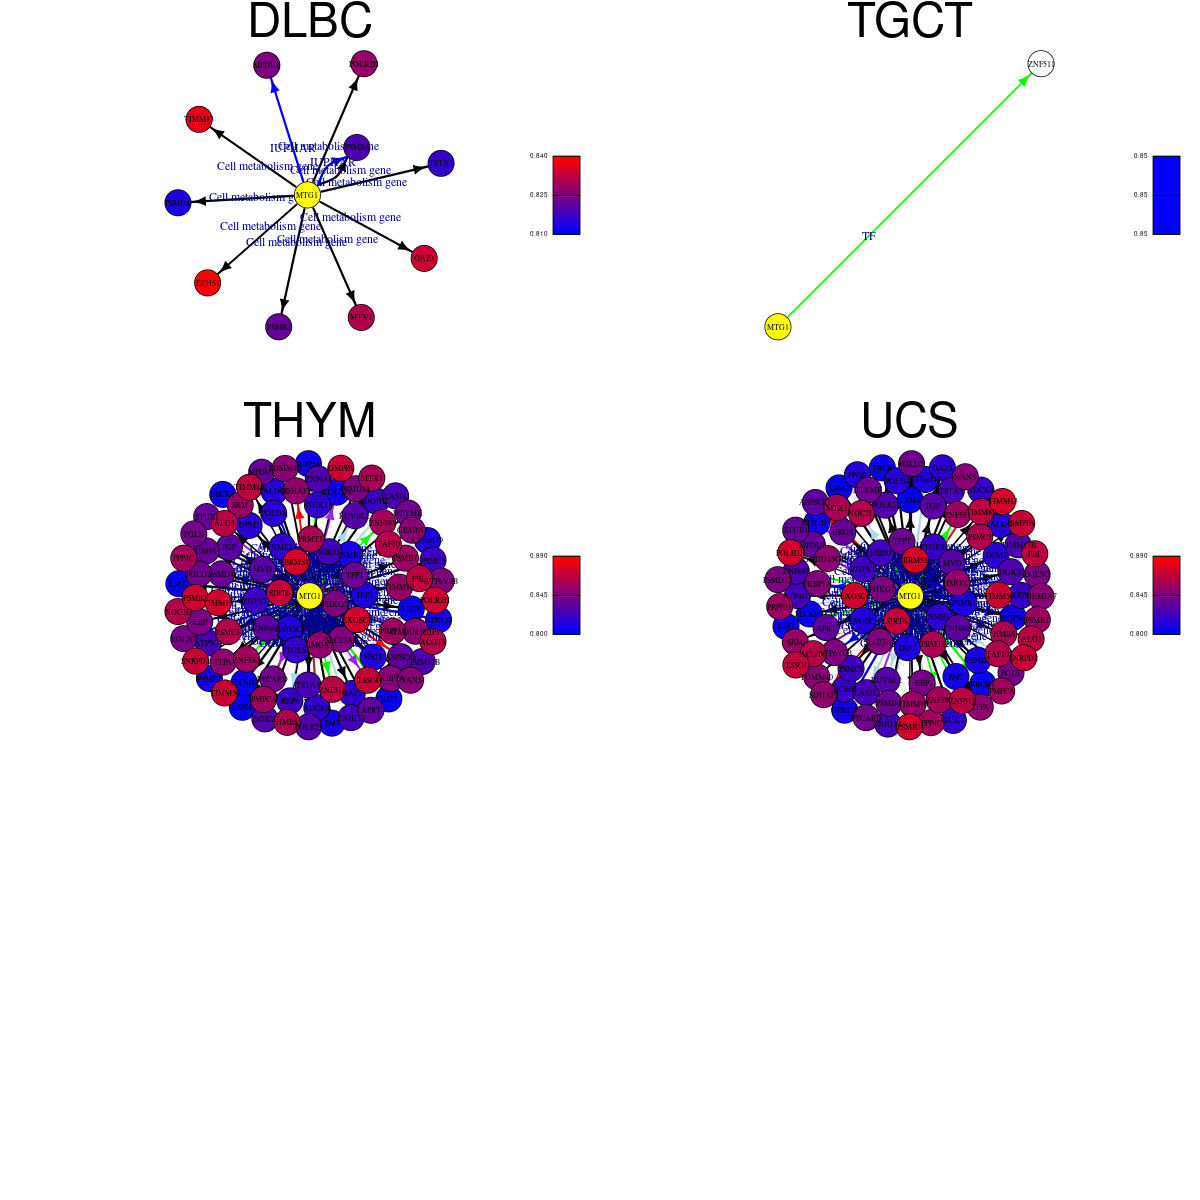 |
| Cancer type | Gene group | Translation factor | Correlated gene | Coefficient | Pvalue |
| DLBC | Cell metabolism gene | MTG1 | PSMD4 | 0.808075155 | 3.84E-12 |
| DLBC | Cell metabolism gene | MTG1 | TSTA3 | 0.808546553 | 3.65E-12 |
| DLBC | Cell metabolism gene | MTG1 | PSMB6 | 0.809177736 | 3.40E-12 |
| DLBC | Cell metabolism gene | MTG1 | PSMB3 | 0.812442935 | 2.38E-12 |
| DLBC | Cell metabolism gene | MTG1 | POLR2H | 0.813790089 | 2.05E-12 |
| DLBC | Cell metabolism gene | MTG1 | MTX1 | 0.816402291 | 1.52E-12 |
| DLBC | Cell metabolism gene | MTG1 | OAZ1 | 0.82357345 | 6.61E-13 |
| DLBC | Cell metabolism gene | MTG1 | TIMM13 | 0.824775728 | 5.73E-13 |
| DLBC | Cell metabolism gene | MTG1 | ECHS1 | 0.836648693 | 1.31E-13 |
| DLBC | IUPHAR | MTG1 | PSMB6 | 0.809177736 | 3.40E-12 |
| DLBC | IUPHAR | MTG1 | MPDU1 | 0.813065113 | 2.22E-12 |
| TGCT | TF | MTG1 | ZNF511 | 0.854663391 | 1.08E-45 |
| THYM | Cell metabolism gene | MTG1 | LSM2 | 0.800098303 | 2.10E-28 |
| THYM | Cell metabolism gene | MTG1 | LSM4 | 0.80060349 | 1.84E-28 |
| THYM | Cell metabolism gene | MTG1 | SEC61G | 0.804141134 | 7.03E-29 |
| THYM | Cell metabolism gene | MTG1 | TBCB | 0.806272447 | 3.90E-29 |
| THYM | Cell metabolism gene | MTG1 | NOP56 | 0.806585746 | 3.58E-29 |
| THYM | Cell metabolism gene | MTG1 | FAU | 0.807220078 | 3.00E-29 |
| THYM | Cell metabolism gene | MTG1 | PSME2 | 0.807410491 | 2.84E-29 |
| THYM | Cell metabolism gene | MTG1 | PSMB1 | 0.809672007 | 1.50E-29 |
| THYM | Cell metabolism gene | MTG1 | EXOSC5 | 0.810189502 | 1.30E-29 |
| THYM | Cell metabolism gene | MTG1 | FPGS | 0.810649612 | 1.14E-29 |
| THYM | Cell metabolism gene | MTG1 | TALDO1 | 0.811263004 | 9.57E-30 |
| THYM | Cell metabolism gene | MTG1 | POLD4 | 0.812310636 | 7.08E-30 |
| THYM | Cell metabolism gene | MTG1 | DPM2 | 0.812878883 | 6.01E-30 |
| THYM | Cell metabolism gene | MTG1 | OAZ1 | 0.813771369 | 4.64E-30 |
| THYM | Cell metabolism gene | MTG1 | NME1 | 0.815047829 | 3.20E-30 |
| THYM | Cell metabolism gene | MTG1 | GUK1 | 0.815829833 | 2.55E-30 |
| THYM | Cell metabolism gene | MTG1 | PTGES2 | 0.816379164 | 2.17E-30 |
| THYM | Cell metabolism gene | MTG1 | DOHH | 0.817184629 | 1.71E-30 |
| THYM | Cell metabolism gene | MTG1 | PSMC5 | 0.817212255 | 1.69E-30 |
| THYM | Cell metabolism gene | MTG1 | ATP5G1 | 0.818485739 | 1.16E-30 |
| THYM | Cell metabolism gene | MTG1 | TSTA3 | 0.81890923 | 1.02E-30 |
| THYM | Cell metabolism gene | MTG1 | TIMM17B | 0.819129618 | 9.55E-31 |
| THYM | Cell metabolism gene | MTG1 | DGKZ | 0.819348367 | 8.95E-31 |
| THYM | Cell metabolism gene | MTG1 | POLR2I | 0.819771821 | 7.88E-31 |
| THYM | Cell metabolism gene | MTG1 | MVD | 0.820541612 | 6.24E-31 |
| THYM | Cell metabolism gene | MTG1 | PGP | 0.821392544 | 4.82E-31 |
| THYM | Cell metabolism gene | MTG1 | APRT | 0.822230582 | 3.74E-31 |
| THYM | Cell metabolism gene | MTG1 | UROS | 0.827781821 | 6.64E-32 |
| THYM | Cell metabolism gene | MTG1 | PSMD4 | 0.828115051 | 5.97E-32 |
| THYM | Cell metabolism gene | MTG1 | POLD2 | 0.829171175 | 4.27E-32 |
| THYM | Cell metabolism gene | MTG1 | DTYMK | 0.830532123 | 2.76E-32 |
| THYM | Cell metabolism gene | MTG1 | PGLS | 0.831643384 | 1.92E-32 |
| THYM | Cell metabolism gene | MTG1 | EBP | 0.833684464 | 9.87E-33 |
| THYM | Cell metabolism gene | MTG1 | PSMD13 | 0.834050601 | 8.75E-33 |
| THYM | Cell metabolism gene | MTG1 | PHKG2 | 0.834342041 | 7.95E-33 |
| THYM | Cell metabolism gene | MTG1 | SLC27A5 | 0.835249858 | 5.88E-33 |
| THYM | Cell metabolism gene | MTG1 | NANS | 0.839233787 | 1.53E-33 |
| THYM | Cell metabolism gene | MTG1 | TOMM40 | 0.839350191 | 1.47E-33 |
| THYM | Cell metabolism gene | MTG1 | GEMIN7 | 0.83963767 | 1.34E-33 |
| THYM | Cell metabolism gene | MTG1 | ITPA | 0.841228862 | 7.72E-34 |
| THYM | Cell metabolism gene | MTG1 | HMOX2 | 0.841541586 | 6.93E-34 |
| THYM | Cell metabolism gene | MTG1 | TIMM10 | 0.841971309 | 5.97E-34 |
| THYM | Cell metabolism gene | MTG1 | SRM | 0.843389294 | 3.63E-34 |
| THYM | Cell metabolism gene | MTG1 | PSMB7 | 0.843441484 | 3.57E-34 |
| THYM | Cell metabolism gene | MTG1 | PMPCA | 0.852765847 | 1.20E-35 |
| THYM | Cell metabolism gene | MTG1 | MTX1 | 0.855026456 | 5.09E-36 |
| THYM | Cell metabolism gene | MTG1 | HMBS | 0.856481588 | 2.91E-36 |
| THYM | Cell metabolism gene | MTG1 | PSMC3 | 0.856967466 | 2.41E-36 |
| THYM | Cell metabolism gene | MTG1 | ACOT8 | 0.858699229 | 1.22E-36 |
| THYM | Cell metabolism gene | MTG1 | ALG3 | 0.860219244 | 6.70E-37 |
| THYM | Cell metabolism gene | MTG1 | TIMM8B | 0.864071036 | 1.41E-37 |
| THYM | Cell metabolism gene | MTG1 | SNRPD2 | 0.87220669 | 4.48E-39 |
| THYM | Cell metabolism gene | MTG1 | GMPPA | 0.872433013 | 4.06E-39 |
| THYM | Cell metabolism gene | MTG1 | TIMM50 | 0.881727707 | 5.77E-41 |
| THYM | Cell metabolism gene | MTG1 | POLR2H | 0.884653143 | 1.41E-41 |
| THYM | Cell metabolism gene | MTG1 | PSMB3 | 0.885341992 | 1.00E-41 |
| THYM | Cell metabolism gene | MTG1 | EXOSC4 | 0.887339262 | 3.71E-42 |
| THYM | Cell metabolism gene | MTG1 | TIMM13 | 0.890283843 | 8.30E-43 |
| THYM | CGC | MTG1 | ASPSCR1 | 0.821583735 | 4.55E-31 |
| THYM | CGC | MTG1 | TFPT | 0.828148329 | 5.91E-32 |
| THYM | CGC | MTG1 | SDHAF2 | 0.841320634 | 7.48E-34 |
| THYM | Epifactor | MTG1 | C17orf49 | 0.809986707 | 1.38E-29 |
| THYM | Epifactor | MTG1 | EXOSC5 | 0.810189502 | 1.30E-29 |
| THYM | Epifactor | MTG1 | RRP8 | 0.816932874 | 1.84E-30 |
| THYM | Epifactor | MTG1 | ZGPAT | 0.817556986 | 1.53E-30 |
| THYM | Epifactor | MTG1 | MBD3 | 0.817627133 | 1.50E-30 |
| THYM | Epifactor | MTG1 | ZNHIT1 | 0.818049436 | 1.32E-30 |
| THYM | Epifactor | MTG1 | LAS1L | 0.818545572 | 1.14E-30 |
| THYM | Epifactor | MTG1 | RUVBL2 | 0.820508795 | 6.31E-31 |
| THYM | Epifactor | MTG1 | TFPT | 0.828148329 | 5.91E-32 |
| THYM | Epifactor | MTG1 | PRPF31 | 0.846051857 | 1.41E-34 |
| THYM | Epifactor | MTG1 | PPP4C | 0.853210009 | 1.01E-35 |
| THYM | Epifactor | MTG1 | PRMT1 | 0.855317371 | 4.55E-36 |
| THYM | Epifactor | MTG1 | TAF10 | 0.857212402 | 2.19E-36 |
| THYM | Epifactor | MTG1 | NOC2L | 0.858408168 | 1.37E-36 |
| THYM | Epifactor | MTG1 | FBL | 0.870905312 | 7.91E-39 |
| THYM | Epifactor | MTG1 | SIRT6 | 0.870992487 | 7.61E-39 |
| THYM | Epifactor | MTG1 | EXOSC4 | 0.887339262 | 3.71E-42 |
| THYM | Epifactor | MTG1 | BRMS1 | 0.89497113 | 6.97E-44 |
| THYM | IUPHAR | MTG1 | GPR137 | 0.806945976 | 3.24E-29 |
| THYM | IUPHAR | MTG1 | PSMB1 | 0.809672007 | 1.50E-29 |
| THYM | IUPHAR | MTG1 | PTGES2 | 0.816379164 | 2.17E-30 |
| THYM | IUPHAR | MTG1 | MVD | 0.820541612 | 6.24E-31 |
| THYM | IUPHAR | MTG1 | MPDU1 | 0.824801852 | 1.69E-31 |
| THYM | IUPHAR | MTG1 | EGLN2 | 0.832234936 | 1.59E-32 |
| THYM | IUPHAR | MTG1 | PHKG2 | 0.834342041 | 7.95E-33 |
| THYM | IUPHAR | MTG1 | SLC27A5 | 0.835249858 | 5.88E-33 |
| THYM | IUPHAR | MTG1 | ATP6V0B | 0.835549207 | 5.32E-33 |
| THYM | IUPHAR | MTG1 | FKBP1A | 0.838916239 | 1.71E-33 |
| THYM | IUPHAR | MTG1 | HMOX2 | 0.841541586 | 6.93E-34 |
| THYM | IUPHAR | MTG1 | PRMT1 | 0.855317371 | 4.55E-36 |
| THYM | IUPHAR | MTG1 | SIRT6 | 0.870992487 | 7.61E-39 |
| THYM | Kinase | MTG1 | ADCK4 | 0.816259933 | 2.24E-30 |
| THYM | Kinase | MTG1 | PHKG2 | 0.834342041 | 7.95E-33 |
| THYM | TF | MTG1 | USF1 | 0.801076998 | 1.62E-28 |
| THYM | TF | MTG1 | RBCK1 | 0.803354205 | 8.72E-29 |
| THYM | TF | MTG1 | IRF3 | 0.809775456 | 1.46E-29 |
| THYM | TF | MTG1 | ZGPAT | 0.817556986 | 1.53E-30 |
| THYM | TF | MTG1 | MBD3 | 0.817627133 | 1.50E-30 |
| THYM | TF | MTG1 | ZNF688 | 0.81900713 | 9.91E-31 |
| THYM | TF | MTG1 | ZNF668 | 0.821992407 | 4.02E-31 |
| THYM | TF | MTG1 | ZNF581 | 0.847093761 | 9.70E-35 |
| THYM | TF | MTG1 | ZNF787 | 0.854350886 | 6.58E-36 |
| THYM | TF | MTG1 | ZNF511 | 0.861642873 | 3.79E-37 |
| THYM | TSG | MTG1 | RTN4IP1 | 0.806914439 | 3.27E-29 |
| THYM | TSG | MTG1 | IRF3 | 0.809775456 | 1.46E-29 |
| THYM | TSG | MTG1 | NME1 | 0.815047829 | 3.20E-30 |
| THYM | TSG | MTG1 | ZNF668 | 0.821992407 | 4.02E-31 |
| THYM | TSG | MTG1 | STUB1 | 0.825479179 | 1.37E-31 |
| THYM | TSG | MTG1 | PYCARD | 0.830962659 | 2.40E-32 |
| THYM | TSG | MTG1 | GADD45GIP1 | 0.840742633 | 9.14E-34 |
| THYM | TSG | MTG1 | SIRT6 | 0.870992487 | 7.61E-39 |
| THYM | TSG | MTG1 | TSSC4 | 0.871163834 | 7.07E-39 |
| THYM | TSG | MTG1 | BRMS1 | 0.89497113 | 6.97E-44 |
| UCS | Cell metabolism gene | MTG1 | LSM2 | 0.800098303 | 2.10E-28 |
| UCS | Cell metabolism gene | MTG1 | LSM4 | 0.80060349 | 1.84E-28 |
| UCS | Cell metabolism gene | MTG1 | SEC61G | 0.804141134 | 7.03E-29 |
| UCS | Cell metabolism gene | MTG1 | TBCB | 0.806272447 | 3.90E-29 |
| UCS | Cell metabolism gene | MTG1 | NOP56 | 0.806585746 | 3.58E-29 |
| UCS | Cell metabolism gene | MTG1 | FAU | 0.807220078 | 3.00E-29 |
| UCS | Cell metabolism gene | MTG1 | PSME2 | 0.807410491 | 2.84E-29 |
| UCS | Cell metabolism gene | MTG1 | PSMB1 | 0.809672007 | 1.50E-29 |
| UCS | Cell metabolism gene | MTG1 | EXOSC5 | 0.810189502 | 1.30E-29 |
| UCS | Cell metabolism gene | MTG1 | FPGS | 0.810649612 | 1.14E-29 |
| UCS | Cell metabolism gene | MTG1 | TALDO1 | 0.811263004 | 9.57E-30 |
| UCS | Cell metabolism gene | MTG1 | POLD4 | 0.812310636 | 7.08E-30 |
| UCS | Cell metabolism gene | MTG1 | DPM2 | 0.812878883 | 6.01E-30 |
| UCS | Cell metabolism gene | MTG1 | OAZ1 | 0.813771369 | 4.64E-30 |
| UCS | Cell metabolism gene | MTG1 | NME1 | 0.815047829 | 3.20E-30 |
| UCS | Cell metabolism gene | MTG1 | GUK1 | 0.815829833 | 2.55E-30 |
| UCS | Cell metabolism gene | MTG1 | PTGES2 | 0.816379164 | 2.17E-30 |
| UCS | Cell metabolism gene | MTG1 | DOHH | 0.817184629 | 1.71E-30 |
| UCS | Cell metabolism gene | MTG1 | PSMC5 | 0.817212255 | 1.69E-30 |
| UCS | Cell metabolism gene | MTG1 | ATP5G1 | 0.818485739 | 1.16E-30 |
| UCS | Cell metabolism gene | MTG1 | TSTA3 | 0.81890923 | 1.02E-30 |
| UCS | Cell metabolism gene | MTG1 | TIMM17B | 0.819129618 | 9.55E-31 |
| UCS | Cell metabolism gene | MTG1 | DGKZ | 0.819348367 | 8.95E-31 |
| UCS | Cell metabolism gene | MTG1 | POLR2I | 0.819771821 | 7.88E-31 |
| UCS | Cell metabolism gene | MTG1 | MVD | 0.820541612 | 6.24E-31 |
| UCS | Cell metabolism gene | MTG1 | PGP | 0.821392544 | 4.82E-31 |
| UCS | Cell metabolism gene | MTG1 | APRT | 0.822230582 | 3.74E-31 |
| UCS | Cell metabolism gene | MTG1 | UROS | 0.827781821 | 6.64E-32 |
| UCS | Cell metabolism gene | MTG1 | PSMD4 | 0.828115051 | 5.97E-32 |
| UCS | Cell metabolism gene | MTG1 | POLD2 | 0.829171175 | 4.27E-32 |
| UCS | Cell metabolism gene | MTG1 | DTYMK | 0.830532123 | 2.76E-32 |
| UCS | Cell metabolism gene | MTG1 | PGLS | 0.831643384 | 1.92E-32 |
| UCS | Cell metabolism gene | MTG1 | EBP | 0.833684464 | 9.87E-33 |
| UCS | Cell metabolism gene | MTG1 | PSMD13 | 0.834050601 | 8.75E-33 |
| UCS | Cell metabolism gene | MTG1 | PHKG2 | 0.834342041 | 7.95E-33 |
| UCS | Cell metabolism gene | MTG1 | SLC27A5 | 0.835249858 | 5.88E-33 |
| UCS | Cell metabolism gene | MTG1 | NANS | 0.839233787 | 1.53E-33 |
| UCS | Cell metabolism gene | MTG1 | TOMM40 | 0.839350191 | 1.47E-33 |
| UCS | Cell metabolism gene | MTG1 | GEMIN7 | 0.83963767 | 1.34E-33 |
| UCS | Cell metabolism gene | MTG1 | ITPA | 0.841228862 | 7.72E-34 |
| UCS | Cell metabolism gene | MTG1 | HMOX2 | 0.841541586 | 6.93E-34 |
| UCS | Cell metabolism gene | MTG1 | TIMM10 | 0.841971309 | 5.97E-34 |
| UCS | Cell metabolism gene | MTG1 | SRM | 0.843389294 | 3.63E-34 |
| UCS | Cell metabolism gene | MTG1 | PSMB7 | 0.843441484 | 3.57E-34 |
| UCS | Cell metabolism gene | MTG1 | PMPCA | 0.852765847 | 1.20E-35 |
| UCS | Cell metabolism gene | MTG1 | MTX1 | 0.855026456 | 5.09E-36 |
| UCS | Cell metabolism gene | MTG1 | HMBS | 0.856481588 | 2.91E-36 |
| UCS | Cell metabolism gene | MTG1 | PSMC3 | 0.856967466 | 2.41E-36 |
| UCS | Cell metabolism gene | MTG1 | ACOT8 | 0.858699229 | 1.22E-36 |
| UCS | Cell metabolism gene | MTG1 | ALG3 | 0.860219244 | 6.70E-37 |
| UCS | Cell metabolism gene | MTG1 | TIMM8B | 0.864071036 | 1.41E-37 |
| UCS | Cell metabolism gene | MTG1 | SNRPD2 | 0.87220669 | 4.48E-39 |
| UCS | Cell metabolism gene | MTG1 | GMPPA | 0.872433013 | 4.06E-39 |
| UCS | Cell metabolism gene | MTG1 | TIMM50 | 0.881727707 | 5.77E-41 |
| UCS | Cell metabolism gene | MTG1 | POLR2H | 0.884653143 | 1.41E-41 |
| UCS | Cell metabolism gene | MTG1 | PSMB3 | 0.885341992 | 1.00E-41 |
| UCS | Cell metabolism gene | MTG1 | EXOSC4 | 0.887339262 | 3.71E-42 |
| UCS | Cell metabolism gene | MTG1 | TIMM13 | 0.890283843 | 8.30E-43 |
| UCS | CGC | MTG1 | ASPSCR1 | 0.821583735 | 4.55E-31 |
| UCS | CGC | MTG1 | TFPT | 0.828148329 | 5.91E-32 |
| UCS | CGC | MTG1 | SDHAF2 | 0.841320634 | 7.48E-34 |
| UCS | Epifactor | MTG1 | C17orf49 | 0.809986707 | 1.38E-29 |
| UCS | Epifactor | MTG1 | EXOSC5 | 0.810189502 | 1.30E-29 |
| UCS | Epifactor | MTG1 | RRP8 | 0.816932874 | 1.84E-30 |
| UCS | Epifactor | MTG1 | ZGPAT | 0.817556986 | 1.53E-30 |
| UCS | Epifactor | MTG1 | MBD3 | 0.817627133 | 1.50E-30 |
| UCS | Epifactor | MTG1 | ZNHIT1 | 0.818049436 | 1.32E-30 |
| UCS | Epifactor | MTG1 | LAS1L | 0.818545572 | 1.14E-30 |
| UCS | Epifactor | MTG1 | RUVBL2 | 0.820508795 | 6.31E-31 |
| UCS | Epifactor | MTG1 | TFPT | 0.828148329 | 5.91E-32 |
| UCS | Epifactor | MTG1 | PRPF31 | 0.846051857 | 1.41E-34 |
| UCS | Epifactor | MTG1 | PPP4C | 0.853210009 | 1.01E-35 |
| UCS | Epifactor | MTG1 | PRMT1 | 0.855317371 | 4.55E-36 |
| UCS | Epifactor | MTG1 | TAF10 | 0.857212402 | 2.19E-36 |
| UCS | Epifactor | MTG1 | NOC2L | 0.858408168 | 1.37E-36 |
| UCS | Epifactor | MTG1 | FBL | 0.870905312 | 7.91E-39 |
| UCS | Epifactor | MTG1 | SIRT6 | 0.870992487 | 7.61E-39 |
| UCS | Epifactor | MTG1 | EXOSC4 | 0.887339262 | 3.71E-42 |
| UCS | Epifactor | MTG1 | BRMS1 | 0.89497113 | 6.97E-44 |
| UCS | IUPHAR | MTG1 | GPR137 | 0.806945976 | 3.24E-29 |
| UCS | IUPHAR | MTG1 | PSMB1 | 0.809672007 | 1.50E-29 |
| UCS | IUPHAR | MTG1 | PTGES2 | 0.816379164 | 2.17E-30 |
| UCS | IUPHAR | MTG1 | MVD | 0.820541612 | 6.24E-31 |
| UCS | IUPHAR | MTG1 | MPDU1 | 0.824801852 | 1.69E-31 |
| UCS | IUPHAR | MTG1 | EGLN2 | 0.832234936 | 1.59E-32 |
| UCS | IUPHAR | MTG1 | PHKG2 | 0.834342041 | 7.95E-33 |
| UCS | IUPHAR | MTG1 | SLC27A5 | 0.835249858 | 5.88E-33 |
| UCS | IUPHAR | MTG1 | ATP6V0B | 0.835549207 | 5.32E-33 |
| UCS | IUPHAR | MTG1 | FKBP1A | 0.838916239 | 1.71E-33 |
| UCS | IUPHAR | MTG1 | HMOX2 | 0.841541586 | 6.93E-34 |
| UCS | IUPHAR | MTG1 | PRMT1 | 0.855317371 | 4.55E-36 |
| UCS | IUPHAR | MTG1 | SIRT6 | 0.870992487 | 7.61E-39 |
| UCS | Kinase | MTG1 | ADCK4 | 0.816259933 | 2.24E-30 |
| UCS | Kinase | MTG1 | PHKG2 | 0.834342041 | 7.95E-33 |
| UCS | TF | MTG1 | USF1 | 0.801076998 | 1.62E-28 |
| UCS | TF | MTG1 | RBCK1 | 0.803354205 | 8.72E-29 |
| UCS | TF | MTG1 | IRF3 | 0.809775456 | 1.46E-29 |
| UCS | TF | MTG1 | ZGPAT | 0.817556986 | 1.53E-30 |
| UCS | TF | MTG1 | MBD3 | 0.817627133 | 1.50E-30 |
| UCS | TF | MTG1 | ZNF688 | 0.81900713 | 9.91E-31 |
| UCS | TF | MTG1 | ZNF668 | 0.821992407 | 4.02E-31 |
| UCS | TF | MTG1 | ZNF581 | 0.847093761 | 9.70E-35 |
| UCS | TF | MTG1 | ZNF787 | 0.854350886 | 6.58E-36 |
| UCS | TF | MTG1 | ZNF511 | 0.861642873 | 3.79E-37 |
| UCS | TSG | MTG1 | RTN4IP1 | 0.806914439 | 3.27E-29 |
| UCS | TSG | MTG1 | IRF3 | 0.809775456 | 1.46E-29 |
| UCS | TSG | MTG1 | NME1 | 0.815047829 | 3.20E-30 |
| UCS | TSG | MTG1 | ZNF668 | 0.821992407 | 4.02E-31 |
| UCS | TSG | MTG1 | STUB1 | 0.825479179 | 1.37E-31 |
| UCS | TSG | MTG1 | PYCARD | 0.830962659 | 2.40E-32 |
| UCS | TSG | MTG1 | GADD45GIP1 | 0.840742633 | 9.14E-34 |
| UCS | TSG | MTG1 | SIRT6 | 0.870992487 | 7.61E-39 |
| UCS | TSG | MTG1 | TSSC4 | 0.871163834 | 7.07E-39 |
| UCS | TSG | MTG1 | BRMS1 | 0.89497113 | 6.97E-44 |
Top |
|
| Protein 3D structure Visit iCn3D. |
Top |
|
| Protein-protein interaction networks * Overlap between up-regulated DEGs (log2FC<-1 and adj.P<0.05) and STRING PPI network (center: Translation factor, node: DEGs, edges: weighted by -log2(adj.P)) |
 |
| Overlap between down-regulated DEGs (log2FC>1 and adj.P<0.05) and STRING PPI network (center: Translation factor, node: DEGs, edges: weighted by -log2(adj.P)) |
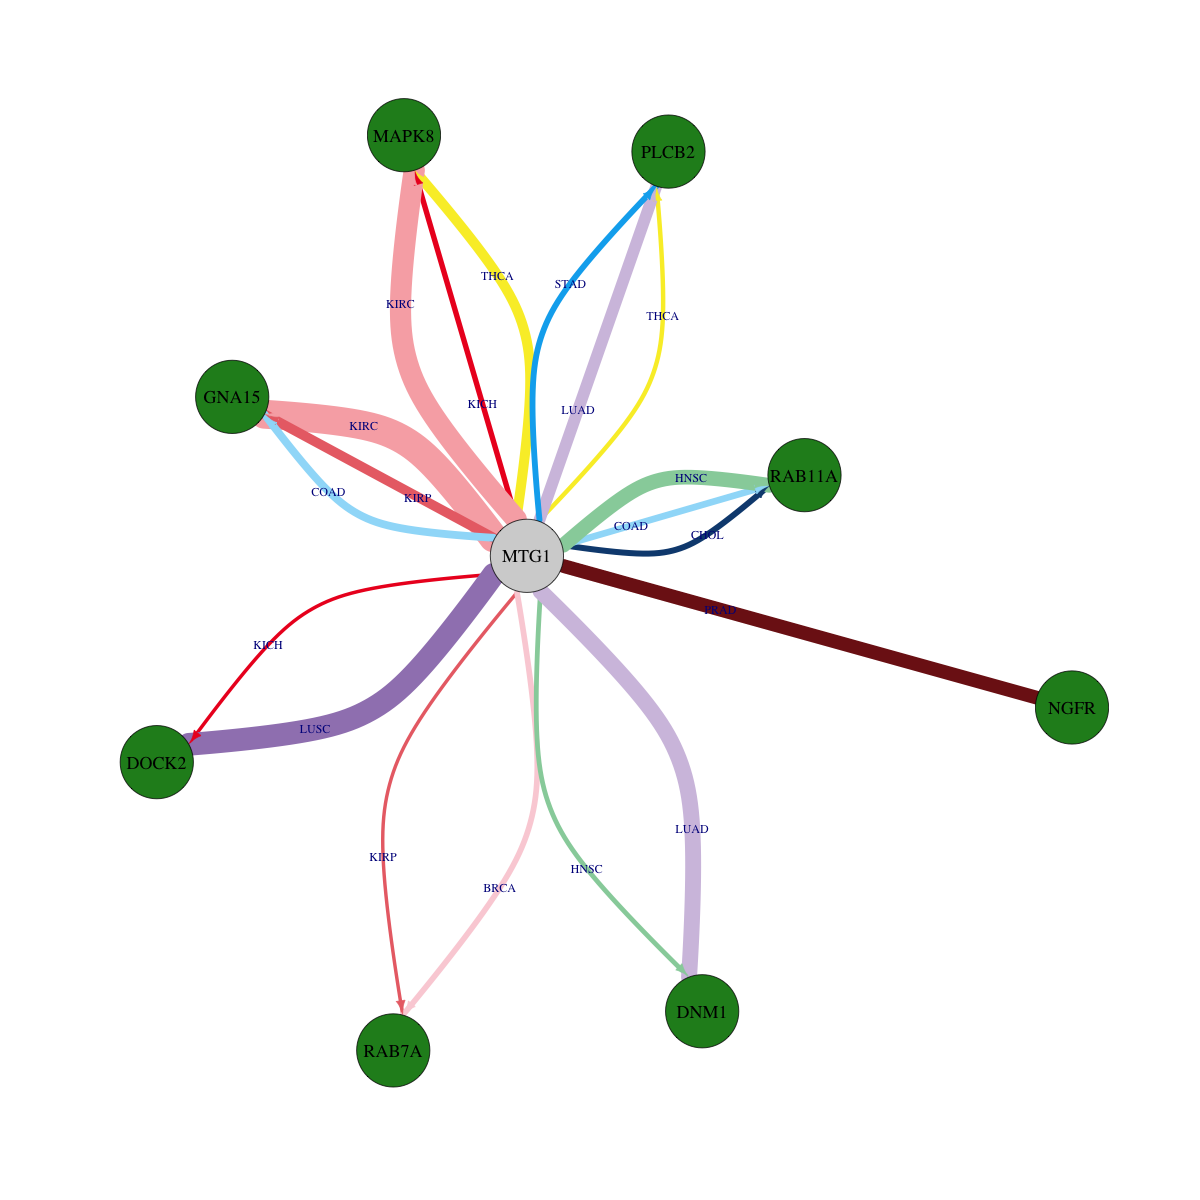 |
 * Edge colors based on TCGA cancer types. |
| * Overlap between DEGs (log2FC>1 and adj.P<0.05) and STRING PPI network per cancer (center: Translation factor, node: DEGs, node color: log2FC, edges: weighted by -log2(adj.P)) |
 |
| Cancer type | Translation factor | Interacting protein coding gene | FC | adj.pval |
| KIRP | MTG1 | GNA15 | -1.15430784934725 | 0.000121572986245155 |
| KIRP | MTG1 | RAB11A | 1.52821325962631 | 0.000147277489304543 |
| KICH | MTG1 | DNM1 | 1.8225947557234 | 0.000287055969238281 |
| COAD | MTG1 | GNA15 | -2.51710413044039 | 0.000745445489883424 |
| LIHC | MTG1 | DOCK2 | 1.74093815658113 | 0.00176202511499206 |
| COAD | MTG1 | RAB11A | -2.39921072698545 | 0.0021815299987793 |
| CHOL | MTG1 | RAB11A | -3.66678799134057 | 0.00390625 |
| STAD | MTG1 | PLCB2 | -3.96054635322187 | 0.0044123362749815 |
| KICH | MTG1 | RAB11A | 1.79825930749283 | 0.00460463762283325 |
| BRCA | MTG1 | RAB7A | -1.88004147893159 | 0.00520010834415395 |
| KICH | MTG1 | MAPK8 | -1.51329293934289 | 0.00672554969787598 |
| THCA | MTG1 | NGFR | 1.77668830535957 | 0.0077987309442106 |
| HNSC | MTG1 | DNM1 | -1.36549317441097 | 0.0120438377739447 |
| THCA | MTG1 | PLCB2 | -1.17968678061544 | 0.0165532896967884 |
| CHOL | MTG1 | RAB7A | 1.89982413982143 | 0.01953125 |
| KICH | MTG1 | DOCK2 | -1.14006555289107 | 0.0393387079238892 |
| KIRP | MTG1 | RAB7A | -7.63843176194268 | 0.0413399673998356 |
| UCEC | MTG1 | DOCK2 | 1.10289397331236 | 0.046875 |
| UCEC | MTG1 | PLCB2 | 1.53477974633115 | 0.046875 |
| HNSC | MTG1 | RAB11A | -2.14258348178078 | 1.26861641547294e-06 |
| LUAD | MTG1 | PLCB2 | -1.39041848057459 | 1.85622339362816e-05 |
| KIRC | MTG1 | GNA15 | -1.72722375636508 | 2.54891161547424e-12 |
| PRAD | MTG1 | NGFR | -1.21638574722352 | 2.91952404061616e-06 |
| KIRC | MTG1 | MAPK8 | -1.92076786620356 | 3.15846974004787e-09 |
| BRCA | MTG1 | RAB11A | 2.11170261411049 | 3.50581981406914e-11 |
| LUAD | MTG1 | DNM1 | -1.57344864751058 | 4.11637918366747e-07 |
| PRAD | MTG1 | RAB11A | 1.15185241820425 | 6.68841890472086e-06 |
| LUSC | MTG1 | DOCK2 | -2.77037474210448 | 7.57048857587633e-10 |
| THCA | MTG1 | MAPK8 | -5.39070634578477 | 9.38064110141239e-05 |
| Protein-protein interactors with this translation factor (BIOGRID-3.4.160) |
| PPI interactors with MTG1 |
| STRN4, ICT1, PRNP, APP, DOCK8, ISLR, EGFR, TRIP13, SSSCA1, CAMK2D, HSPD1, YBEY, MRPL12, BPNT1, GRPR, LRRK1, Dppa3, PICK1, ERICH1, KRT37, STX2, LOC102724334, C12orf65, C6orf203, AARS2, ACAD9, ACOT2, AFG3L2, ATP5F1, ATP5J, BCS1L, BOP1, C17orf80, ADCK4, CS, DAP3, DLAT, DLST, ECHS1, ELAC2, ETFA, FASTKD2, GADD45GIP1, GLS, GRSF1, GTPBP10, GTPBP3, HNRNPDL, IARS2, IBA57, LETM1, LONP1, LRPPRC, MALSU1, ME2, MMAB, RNMTL1, MRPL1, MRPL11, MRPL13, MRPL15, MRPL16, MRPL17, MRPL19, MRPL2, MRPL23, MRPL24, MRPL27, MRPL28, MRPL3, MRPL38, MRPL39, MRPL4, MRPL41, MRPL43, MRPL44, MRPL45, MRPL46, MRPL49, MRPL50, MRPL51, MRPL52, MRPL53, MRPL54, MRPL9, MRPS10, MRPS16, MRPS18B, MRPS2, MRPS22, MRPS23, MRPS24, MRPS25, MRPS26, MRPS27, MRPS28, MRPS30, MRPS31, MRPS33, MRPS34, MRPS35, MRPS5, MRPS6, MRPS7, MRPS9, MTIF2, NDUFA12, NDUFA2, NDUFA5, NDUFA9, NDUFAF2, NDUFAF4, NDUFS1, NDUFS2, NDUFS3, NDUFS4, NDUFS8, NDUFV1, NDUFV3, NFS1, NIFK, NT5DC2, OAT, OGDH, PDHA1, PDHB, PDPR, PMPCA, PNPT1, POLDIP2, POLRMT, PREPL, PTCD3, TACO1, TIMM44, TRMT10C, TRMT61B, TSFM, VARS2, VWA8, PIPSL, HCST, FTL, UQCRFS1, SCGB2A2, CAMK2A, RBFOX2, Htatsf1, |
Top |
|
| Clinically associated variants from ClinVar. |
| Gene | Chr | Position | RefSeq | VarSeq | RefSeeq | VarType | Pathogenic | Disease | VarInfo |
| MTG1 | chr10 | 135215667 | C | T | single_nucleotide_variant | Benign | not_provided | SO:0001819|synonymous_variant | SO:0001819|synonymous_variant |
| nsSNVs with sample frequency (size of circle) from TCGA 33 cancers. |
 |
| SNVs and Indels |
| Gene | Cancer type | Chromosome | Start | End | RefSeeq | MutSeq | Mutation type | AAchange | # samples |
| MTG1 | STAD | chr10 | 135211971 | 135211971 | A | - | Frame_Shift_Del | p.L105fs | 8 |
| MTG1 | COAD | chr10 | 135233645 | 135233645 | C | - | Frame_Shift_Del | p.H327fs | 7 |
| MTG1 | UCEC | chr10 | 135233628 | 135233628 | G | A | Missense_Mutation | p.D322N | 4 |
| MTG1 | KIRP | chr10 | 135209749 | 135209750 | - | GC | Frame_Shift_Ins | p.L87fs | 3 |
| MTG1 | PAAD | chr10 | 135215660 | 135215660 | A | G | Missense_Mutation | 2 | |
| MTG1 | ACC | chr10 | 135209699 | 135209699 | G | T | Missense_Mutation | p.Q70H | 2 |
| MTG1 | PAAD | chr10 | 135211958 | 135211958 | A | C | Missense_Mutation | 2 | |
| MTG1 | ESCA | chr10 | 135209721 | 135209721 | C | G | Missense_Mutation | p.H78D | 2 |
| MTG1 | ESCA | chr10 | 135212714 | 135212714 | G | T | Missense_Mutation | p.R135L | 2 |
| MTG1 | LIHC | chr10 | 135211954 | 135211954 | T | C | Silent | 2 | |
| MTG1 | BLCA | chr10 | 135213089 | 135213089 | C | A | Silent | 2 | |
| MTG1 | UCEC | chr10 | 135209264 | 135209264 | G | A | Missense_Mutation | p.E54K | 2 |
| MTG1 | ESCA | chr10 | 135209721 | 135209721 | C | G | Missense_Mutation | 2 | |
| MTG1 | UCEC | chr10 | 135212692 | 135212692 | G | T | Nonsense_Mutation | p.E128* | 2 |
| MTG1 | BRCA | chr10 | 135233665 | 135233665 | C | A | Missense_Mutation | p.P334H | 2 |
| MTG1 | UCEC | chr10 | 135212723 | 135212723 | G | A | Missense_Mutation | p.R138Q | 2 |
| MTG1 | UCEC | chr10 | 135215055 | 135215055 | C | T | Silent | p.G178 | 2 |
| MTG1 | STAD | chr10 | 135209235 | 135209235 | G | A | Missense_Mutation | 2 | |
| MTG1 | UCEC | chr10 | 135232995 | 135232995 | A | G | Missense_Mutation | p.H255R | 2 |
| MTG1 | UCEC | chr10 | 135233611 | 135233611 | C | T | Missense_Mutation | p.S316F | 2 |
| MTG1 | LUSC | chr10 | 135233567 | 135233567 | A | T | Silent | p.A301A | 1 |
| MTG1 | COAD | chr10 | 135209676 | 135209676 | T | A | Missense_Mutation | p.S63T | 1 |
| MTG1 | STAD | chr10 | 135233048 | 135233048 | G | A | Missense_Mutation | p.A273T | 1 |
| MTG1 | KIRP | chr10 | 135209677 | 135209677 | C | T | Missense_Mutation | p.S63L | 1 |
| MTG1 | UCS | chr10 | 135215056 | 135215056 | G | A | Missense_Mutation | 1 | |
| MTG1 | ESCA | chr10 | 135207758 | 135207758 | G | A | Missense_Mutation | p.A12T | 1 |
| MTG1 | THYM | chr10 | 135233664 | 135233664 | C | T | Missense_Mutation | p.P334S | 1 |
| MTG1 | LIHC | chr10 | 135213074 | 135213074 | G | A | Silent | 1 | |
| MTG1 | UCS | chr10 | 135215056 | 135215056 | G | A | Missense_Mutation | p.E179K | 1 |
| MTG1 | THYM | chr10 | 135209680 | 135209680 | G | T | Missense_Mutation | p.G64V | 1 |
| MTG1 | LIHC | chr10 | 135233566 | 135233566 | C | T | Missense_Mutation | 1 | |
| MTG1 | ACC | chr10 | 135207754 | 135207754 | C | G | Missense_Mutation | p.S10R | 1 |
| MTG1 | PAAD | chr10 | 135233564 | 135233564 | G | A | Silent | 1 | |
| MTG1 | UCEC | chr10 | 135209752 | 135209752 | C | T | Missense_Mutation | p.A88V | 1 |
| MTG1 | PAAD | chr10 | 135211958 | 135211958 | A | C | Missense_Mutation | p.E101A | 1 |
| MTG1 | ESCA | chr10 | 135207758 | 135207758 | G | A | Missense_Mutation | 1 | |
| MTG1 | LIHC | chr10 | 135215725 | 135215725 | A | G | Missense_Mutation | p.T216A | 1 |
| MTG1 | BLCA | chr10 | 135213089 | 135213089 | C | T | Silent | p.L159L | 1 |
| MTG1 | PAAD | chr10 | 135233564 | 135233564 | G | A | Silent | p.A300A | 1 |
| MTG1 | LUAD | chr10 | 135233655 | 135233655 | G | C | Missense_Mutation | p.E331Q | 1 |
| MTG1 | PAAD | chr10 | 135215660 | 135215660 | A | G | Missense_Mutation | p.E194G | 1 |
| MTG1 | HNSC | chr10 | 135212703 | 135212703 | G | C | Silent | 1 | |
| MTG1 | LUAD | chr10 | 135233639 | 135233639 | G | T | Silent | p.R325R | 1 |
| MTG1 | CESC | chr10 | 135233645 | 135233645 | C | - | Frame_Shift_Del | 1 | |
| MTG1 | SKCM | chr10 | 135213098 | 135213098 | C | T | Silent | p.S162S | 1 |
| MTG1 | HNSC | chr10 | 135233650 | 135233650 | C | T | Missense_Mutation | 1 | |
| MTG1 | LUAD | chr10 | 135213068 | 135213068 | C | G | Silent | p.P152P | 1 |
| MTG1 | COAD | chr10 | 135209682 | 135209682 | C | T | Missense_Mutation | p.R65C | 1 |
| MTG1 | HNSC | chr10 | 135212703 | 135212703 | G | C | Silent | p.G131G | 1 |
| MTG1 | LUAD | chr10 | 135209744 | 135209744 | G | T | Missense_Mutation | p.M85I | 1 |
| MTG1 | COAD | chr10 | 135233595 | 135233595 | C | T | Missense_Mutation | p.R311C | 1 |
| MTG1 | STAD | chr10 | 135209235 | 135209235 | G | A | Missense_Mutation | p.S44N | 1 |
| MTG1 | HNSC | chr10 | 135233650 | 135233650 | C | T | Missense_Mutation | p.P329L | 1 |
| MTG1 | LUSC | chr10 | 135209741 | 135209741 | G | C | Missense_Mutation | p.K84N | 1 |
| Copy number variation (CNV) of MTG1 * Click on the image to open the original image in a new window. |
 |
| Fusion gene breakpoints (product of the structural variants (SVs)) across MTG1 * Click on the image to open the UCSC genome browser with custom track showing this image in a new window. |
 |
| Fusion genes with this translation factor from FusionGDB2.0. |
| FusionGDB2 ID | Disease | Sample | Hgene | Hchr | Hbp | Hstrand | Tgene | Tchr | Tbp | Tstrand |
| 101461 | N/A | BM145010 | BCAT1 | chr12 | 24990401 | + | MTG1 | chr10 | 135233984 | - |
| 101461 | Non-Cancer | TCGA-BR-7851-11A | DPEP1 | chr16 | 89680127 | + | MTG1 | chr10 | 135209217 | + |
| 87518 | STAD | TCGA-HU-A4H0-01A | MTG1 | chr10 | 135216277 | + | GPR123 | chr10 | 134940737 | + |
| 103233 | STAD | TCGA-FP-8211-01A | MTG1 | chr10 | 135216277 | + | MGMT | chr10 | 131362043 | + |
| 101926 | STAD | TCGA-BR-A4QI-01A | MTG1 | chr10 | 135216277 | + | PAOX | chr10 | 135194964 | + |
| 97055 | BRCA | TCGA-BH-A0AV-01A | MTG1 | chr10 | 135213123 | + | PTK2 | chr8 | 141762415 | - |
| 55669 | STAD | TCGA-HU-A4H6 | MTG1 | chr10 | 135216277 | + | ZNF350 | chr19 | 52477784 | - |
| 94383 | BRCA | TCGA-C8-A137 | MTG1 | chr10 | 135216277 | + | ZNF511 | chr10 | 135126291 | + |
| 94383 | BRCA | TCGA-C8-A137-01A | MTG1 | chr10 | 135216276 | + | ZNF511 | chr10 | 135126291 | + |
| 94383 | BRCA | TCGA-C8-A137-01A | MTG1 | chr10 | 135216277 | + | ZNF511 | chr10 | 135126292 | + |
| 101464 | Non-Cancer | 61N | ZNF124 | chr1 | 247335149 | - | MTG1 | chr10 | 135232983 | + |
Top |
|
| Kaplan-Meier plots with logrank tests of overall survival (OS) |
 |
| Cancer type | Translation factor | Coefficent | Hazard ratio | Wald test pval | Likelihool ratio pval | Logrank test pval | # samples |
Top |
|
| Differential gene expression between female and male. (Wilcoxon test, pval<0.05) |
 |
| Cancer type | Translation factor | pval | adj.p |
| STAD | MTG1 | 0.0155765510280821 | 0.44 |
| KIRP | MTG1 | 0.0447960155087526 | 1 |
| THYM | MTG1 | 0.0491473724455778 | 1 |
Top |
|
| Differential gene expression between young and old age groups (Wilcoxon test, pval<0.05) |
 |
| Cancer type | Translation factor | pval | adj.p |
| BRCA | MTG1 | 0.0440565865381447 | 1 |
Top |
|
| Drugs targeting genes involved in this translation factor. (DrugBank Version 5.1.8 2021-05-08) |
| UniProtAcc | DrugBank ID | Drug name | Drug activity | Drug type | Drug status |
Top |
|
| Diseases associated with this translation factor. (DisGeNet 4.0) |
| Disease ID | Disease Name | # PubMeds | Disease source |
(UTHealth)
Web File Viewing | Emergency Information |Campus Carry|Site Policies