
|
||||||
|

Translation Factor: EEF1E1 (NCBI Gene ID:9521) |
|
 Gene Summary Gene Summary |
| Gene Information | Gene Name: EEF1E1 | Gene ID: 9521 | Gene Symbol | EEF1E1 | Gene ID | 9521 |
| Gene Name | eukaryotic translation elongation factor 1 epsilon 1 | |
| Synonyms | AIMP3|P18 | |
| Cytomap | 6p24.3 | |
| Type of Gene | protein-coding | |
| Description | eukaryotic translation elongation factor 1 epsilon-1ARS-interacting multifunctional protein 3aminoacyl tRNA synthetase complex-interacting multifunctional protein 3multisynthase complex auxiliary component p18p18 component of aminoacyl-tRNA synthetase | |
| Modification date | 20200313 | |
| UniProtAcc | O43324 | |
| Child GO biological process term(s) under GO:0006412 |
| GO ID | GO term |
| GO:0006412 | Translation |
| Gene ontology of translaction factor with evidence of Inferred from Direct Assay (IDA) from Entrez |
| Partner | Gene | GO ID | GO term | PubMed ID |
| Hgene | EEF1E1 | GO:2000774 | positive regulation of cellular senescence | 25465621 |
| Inferred gene age of translation factor. |
| Gene | Inferred gene age group among (0 - 67.6], (67.6 - 355.7], (355.7 - 733], (733 - 1119.25], >1119.25 |
Top |
|
| We searched PubMed using 'EEF1E1[title] AND translation [title] AND human.' |
| Gene | Title | PMID |
| EEF1E1 | Absence of somatic mutation of a tumor suppressor gene eukaryotic translation elongation factor 1, epsilon-1 (EEF1E1), in common human cancers | 19024604 |
Top |
|
| Skipped exons in TCGA and GTEx based on Ensembl gene isoform structure. * Click on the image to open the UCSC genome browser with custom track showing this image in a new window. For more annotations, please visit our ExonSkipDB. |
 |
| Open reading frame (ORF) analsis of exon skipping events based on Ensembl gene isoform structure. * Click on the break point to see the gene structure around the break point region using the UCSC Genome Browser. |
| ENST | Exon skip start (DNA) | Exon Skip end (DNA) | ORF |
| Exon skipping position in the amino acid sequence. |
| ENST | Exon skip start (DNA) | Exon Skip end (DNA) | Len(transcript seq) | Exon skip start (mRNA) | Exon Skip end (mRNA) | Len(amino acid seq) | Exon skip start (AA) | Exon Skip end (AA) |
| Potentially (partially) lost protein functional features of UniProt. |
| UniProtAcc | Exon skip start (AA) | Exon Skip end (AA) | Function feature start (AA) | Function feature end (AA) | Functional feature type | Functional feature desc. |
Top |
|
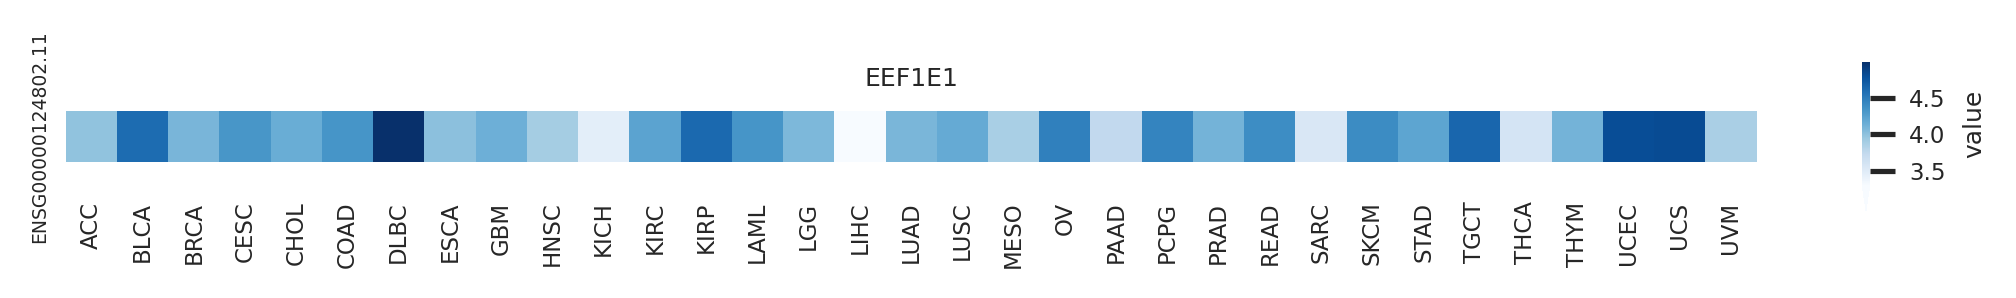
| Gene expression level across TCGA pancancer |
 |
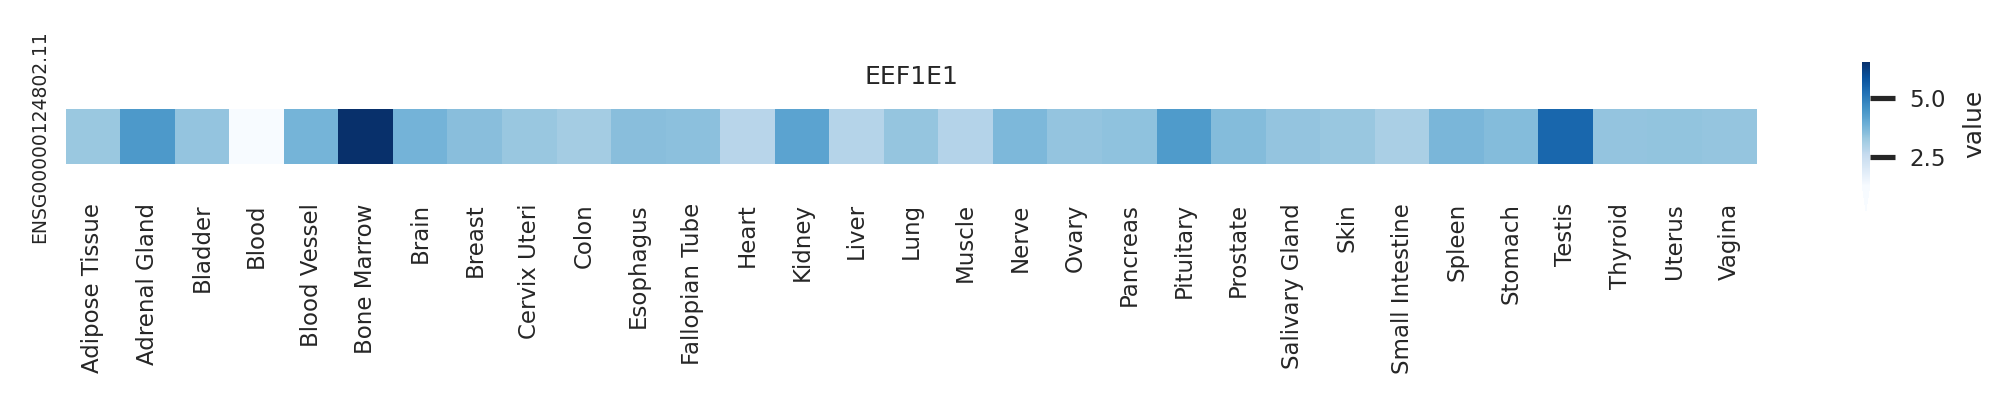
| Gene expression level across GTEx pantissue |
 |
| Expression level of gene isoforms across TCGA pancancer |
 |
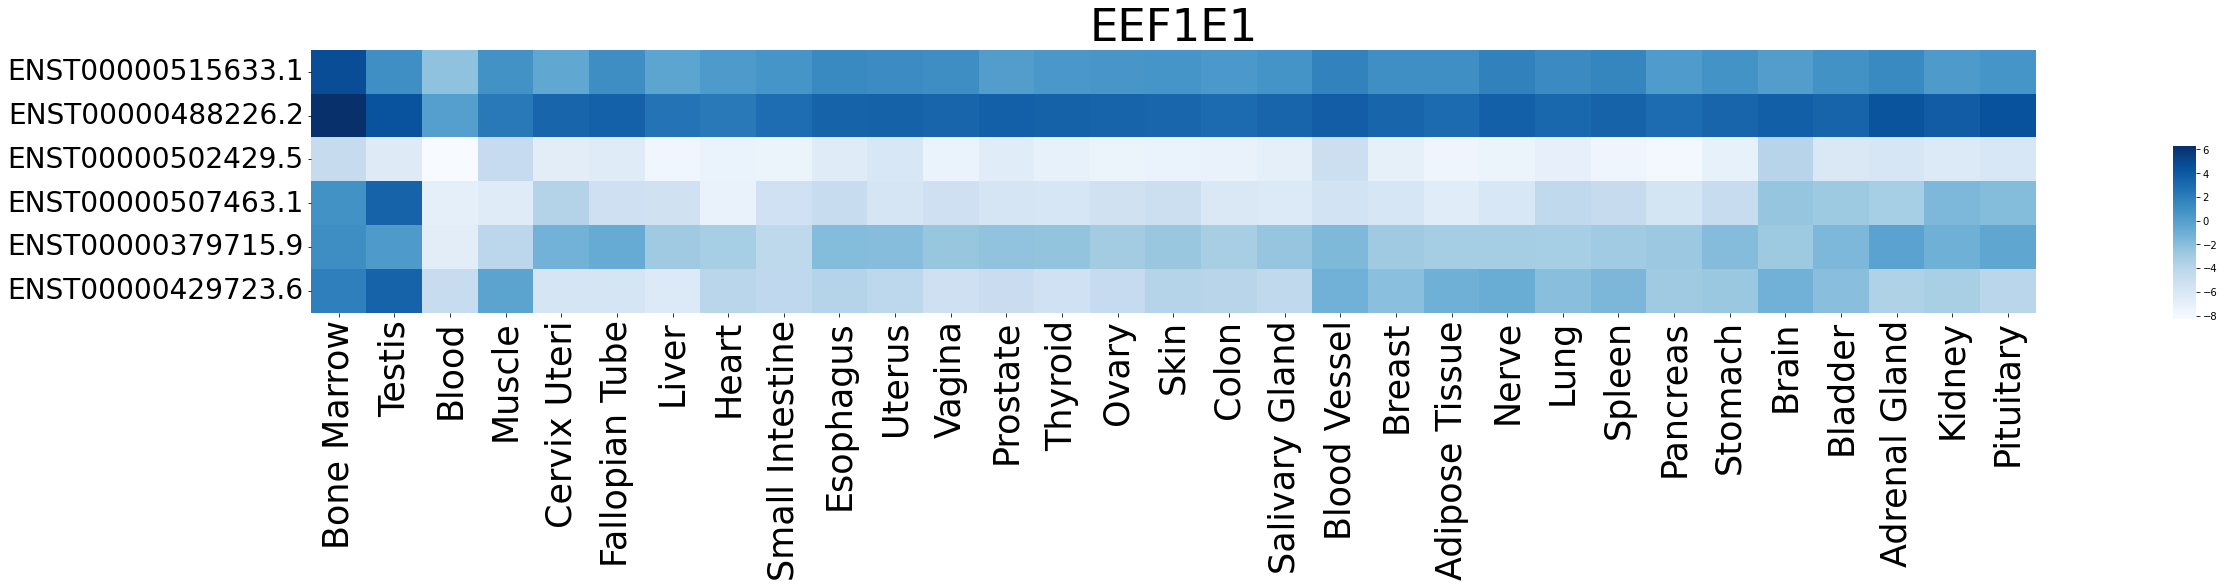
| Expression level of gene isoforms across GTEx pantissue |
 |
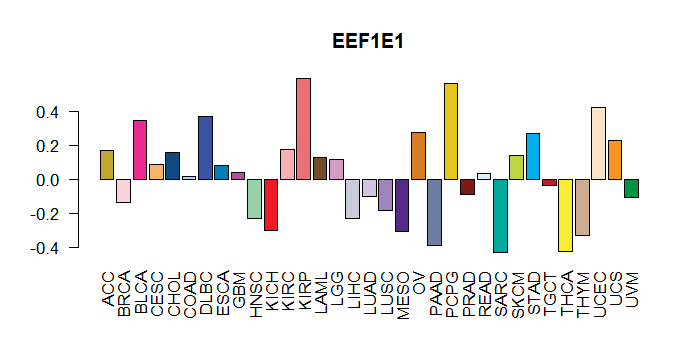
| Cancer(tissue) type-specific expression level of Translation factor using z-score distriution |
 |
| Differential expression between tumor and matched normal (in the cancer types with more than 10 matched samples) |
 |
| Cancer type | Translation factor | FC | adj.pval |
| LIHC | EEF1E1 | -1.3313725927284 | 0.000655351190157038 |
| PRAD | EEF1E1 | -1.69363995345609 | 0.000901881259820622 |
| LUSC | EEF1E1 | -2.00467456217075 | 1.65402843598856e-05 |
| LUAD | EEF1E1 | -5.69272597450276 | 2.37450106160718e-08 |
| BRCA | EEF1E1 | -2.07439081740763 | 3.45958438128459e-11 |
| KIRC | EEF1E1 | -3.27101773387926 | 8.11678117840128e-09 |
Top |
|
| Translation factor expression regulation through miRNA binding |
| Cancer type | Gene | miRNA | TargetScan binding score (Context++ score percentile) | Coefficient | Pvalue |
| Translation factor expression regulation through methylation in the promoter of Translation factor |
 |
| Cancer type | Gene | methyl group b | methyl group a | DEG pval | avg methyl in b | avg methyl in a | avg exp in b | avg exp in a |
| Translation factor expression regulation through methylation in the gene body of Translation factor (positive regulation) |
 |
| Cancer type | Gene | methyl group b | methyl group a | DEG pval | avg methyl in b | avg methyl in a | avg exp in b | avg exp in a |
| Translation factor expression regulation through copy number variation of Translation factor |
 |
| Cancer type | Gene | Coefficient | Pvalue |
| LGG | EEF1E1 | 0.10550476 | 0.006810022 |
Top |
|
| Strongly correlated genes belong to cellular important gene groups with EEF1E1 (coefficient>0.8, pval<0.05, node color based on FC between tumor and matched normal). Significantly associated important genes in the individual cancer types. * Cell metabolism gene: cell metabolism genes from REACTOME (black edge), IUPHAR: drug target genes from IUPHAR (blue edge), Kinase: human kinase genes (brown edge), CGC: cancer gene census genes (orange edge), TSG: tumor suppresor genes (purple edge), Epifactor: epigenetic factors (light blue edge), TF: transcription factors (green) |
 |
| Cancer type | Gene group | Translation factor | Correlated gene | Coefficient | Pvalue |
| COAD | IUPHAR | EEF1E1 | RIOK1 | 0.806033104 | 1.80E-76 |
| COAD | Kinase | EEF1E1 | RIOK1 | 0.806033104 | 1.80E-76 |
| KICH | Cell metabolism gene | EEF1E1 | CDK19 | 0.804546303 | 7.55E-22 |
| KICH | Cell metabolism gene | EEF1E1 | TXNDC12 | 0.805095642 | 6.74E-22 |
| KICH | Cell metabolism gene | EEF1E1 | ODC1 | 0.805718395 | 5.94E-22 |
| KICH | Cell metabolism gene | EEF1E1 | NPAS2 | 0.808394791 | 3.41E-22 |
| KICH | Cell metabolism gene | EEF1E1 | GLDC | 0.808589634 | 3.27E-22 |
| KICH | Cell metabolism gene | EEF1E1 | NAT2 | 0.808765004 | 3.15E-22 |
| KICH | Cell metabolism gene | EEF1E1 | GPC5 | 0.816642714 | 5.83E-23 |
| KICH | Cell metabolism gene | EEF1E1 | PIGF | 0.816776221 | 5.66E-23 |
| KICH | Cell metabolism gene | EEF1E1 | SCLY | 0.819383427 | 3.18E-23 |
| KICH | Cell metabolism gene | EEF1E1 | POLR3C | 0.820054375 | 2.74E-23 |
| KICH | Cell metabolism gene | EEF1E1 | SSR1 | 0.827117653 | 5.43E-24 |
| KICH | Cell metabolism gene | EEF1E1 | BPNT1 | 0.833334616 | 1.23E-24 |
| KICH | Cell metabolism gene | EEF1E1 | TYRP1 | 0.833614079 | 1.15E-24 |
| KICH | Cell metabolism gene | EEF1E1 | HS6ST2 | 0.845053998 | 6.28E-26 |
| KICH | Cell metabolism gene | EEF1E1 | AFMID | 0.847580281 | 3.20E-26 |
| KICH | Cell metabolism gene | EEF1E1 | PRODH | 0.84800326 | 2.86E-26 |
| KICH | Cell metabolism gene | EEF1E1 | NME7 | 0.85710547 | 2.25E-27 |
| KICH | Cell metabolism gene | EEF1E1 | GALNT14 | 0.872048694 | 2.32E-29 |
| KICH | CGC | EEF1E1 | USP44 | 0.801005138 | 1.54E-21 |
| KICH | CGC | EEF1E1 | FGFR4 | 0.803083949 | 1.02E-21 |
| KICH | CGC | EEF1E1 | EPHA7 | 0.811135919 | 1.91E-22 |
| KICH | CGC | EEF1E1 | SMARCE1 | 0.816021506 | 6.68E-23 |
| KICH | CGC | EEF1E1 | GPC5 | 0.816642714 | 5.83E-23 |
| KICH | CGC | EEF1E1 | SPOP | 0.830179145 | 2.63E-24 |
| KICH | Epifactor | EEF1E1 | USP44 | 0.801005138 | 1.54E-21 |
| KICH | Epifactor | EEF1E1 | NPAS2 | 0.808394791 | 3.41E-22 |
| KICH | Epifactor | EEF1E1 | BRE | 0.815082169 | 8.20E-23 |
| KICH | Epifactor | EEF1E1 | SMARCE1 | 0.816021506 | 6.68E-23 |
| KICH | Epifactor | EEF1E1 | SPOP | 0.830179145 | 2.63E-24 |
| KICH | Epifactor | EEF1E1 | HDAC2 | 0.831030418 | 2.15E-24 |
| KICH | Epifactor | EEF1E1 | DDX50 | 0.836529375 | 5.59E-25 |
| KICH | Epifactor | EEF1E1 | ANP32E | 0.84413627 | 7.99E-26 |
| KICH | Epifactor | EEF1E1 | HAT1 | 0.846468914 | 4.31E-26 |
| KICH | Epifactor | EEF1E1 | NSL1 | 0.855576341 | 3.49E-27 |
| KICH | IUPHAR | EEF1E1 | PTH2R | 0.800525585 | 1.70E-21 |
| KICH | IUPHAR | EEF1E1 | FGFR4 | 0.803083949 | 1.02E-21 |
| KICH | IUPHAR | EEF1E1 | CDK19 | 0.804546303 | 7.55E-22 |
| KICH | IUPHAR | EEF1E1 | ODC1 | 0.805718395 | 5.94E-22 |
| KICH | IUPHAR | EEF1E1 | PTGER1 | 0.80593623 | 5.68E-22 |
| KICH | IUPHAR | EEF1E1 | WNK4 | 0.806781883 | 4.77E-22 |
| KICH | IUPHAR | EEF1E1 | NR1H4 | 0.8107395 | 2.08E-22 |
| KICH | IUPHAR | EEF1E1 | EPHA7 | 0.811135919 | 1.91E-22 |
| KICH | IUPHAR | EEF1E1 | HUNK | 0.817020541 | 5.37E-23 |
| KICH | IUPHAR | EEF1E1 | SLC39A10 | 0.82164204 | 1.92E-23 |
| KICH | IUPHAR | EEF1E1 | HDAC2 | 0.831030418 | 2.15E-24 |
| KICH | IUPHAR | EEF1E1 | PREPL | 0.831823341 | 1.77E-24 |
| KICH | IUPHAR | EEF1E1 | LEPR | 0.835980514 | 6.41E-25 |
| KICH | IUPHAR | EEF1E1 | RBBP9 | 0.836412081 | 5.76E-25 |
| KICH | IUPHAR | EEF1E1 | KATNA1 | 0.840398594 | 2.11E-25 |
| KICH | IUPHAR | EEF1E1 | SLC12A1 | 0.841623405 | 1.54E-25 |
| KICH | IUPHAR | EEF1E1 | HAT1 | 0.846468914 | 4.31E-26 |
| KICH | IUPHAR | EEF1E1 | RIOK1 | 0.848804282 | 2.30E-26 |
| KICH | IUPHAR | EEF1E1 | GABRA2 | 0.851791177 | 1.01E-26 |
| KICH | IUPHAR | EEF1E1 | KCNJ16 | 0.854275304 | 5.05E-27 |
| KICH | IUPHAR | EEF1E1 | SLC35A1 | 0.861675876 | 5.88E-28 |
| KICH | IUPHAR | EEF1E1 | NEK11 | 0.872252937 | 2.17E-29 |
| KICH | Kinase | EEF1E1 | FGFR4 | 0.803083949 | 1.02E-21 |
| KICH | Kinase | EEF1E1 | CDK19 | 0.804546303 | 7.55E-22 |
| KICH | Kinase | EEF1E1 | WNK4 | 0.806781883 | 4.77E-22 |
| KICH | Kinase | EEF1E1 | EPHA7 | 0.811135919 | 1.91E-22 |
| KICH | Kinase | EEF1E1 | HUNK | 0.817020541 | 5.37E-23 |
| KICH | Kinase | EEF1E1 | RIOK1 | 0.848804282 | 2.30E-26 |
| KICH | Kinase | EEF1E1 | NEK11 | 0.872252937 | 2.17E-29 |
| KICH | TF | EEF1E1 | ZNF286A | 0.804372997 | 7.82E-22 |
| KICH | TF | EEF1E1 | TFAP2B | 0.804638081 | 7.41E-22 |
| KICH | TF | EEF1E1 | ZNF25 | 0.806272907 | 5.29E-22 |
| KICH | TF | EEF1E1 | TBP | 0.806688483 | 4.86E-22 |
| KICH | TF | EEF1E1 | NPAS2 | 0.808394791 | 3.41E-22 |
| KICH | TF | EEF1E1 | IRX2 | 0.808788404 | 3.14E-22 |
| KICH | TF | EEF1E1 | NR1H4 | 0.8107395 | 2.08E-22 |
| KICH | TF | EEF1E1 | SALL2 | 0.814373014 | 9.56E-23 |
| KICH | TF | EEF1E1 | ZNF883 | 0.820458224 | 2.50E-23 |
| KICH | TF | EEF1E1 | DZIP1 | 0.837402217 | 4.50E-25 |
| KICH | TF | EEF1E1 | FOXJ1 | 0.84298735 | 1.08E-25 |
| KICH | TSG | EEF1E1 | HACE1 | 0.803939235 | 8.54E-22 |
| KICH | TSG | EEF1E1 | CACNA2D3 | 0.804719677 | 7.28E-22 |
| KICH | TSG | EEF1E1 | NPAS2 | 0.808394791 | 3.41E-22 |
| KICH | TSG | EEF1E1 | SALL2 | 0.814373014 | 9.56E-23 |
| KICH | TSG | EEF1E1 | RASAL1 | 0.815170424 | 8.05E-23 |
| KICH | TSG | EEF1E1 | GPC5 | 0.816642714 | 5.83E-23 |
| KICH | TSG | EEF1E1 | OSCP1 | 0.81791827 | 4.40E-23 |
| KICH | TSG | EEF1E1 | SPOP | 0.830179145 | 2.63E-24 |
| KICH | TSG | EEF1E1 | CASC2 | 0.836076966 | 6.26E-25 |
| KICH | TSG | EEF1E1 | HRG | 0.845463903 | 5.63E-26 |
| KICH | TSG | EEF1E1 | CASC1 | 0.846407551 | 4.38E-26 |
| KICH | TSG | EEF1E1 | PRODH | 0.84800326 | 2.86E-26 |
| KICH | TSG | EEF1E1 | APITD1 | 0.853488448 | 6.31E-27 |
| KICH | TSG | EEF1E1 | XRCC5 | 0.853880954 | 5.65E-27 |
| KICH | TSG | EEF1E1 | IFT88 | 0.895013189 | 5.85E-33 |
| UVM | Cell metabolism gene | EEF1E1 | GLO1 | 0.832590655 | 1.04E-21 |
| UVM | Epifactor | EEF1E1 | HMGN4 | 0.822575391 | 8.22E-21 |
Top |
|
| Protein 3D structure Visit iCn3D. |
Top |
|
| Protein-protein interaction networks * Overlap between up-regulated DEGs (log2FC<-1 and adj.P<0.05) and STRING PPI network (center: Translation factor, node: DEGs, edges: weighted by -log2(adj.P)) |
| Overlap between down-regulated DEGs (log2FC>1 and adj.P<0.05) and STRING PPI network (center: Translation factor, node: DEGs, edges: weighted by -log2(adj.P)) |
 * Edge colors based on TCGA cancer types. |
| * Overlap between DEGs (log2FC>1 and adj.P<0.05) and STRING PPI network per cancer (center: Translation factor, node: DEGs, node color: log2FC, edges: weighted by -log2(adj.P)) |
| Cancer type | Translation factor | Interacting protein coding gene | FC | adj.pval |
| Protein-protein interactors with this translation factor (BIOGRID-3.4.160) |
| PPI interactors with EEF1E1 |
| AIMP2, EPRS, KARS, IARS, DARS, MARS, QARS, RARS, AIMP1, ITGA4, gag, DNAJA1, EIF2S1, EIF4G1, RPL15, RPL18, RPL7A, RPLP0, EIF2S3, HNRNPA2B1, IQGAP1, CCAR2, RPL13, RPL21, RPL23A, RPL24, RPL26, RPL27A, RPL36, HUWE1, CALCOCO2, NAT9, BLK, SDCBP, ATP6V1A, ATP6V1B2, CIAPIN1, TWF1, UBA1, LARS, RNASEH2C, MED4, PKN2, RAF1, STRN, CHAMP1, Atp7a, Junb, Sdccag8, Dlgap4, MCM2, COX15, DLD, HSD17B10, PDHA1, SOAT1, VDAC1, HIF1AN, EGLN3, AAR2, PIH1D1, EFTUD2, HEXIM1, MEPCE, LARP7, SNAI1, RECQL4, KRT17, KIAA1429, HIST1H4A, MAP3K14, P2RY6, MAB21L2, ITFG1, ARAF, NFX1, WWP2, PLEKHA4, ENG, HCVgp1, ZC3H18, MTA2, CIT, ARHGAP29, CDC42, Apc2, JMJD6, UFL1, DDRGK1, MARCKS, UBQLN1, FBXW7, CTSL, nsp13, nsp5, ORF10, ORF3a, TAX1BP1, |
Top |
|
| Clinically associated variants from ClinVar. |
| Gene | Chr | Position | RefSeq | VarSeq | RefSeeq | VarType | Pathogenic | Disease | VarInfo |
| nsSNVs with sample frequency (size of circle) from TCGA 33 cancers. |
 |
| SNVs and Indels |
| Gene | Cancer type | Chromosome | Start | End | RefSeeq | MutSeq | Mutation type | AAchange | # samples |
| EEF1E1 | LIHC | chr6 | 8090388 | 8090388 | A | - | Frame_Shift_Del | p.S139fs | 3 |
| EEF1E1 | UCS | chr6 | 8090502 | 8090502 | A | G | Missense_Mutation | p.Y101H | 3 |
| EEF1E1 | LUAD | chr6 | 8097553 | 8097553 | C | - | Frame_Shift_Del | p.V79fs | 3 |
| EEF1E1 | PRAD | chr6 | 8097597 | 8097597 | G | A | Missense_Mutation | p.T64I | 3 |
| EEF1E1 | UCEC | chr6 | 8097660 | 8097660 | C | T | Missense_Mutation | p.G43E | 3 |
| EEF1E1 | LIHC | chr6 | 8097609 | 8097609 | A | G | Missense_Mutation | p.L60S | 2 |
| EEF1E1 | CESC | chr6 | 8097678 | 8097678 | T | C | Missense_Mutation | 2 | |
| EEF1E1 | UCEC | chr6 | 8097669 | 8097669 | C | A | Missense_Mutation | p.S40I | 2 |
| EEF1E1 | UCEC | chr6 | 8102693 | 8102693 | T | G | Missense_Mutation | p.K21T | 2 |
| EEF1E1 | STAD | chr6 | 8097577 | 8097577 | C | T | Missense_Mutation | p.V71I | 2 |
| EEF1E1 | STAD | chr6 | 8097522 | 8097522 | T | C | Missense_Mutation | p.N89S | 2 |
| EEF1E1 | ESCA | chr6 | 8090462 | 8090462 | G | T | Missense_Mutation | p.T114K | 2 |
| EEF1E1 | STAD | chr6 | 8097536 | 8097536 | C | T | Silent | p.G84G | 2 |
| EEF1E1 | KIRC | chr6 | 8080190 | 8080190 | G | A | Missense_Mutation | p.P153L | 2 |
| EEF1E1 | SARC | chr6 | 8090472 | 8090472 | A | G | Missense_Mutation | 2 | |
| EEF1E1 | SKCM | chr6 | 8097578 | 8097578 | G | A | Silent | p.I70I | 2 |
| EEF1E1 | LIHC | chr6 | 8097609 | 8097609 | A | G | Missense_Mutation | 2 | |
| EEF1E1 | SKCM | chr6 | 8097525 | 8097525 | T | C | Missense_Mutation | p.K88R | 2 |
| EEF1E1 | UCEC | chr6 | 8090499 | 8090499 | G | T | Missense_Mutation | p.L102I | 2 |
| EEF1E1 | SKCM | chr6 | 8080164 | 8080164 | C | A | Missense_Mutation | p.V162F | 1 |
| EEF1E1 | HNSC | chr6 | 8102739 | 8102739 | C | G | Missense_Mutation | 1 | |
| EEF1E1 | CESC | chr6 | 8097678 | 8097678 | T | C | Missense_Mutation | p.N37S | 1 |
| EEF1E1 | SKCM | chr6 | 8102719 | 8102719 | C | T | Silent | p.K12K | 1 |
| EEF1E1 | HNSC | chr6 | 8102739 | 8102739 | C | G | Missense_Mutation | p.E6Q | 1 |
| EEF1E1 | LUAD | chr6 | 8097506 | 8097506 | C | G | Silent | p.L94L | 1 |
| EEF1E1 | CHOL | chr6 | 8097530 | 8097530 | G | T | Silent | 1 | |
| EEF1E1 | STAD | chr6 | 8097577 | 8097577 | C | T | Missense_Mutation | 1 | |
| EEF1E1 | HNSC | chr6 | 8080226 | 8080226 | T | C | Missense_Mutation | p.N141S | 1 |
| EEF1E1 | UCS | chr6 | 8090502 | 8090502 | A | G | Missense_Mutation | 1 | |
| EEF1E1 | LUAD | chr6 | 8080245 | 8080245 | C | G | Missense_Mutation | p.E135Q | 1 |
| EEF1E1 | CHOL | chr6 | 8097530 | 8097530 | G | T | Silent | p.S86S | 1 |
| EEF1E1 | HNSC | chr6 | 8102741 | 8102741 | G | A | Missense_Mutation | p.A5V | 1 |
| EEF1E1 | ESCA | chr6 | 8080173 | 8080173 | G | T | Missense_Mutation | p.L159M | 1 |
| EEF1E1 | HNSC | chr6 | 8102742 | 8102742 | C | A | Missense_Mutation | p.A5S | 1 |
| EEF1E1 | HNSC | chr6 | 8102741 | 8102742 | GC | AA | Missense_Mutation | p.A5L | 1 |
| EEF1E1 | BLCA | chr6 | 8090438 | 8090438 | T | C | Missense_Mutation | 1 | |
| EEF1E1 | PRAD | chr6 | 8097604 | 8097604 | C | A | Missense_Mutation | p.G62W | 1 |
| EEF1E1 | ESCA | chr6 | 8090462 | 8090462 | G | T | Missense_Mutation | 1 | |
| EEF1E1 | STAD | chr6 | 8090483 | 8090483 | T | C | Missense_Mutation | p.Y107C | 1 |
| EEF1E1 | BLCA | chr6 | 8080128 | 8080128 | G | T | Missense_Mutation | 1 | |
| EEF1E1 | ESCA | chr6 | 8080173 | 8080173 | G | T | Missense_Mutation | 1 | |
| EEF1E1 | TGCT | chr6 | 8090389 | 8090389 | A | T | Missense_Mutation | 1 | |
| EEF1E1 | KIRP | chr6 | 8102676 | 8102676 | C | A | Nonsense_Mutation | 1 | |
| EEF1E1 | BLCA | chr6 | 8080237 | 8080237 | C | A | Missense_Mutation | 1 | |
| EEF1E1 | ESCA | chr6 | 8079689 | 8079689 | C | T | RNA | . | 1 |
| EEF1E1 | THYM | chr6 | 8080129 | 8080129 | G | A | Silent | 1 | |
| EEF1E1 | BLCA | chr6 | 8080237 | 8080237 | C | A | Missense_Mutation | p.E137D | 1 |
| EEF1E1 | HNSC | chr6 | 8102741 | 8102741 | G | A | Missense_Mutation | 1 | |
| EEF1E1 | LIHC | chr6 | 8090503 | 8090503 | T | C | Silent | p.S100S | 1 |
| EEF1E1 | CESC | chr6 | 8102777 | 8102777 | G | A | Missense_Mutation | 1 | |
| EEF1E1 | SKCM | chr6 | 8080218 | 8080218 | G | A | Missense_Mutation | p.R144C | 1 |
| EEF1E1 | HNSC | chr6 | 8102742 | 8102742 | C | A | Missense_Mutation | 1 |
| Copy number variation (CNV) of EEF1E1 * Click on the image to open the original image in a new window. |
 |
| Fusion gene breakpoints (product of the structural variants (SVs)) across EEF1E1 * Click on the image to open the UCSC genome browser with custom track showing this image in a new window. |
 |
| Fusion genes with this translation factor from FusionGDB2.0. |
| FusionGDB2 ID | Disease | Sample | Hgene | Hchr | Hbp | Hstrand | Tgene | Tchr | Tbp | Tstrand |
| 78297 | SKCM | TCGA-EE-A3JI-06A | CDYL | chr6 | 4892613 | + | EEF1E1 | chr6 | 8097700 | - |
| 101817 | BRCA | TCGA-A8-A0AD-01A | EEF1E1 | chr6 | 8095611 | - | EYS | chr6 | 66205886 | - |
| 78297 | COAD | TCGA-A6-6654-01A | GMDS | chr6 | 2116005 | - | EEF1E1 | chr6 | 8097700 | - |
| 78297 | SARC | TCGA-DX-A1L2-01A | INPP4A | chr2 | 99193606 | + | EEF1E1 | chr6 | 8080263 | - |
| 78297 | BRCA | TCGA-C8-A8HQ-01A | PSMG4 | chr6 | 3259430 | - | EEF1E1 | chr6 | 8080263 | - |
| 78313 | GBM | TCGA-06-5412-01A | RREB1 | chr6 | 7108293 | + | EEF1E1 | chr6 | 8097700 | - |
Top |
|
| Kaplan-Meier plots with logrank tests of overall survival (OS) |
 |
| Cancer type | Translation factor | Coefficent | Hazard ratio | Wald test pval | Likelihool ratio pval | Logrank test pval | # samples |
Top |
|
| Differential gene expression between female and male. (Wilcoxon test, pval<0.05) |
 |
| Cancer type | Translation factor | pval | adj.p |
| LUAD | EEF1E1 | 0.00165993610323977 | 0.046 |
| TGCT | EEF1E1 | 0.0309006785983058 | 0.83 |
Top |
|
| Differential gene expression between young and old age groups (Wilcoxon test, pval<0.05) |
 |
| Cancer type | Translation factor | pval | adj.p |
| LUSC | EEF1E1 | 0.0219604599306282 | 0.66 |
| KIRC | EEF1E1 | 0.00350483247531413 | 0.11 |
| PAAD | EEF1E1 | 0.00285065312666413 | 0.091 |
| HNSC | EEF1E1 | 0.00184673890363365 | 0.061 |
Top |
|
| Drugs targeting genes involved in this translation factor. (DrugBank Version 5.1.8 2021-05-08) |
| UniProtAcc | DrugBank ID | Drug name | Drug activity | Drug type | Drug status |
Top |
|
| Diseases associated with this translation factor. (DisGeNet 4.0) |
| Disease ID | Disease Name | # PubMeds | Disease source |
(UTHealth)
Web File Viewing | Emergency Information |Campus Carry|Site Policies