
|
||||||
|

Translation Factor: PUM3 (NCBI Gene ID:9933) |
|
 Gene Summary Gene Summary |
| Gene Information | Gene Name: PUM3 | Gene ID: 9933 | Gene Symbol | PUM3 | Gene ID | 9933 |
| Gene Name | pumilio RNA binding family member 3 | |
| Synonyms | HA-8|HLA-HA8|KIAA0020|PEN|PUF-A|PUF6|XTP5 | |
| Cytomap | 9p24.2 | |
| Type of Gene | protein-coding | |
| Description | pumilio homolog 3HBV X-transactivated gene 5 proteinHBV XAg-transactivated protein 5minor histocompatibility antigen HA-8penguin homologprotein 5 transactivated by hepatitis B virus X antigen (HBxAg) | |
| Modification date | 20200313 | |
| UniProtAcc | Q15397 | |
| Child GO biological process term(s) under GO:0006412 |
| GO ID | GO term |
| GO:0006417 | Regulation of translation |
| GO:0006412 | Translation |
| Gene ontology of translaction factor with evidence of Inferred from Direct Assay (IDA) from Entrez |
| Partner | Gene | GO ID | GO term | PubMed ID |
| Inferred gene age of translation factor. |
| Gene | Inferred gene age group among (0 - 67.6], (67.6 - 355.7], (355.7 - 733], (733 - 1119.25], >1119.25 |
| PUM3 | >1119.25 |
Top |
|
| We searched PubMed using 'PUM3[title] AND translation [title] AND human.' |
| Gene | Title | PMID |
| PUM3 | . | . |
Top |
|
| Skipped exons in TCGA and GTEx based on Ensembl gene isoform structure. * Click on the image to open the UCSC genome browser with custom track showing this image in a new window. For more annotations, please visit our ExonSkipDB. |
 |
| Open reading frame (ORF) analsis of exon skipping events based on Ensembl gene isoform structure. * Click on the break point to see the gene structure around the break point region using the UCSC Genome Browser. |
| ENST | Exon skip start (DNA) | Exon Skip end (DNA) | ORF |
| ENST00000397885 | 2820017 | 2820098 | In-frame |
| ENST00000397885 | 2823780 | 2823834 | In-frame |
| ENST00000397885 | 2824716 | 2824815 | In-frame |
| ENST00000397885 | 2827072 | 2827151 | Frame-shift |
| ENST00000397885 | 2831250 | 2831344 | Frame-shift |
| ENST00000397885 | 2838425 | 2838517 | 3UTR-3CDS |
| Exon skipping position in the amino acid sequence. |
| ENST | Exon skip start (DNA) | Exon Skip end (DNA) | Len(transcript seq) | Exon skip start (mRNA) | Exon Skip end (mRNA) | Len(amino acid seq) | Exon skip start (AA) | Exon Skip end (AA) |
| Potentially (partially) lost protein functional features of UniProt. |
| UniProtAcc | Exon skip start (AA) | Exon Skip end (AA) | Function feature start (AA) | Function feature end (AA) | Functional feature type | Functional feature desc. |
Top |
|
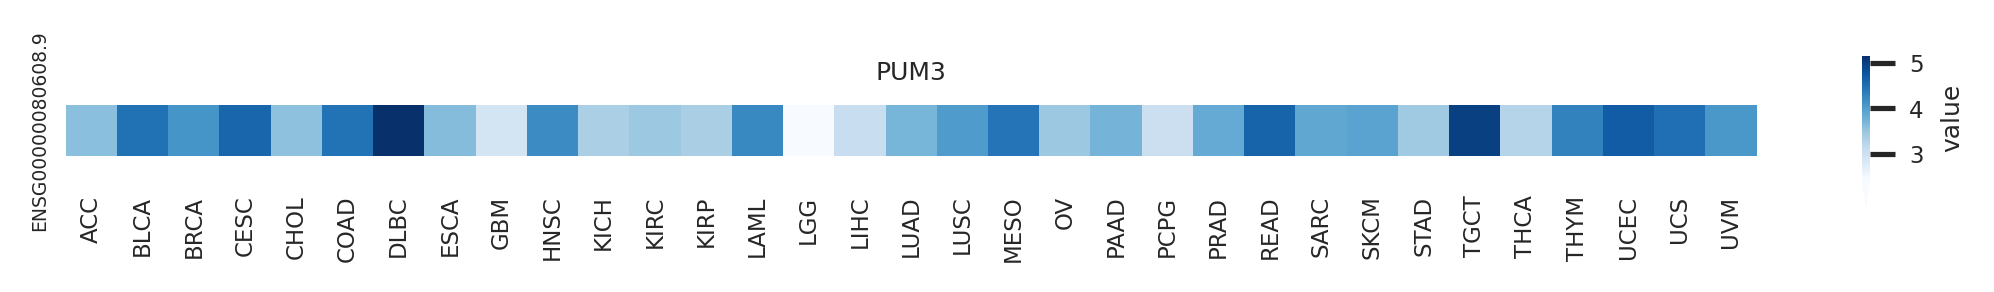
| Gene expression level across TCGA pancancer |
 |
| Gene expression level across GTEx pantissue |
 |
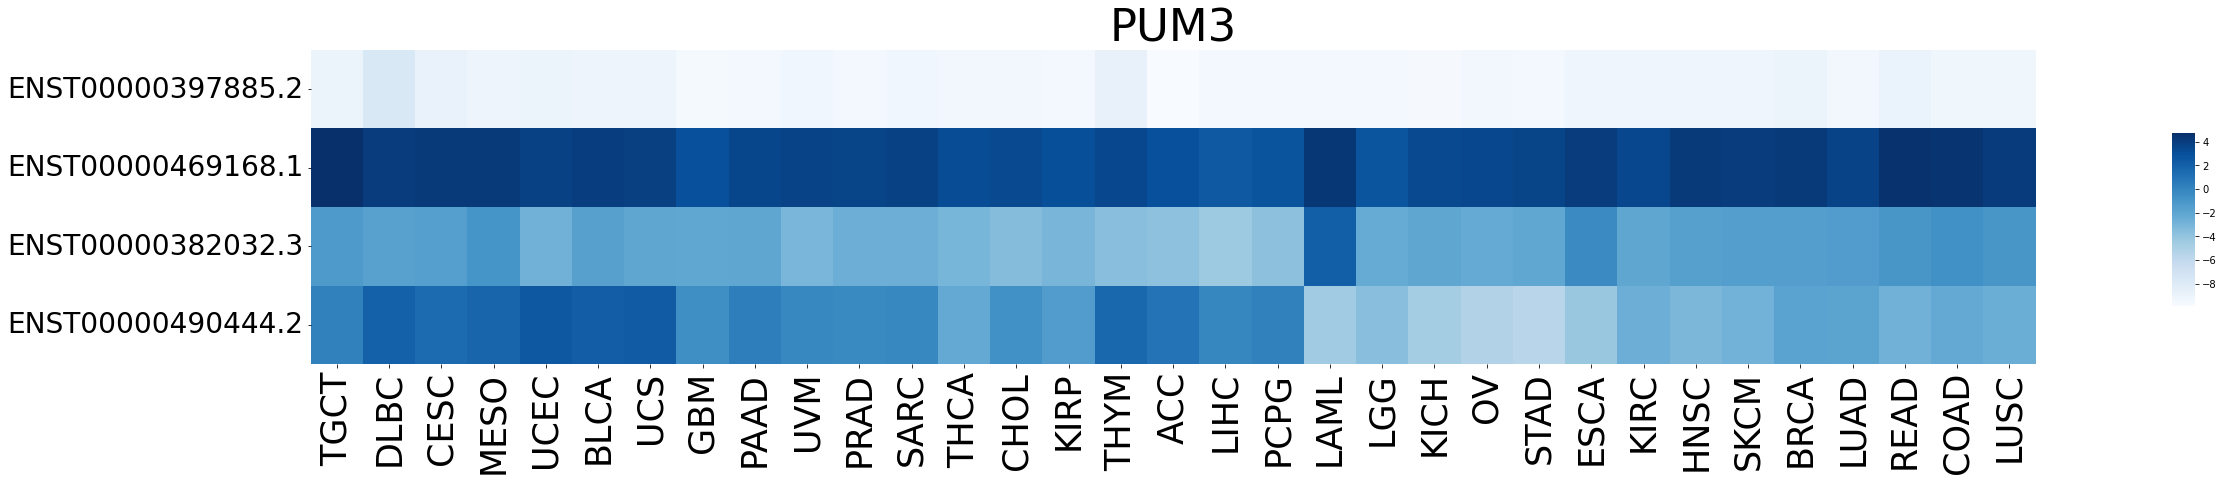
| Expression level of gene isoforms across TCGA pancancer |
 |
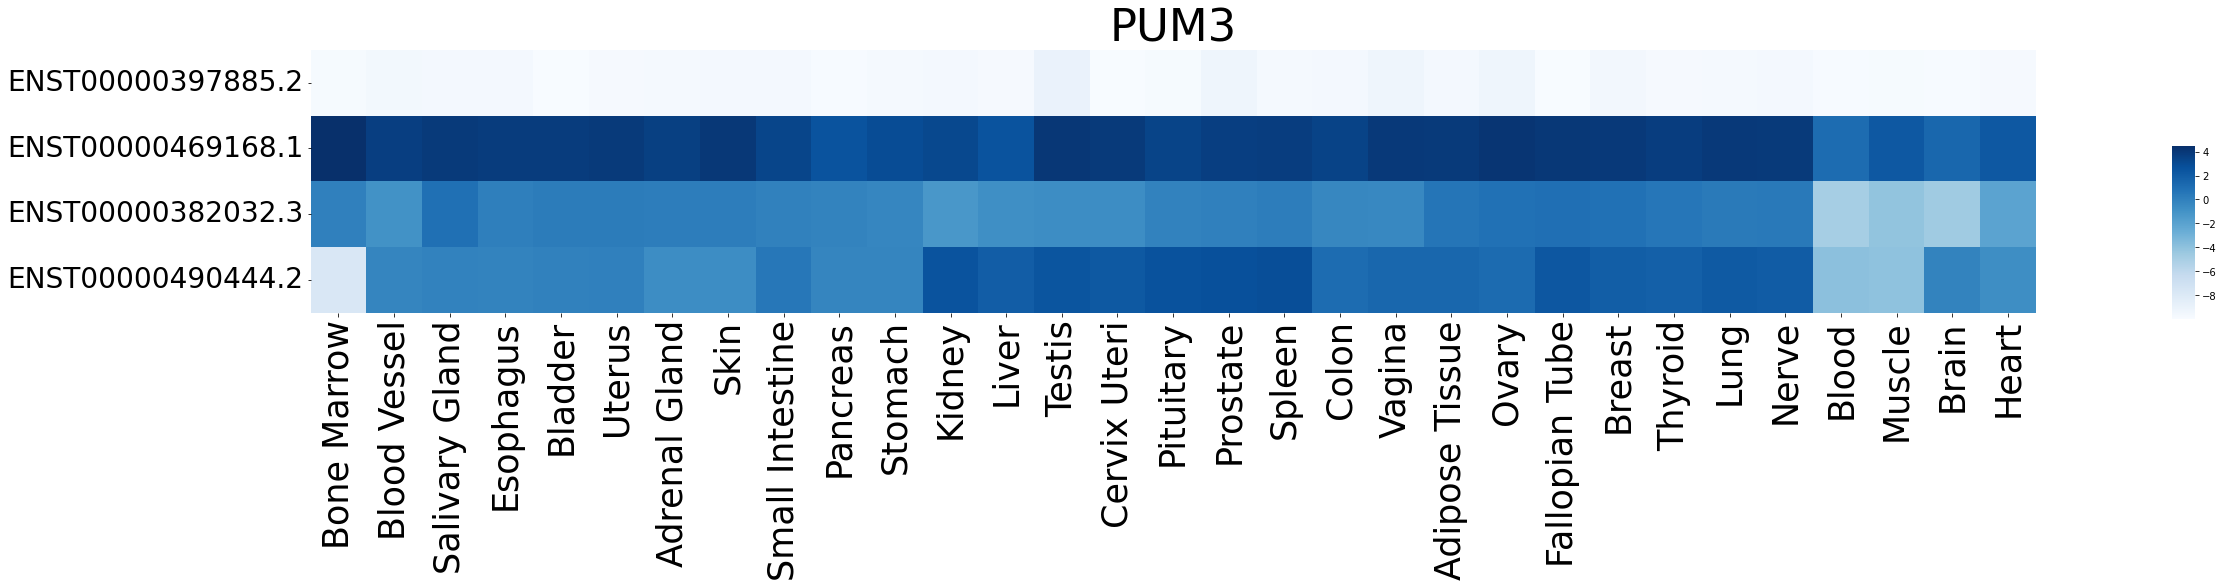
| Expression level of gene isoforms across GTEx pantissue |
 |
| Cancer(tissue) type-specific expression level of Translation factor using z-score distriution |
| Differential expression between tumor and matched normal (in the cancer types with more than 10 matched samples) |
| Cancer type | Translation factor | FC | adj.pval |
Top |
|
| Translation factor expression regulation through miRNA binding |
| Cancer type | Gene | miRNA | TargetScan binding score (Context++ score percentile) | Coefficient | Pvalue |
| Translation factor expression regulation through methylation in the promoter of Translation factor |
| Cancer type | Gene | methyl group b | methyl group a | DEG pval | avg methyl in b | avg methyl in a | avg exp in b | avg exp in a |
| Translation factor expression regulation through methylation in the gene body of Translation factor (positive regulation) |
| Cancer type | Gene | methyl group b | methyl group a | DEG pval | avg methyl in b | avg methyl in a | avg exp in b | avg exp in a |
| Translation factor expression regulation through copy number variation of Translation factor |
| Cancer type | Gene | Coefficient | Pvalue |
Top |
|
| Strongly correlated genes belong to cellular important gene groups with PUM3 (coefficient>0.8, pval<0.05, node color based on FC between tumor and matched normal). Significantly associated important genes in the individual cancer types. * Cell metabolism gene: cell metabolism genes from REACTOME (black edge), IUPHAR: drug target genes from IUPHAR (blue edge), Kinase: human kinase genes (brown edge), CGC: cancer gene census genes (orange edge), TSG: tumor suppresor genes (purple edge), Epifactor: epigenetic factors (light blue edge), TF: transcription factors (green) |
| Cancer type | Gene group | Translation factor | Correlated gene | Coefficient | Pvalue |
Top |
|
| Protein 3D structure Visit iCn3D. |
Top |
|
| Protein-protein interaction networks * Overlap between up-regulated DEGs (log2FC<-1 and adj.P<0.05) and STRING PPI network (center: Translation factor, node: DEGs, edges: weighted by -log2(adj.P)) |
 |
| Overlap between down-regulated DEGs (log2FC>1 and adj.P<0.05) and STRING PPI network (center: Translation factor, node: DEGs, edges: weighted by -log2(adj.P)) |
 |
 * Edge colors based on TCGA cancer types. |
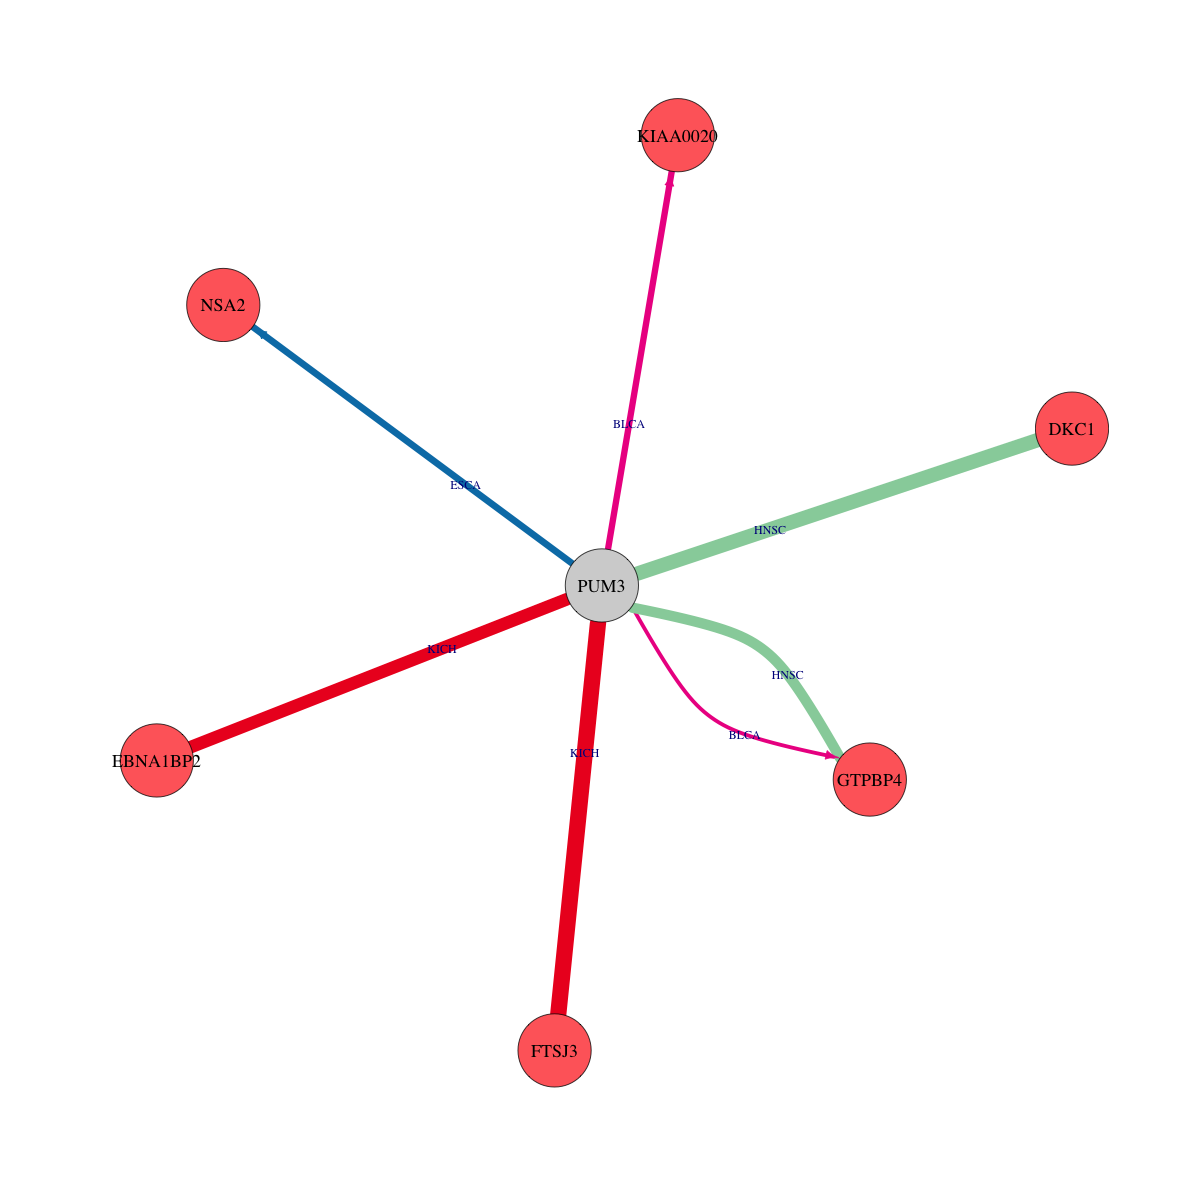
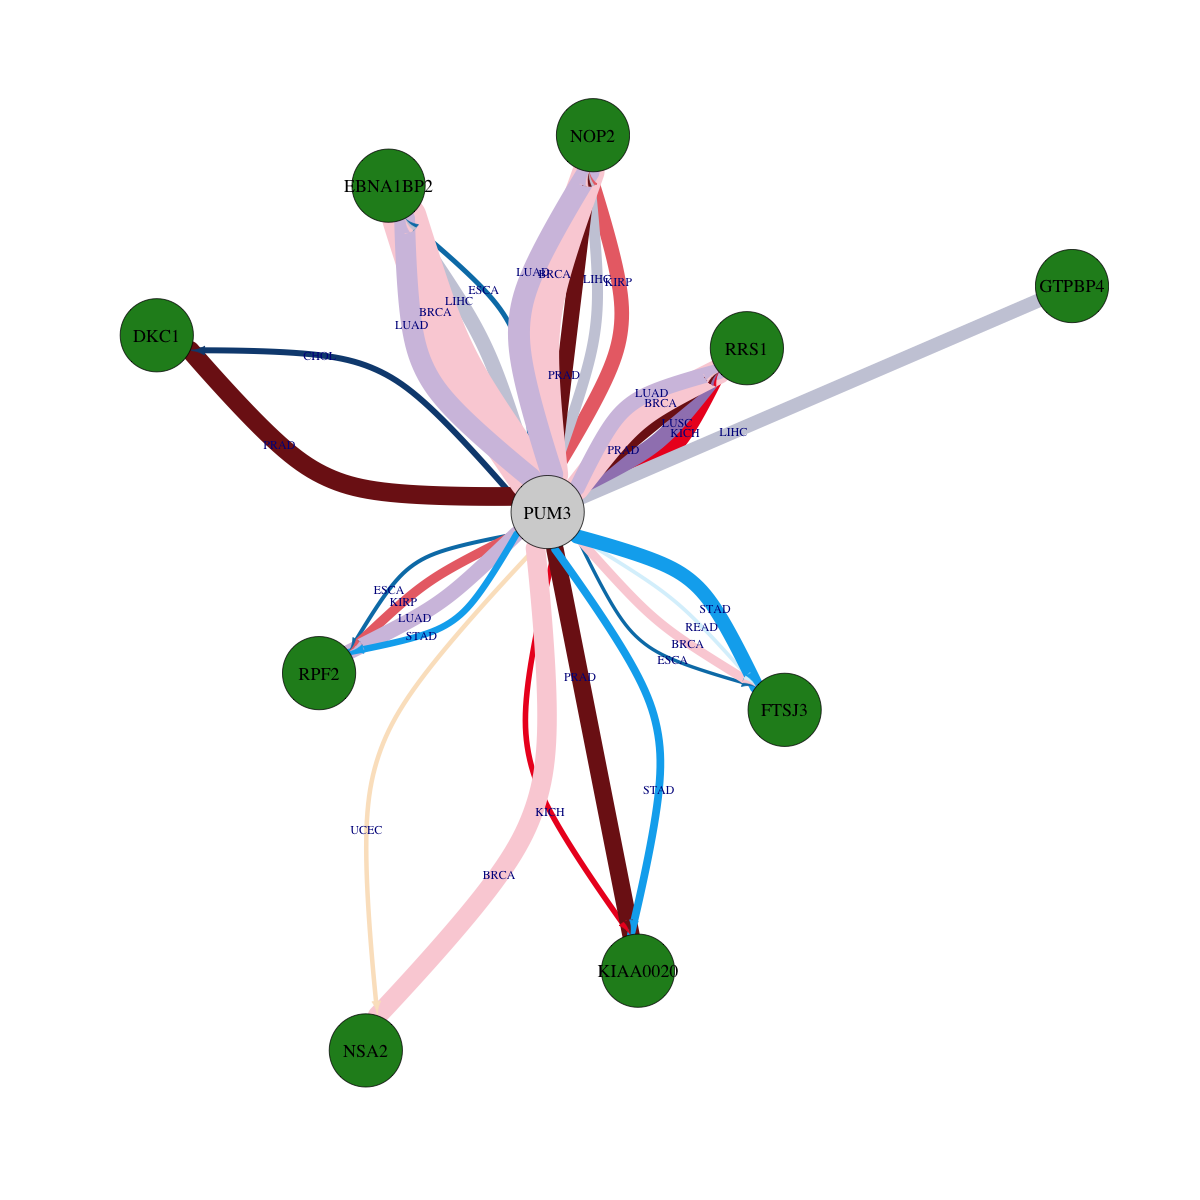
| * Overlap between DEGs (log2FC>1 and adj.P<0.05) and STRING PPI network per cancer (center: Translation factor, node: DEGs, node color: log2FC, edges: weighted by -log2(adj.P)) |
 |
| Cancer type | Translation factor | Interacting protein coding gene | FC | adj.pval |
| KIRP | PUM3 | RPF2 | -1.04063766175716 | 0.000147277489304543 |
| BRCA | PUM3 | FTSJ3 | -3.46913955088154 | 0.000242834408791295 |
| STAD | PUM3 | KIAA0020 | -1.69454826268421 | 0.000772962812334299 |
| ESCA | PUM3 | NSA2 | 2.19480328019754 | 0.001953125 |
| STAD | PUM3 | RPF2 | -3.57344006267822 | 0.00222697434946895 |
| BLCA | PUM3 | KIAA0020 | 1.85141671195199 | 0.002838134765625 |
| CHOL | PUM3 | DKC1 | -6.50407764894012 | 0.00390625 |
| KICH | PUM3 | KIAA0020 | -4.65644304833653 | 0.00557881593704224 |
| ESCA | PUM3 | EBNA1BP2 | -1.99200120964051 | 0.009765625 |
| UCEC | PUM3 | NSA2 | -2.81369532981968 | 0.015625 |
| ESCA | PUM3 | RPF2 | -2.65741878498225 | 0.0244140625 |
| BLCA | PUM3 | GTPBP4 | 1.58690285996278 | 0.0289306640625 |
| READ | PUM3 | FTSJ3 | -3.56153245977502 | 0.03125 |
| ESCA | PUM3 | FTSJ3 | -2.37306570439978 | 0.0419921875 |
| BRCA | PUM3 | RRS1 | -2.2702131904696 | 1.0192092641316e-10 |
| BRCA | PUM3 | EBNA1BP2 | -6.67569914915961 | 1.14170217447768e-18 |
| KIRP | PUM3 | NOP2 | -2.37716112616425 | 1.33963571500536e-06 |
| BRCA | PUM3 | NSA2 | -1.68478905261304 | 1.44885490954951e-08 |
| LUAD | PUM3 | NOP2 | -2.13082564857828 | 1.55042044095848e-09 |
| PRAD | PUM3 | RRS1 | -2.15065011106168 | 1.61692926153045e-05 |
| HNSC | PUM3 | DKC1 | 2.50432079402404 | 1.62206470122328e-06 |
| BRCA | PUM3 | NOP2 | -2.05576655678149 | 1.65750353866924e-13 |
| STAD | PUM3 | FTSJ3 | -1.61954756070611 | 2.00420618057251e-06 |
| LIHC | PUM3 | GTPBP4 | -1.61937717479796 | 2.46746298874691e-06 |
| KICH | PUM3 | FTSJ3 | 1.78589325244141 | 2.98023223876953e-07 |
| PRAD | PUM3 | DKC1 | -4.24738647635683 | 2.99790840508272e-08 |
| LUSC | PUM3 | RRS1 | -5.00289410595089 | 3.01351753286067e-07 |
| LIHC | PUM3 | NOP2 | -1.54502717645883 | 3.75678762034075e-05 |
| PRAD | PUM3 | NOP2 | -1.36514441550332 | 4.21699092476427e-07 |
| LUAD | PUM3 | EBNA1BP2 | -9.21983506279797 | 4.60205959480617e-09 |
| LUAD | PUM3 | RRS1 | -2.65727117880085 | 5.24732369463512e-07 |
| KICH | PUM3 | RRS1 | -3.53304422439471 | 5.96046447753906e-07 |
| HNSC | PUM3 | GTPBP4 | 2.02268965512305 | 6.75183794101032e-05 |
| LUAD | PUM3 | RPF2 | -1.96789094905851 | 7.82757566601107e-07 |
| KICH | PUM3 | EBNA1BP2 | 2.41205887435955 | 8.16583633422851e-06 |
| PRAD | PUM3 | KIAA0020 | -5.70089969399098 | 9.70835898507786e-08 |
| LIHC | PUM3 | EBNA1BP2 | -9.24832970918865 | 9.87002535347663e-07 |
| Protein-protein interactors with this translation factor (BIOGRID-3.4.160) |
| PPI interactors with PUM3 |
Top |
|
| Clinically associated variants from ClinVar. |
| Gene | Chr | Position | RefSeq | VarSeq | RefSeeq | VarType | Pathogenic | Disease | VarInfo |
| PUM3 | chr9 | 2811522 | T | A | single_nucleotide_variant | Benign | not_provided | SO:0001583|missense_variant | SO:0001583|missense_variant |
| PUM3 | chr9 | 2820046 | G | C | single_nucleotide_variant | Benign | not_provided | SO:0001583|missense_variant | SO:0001583|missense_variant |
| PUM3 | chr9 | 2829836 | T | C | single_nucleotide_variant | Benign | not_provided | SO:0001583|missense_variant | SO:0001583|missense_variant |
| nsSNVs with sample frequency (size of circle) from TCGA 33 cancers. |
| SNVs and Indels |
| Gene | Cancer type | Chromosome | Start | End | RefSeeq | MutSeq | Mutation type | AAchange | # samples |
| Copy number variation (CNV) of PUM3 * Click on the image to open the original image in a new window. |
 |
| Fusion gene breakpoints (product of the structural variants (SVs)) across PUM3 * Click on the image to open the UCSC genome browser with custom track showing this image in a new window. |
 |
| Fusion genes with this translation factor from FusionGDB2.0. |
| FusionGDB2 ID | Disease | Sample | Hgene | Hchr | Hbp | Hstrand | Tgene | Tchr | Tbp | Tstrand |
Top |
|
| Kaplan-Meier plots with logrank tests of overall survival (OS) |
| Cancer type | Translation factor | Coefficent | Hazard ratio | Wald test pval | Likelihool ratio pval | Logrank test pval | # samples |
Top |
|
| Differential gene expression between female and male. (Wilcoxon test, pval<0.05) |
| Cancer type | Translation factor | pval | adj.p |
Top |
|
| Differential gene expression between young and old age groups (Wilcoxon test, pval<0.05) |
| Cancer type | Translation factor | pval | adj.p |
Top |
|
| Drugs targeting genes involved in this translation factor. (DrugBank Version 5.1.8 2021-05-08) |
| UniProtAcc | DrugBank ID | Drug name | Drug activity | Drug type | Drug status |
Top |
|
| Diseases associated with this translation factor. (DisGeNet 4.0) |
| Disease ID | Disease Name | # PubMeds | Disease source |
(UTHealth)
Web File Viewing | Emergency Information |Campus Carry|Site Policies