
|
||||||
|

Translation Factor: EIF4EBP1 (NCBI Gene ID:1978) |
|
 Gene Summary Gene Summary |
| Gene Information | Gene Name: EIF4EBP1 | Gene ID: 1978 | Gene Symbol | EIF4EBP1 | Gene ID | 1978 |
| Gene Name | eukaryotic translation initiation factor 4E binding protein 1 | |
| Synonyms | 4E-BP1|4EBP1|BP-1|PHAS-I | |
| Cytomap | 8p11.23 | |
| Type of Gene | protein-coding | |
| Description | eukaryotic translation initiation factor 4E-binding protein 1eIF4E-binding protein 1phosphorylated heat- and acid-stable protein regulated by insulin 1 | |
| Modification date | 20200322 | |
| UniProtAcc | Q13541 | |
| Child GO biological process term(s) under GO:0006412 |
| GO ID | GO term |
| GO:0017148 | Negative regulation of translation |
| GO:0006417 | Regulation of translation |
| GO:0006413 | Translational initiation |
| GO:0006412 | Translation |
| Gene ontology of translaction factor with evidence of Inferred from Direct Assay (IDA) from Entrez |
| Partner | Gene | GO ID | GO term | PubMed ID |
| Hgene | EIF4EBP1 | GO:0031929 | TOR signaling | 12150926|22578813 |
| Hgene | EIF4EBP1 | GO:0045947 | negative regulation of translational initiation | 22578813 |
| Inferred gene age of translation factor. |
| Gene | Inferred gene age group among (0 - 67.6], (67.6 - 355.7], (355.7 - 733], (733 - 1119.25], >1119.25 |
| EIF4EBP1 | (355.7 - 733] |
Top |
|
| We searched PubMed using 'EIF4EBP1[title] AND translation [title] AND human.' |
| Gene | Title | PMID |
| EIF4EBP1 | . | . |
Top |
|
| Skipped exons in TCGA and GTEx based on Ensembl gene isoform structure. * Click on the image to open the UCSC genome browser with custom track showing this image in a new window. For more annotations, please visit our ExonSkipDB. |
 |
| Open reading frame (ORF) analsis of exon skipping events based on Ensembl gene isoform structure. * Click on the break point to see the gene structure around the break point region using the UCSC Genome Browser. |
| ENST | Exon skip start (DNA) | Exon Skip end (DNA) | ORF |
| Exon skipping position in the amino acid sequence. |
| ENST | Exon skip start (DNA) | Exon Skip end (DNA) | Len(transcript seq) | Exon skip start (mRNA) | Exon Skip end (mRNA) | Len(amino acid seq) | Exon skip start (AA) | Exon Skip end (AA) |
| Potentially (partially) lost protein functional features of UniProt. |
| UniProtAcc | Exon skip start (AA) | Exon Skip end (AA) | Function feature start (AA) | Function feature end (AA) | Functional feature type | Functional feature desc. |
Top |
|
| Gene expression level across TCGA pancancer |
 |
| Gene expression level across GTEx pantissue |
 |
| Expression level of gene isoforms across TCGA pancancer |
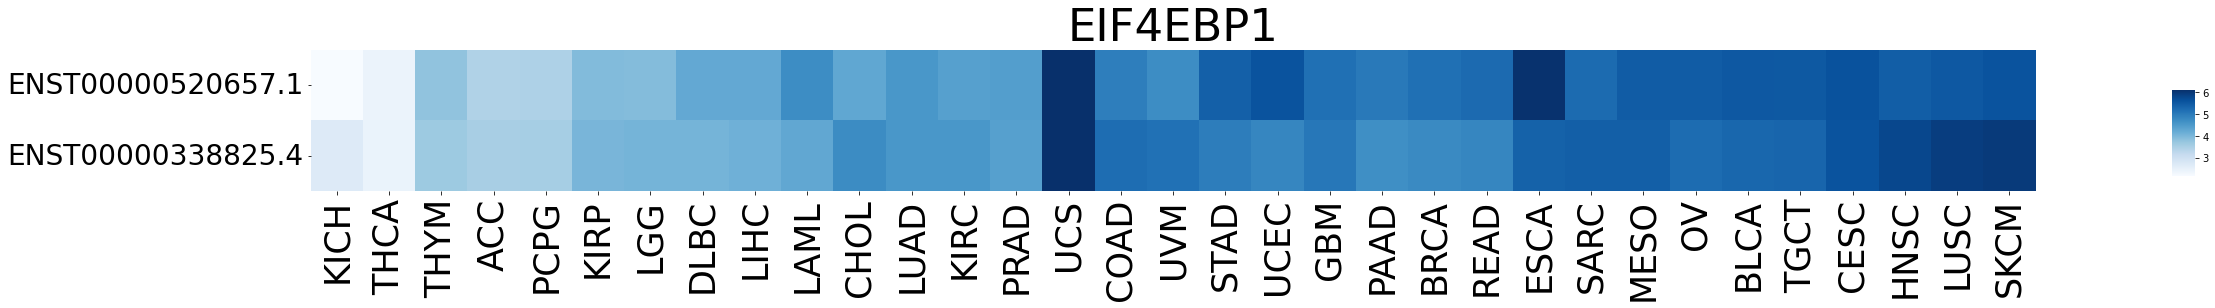 |
| Expression level of gene isoforms across GTEx pantissue |
 |
| Cancer(tissue) type-specific expression level of Translation factor using z-score distriution |
 |
| Differential expression between tumor and matched normal (in the cancer types with more than 10 matched samples) |
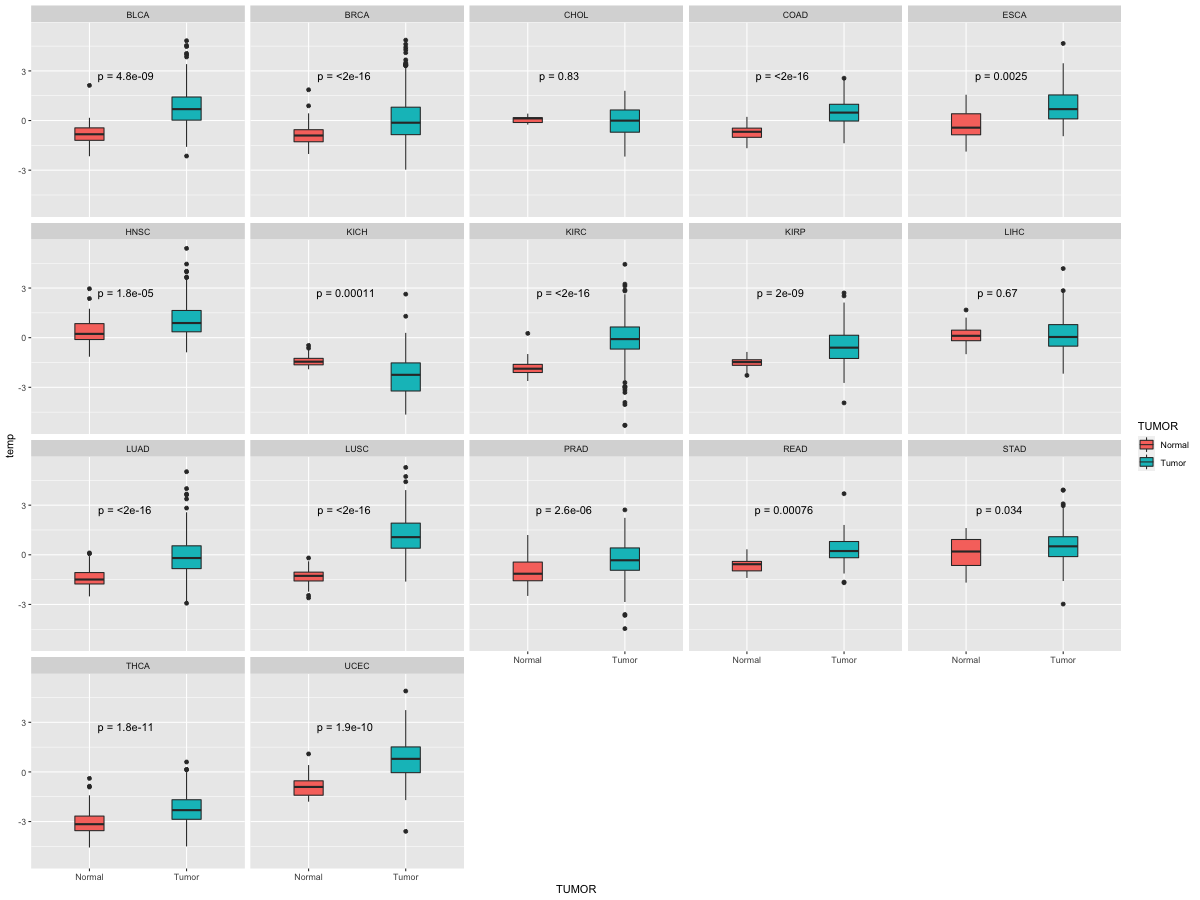 |
| Cancer type | Translation factor | FC | adj.pval |
| PRAD | EIF4EBP1 | -1.52730406636296 | 0.00170492480464144 |
| HNSC | EIF4EBP1 | 1.16888194926653 | 0.0196738412400919 |
| KIRP | EIF4EBP1 | -2.1223854491688 | 2.98023223876953e-07 |
| LUAD | EIF4EBP1 | -2.82691479456829 | 6.51132046672323e-08 |
| BRCA | EIF4EBP1 | -1.867430312542 | 8.26346922422571e-07 |
| KIRC | EIF4EBP1 | -3.14860466879601 | 9.40007073737459e-12 |
Top |
|
| Translation factor expression regulation through miRNA binding |
| Cancer type | Gene | miRNA | TargetScan binding score (Context++ score percentile) | Coefficient | Pvalue |
| Translation factor expression regulation through methylation in the promoter of Translation factor |
 |
| Cancer type | Gene | methyl group b | methyl group a | DEG pval | avg methyl in b | avg methyl in a | avg exp in b | avg exp in a |
| Translation factor expression regulation through methylation in the gene body of Translation factor (positive regulation) |
 |
| Cancer type | Gene | methyl group b | methyl group a | DEG pval | avg methyl in b | avg methyl in a | avg exp in b | avg exp in a |
| Translation factor expression regulation through copy number variation of Translation factor |
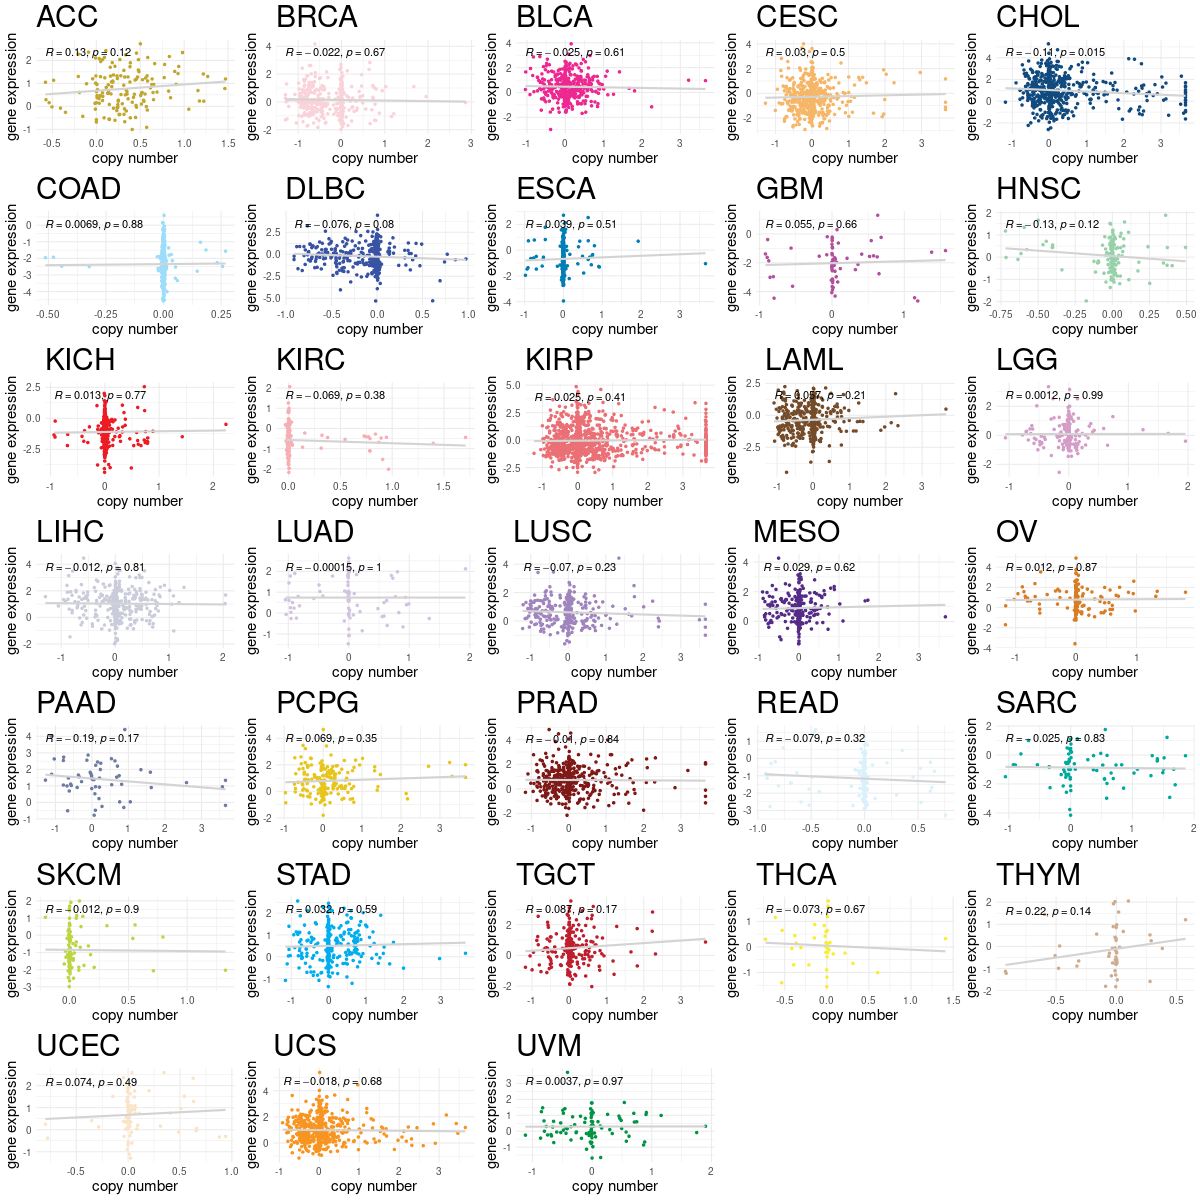 |
| Cancer type | Gene | Coefficient | Pvalue |
| CHOL | EIF4EBP1 | -0.082174008 | 0.014843092 |
Top |
|
| Strongly correlated genes belong to cellular important gene groups with EIF4EBP1 (coefficient>0.8, pval<0.05, node color based on FC between tumor and matched normal). Significantly associated important genes in the individual cancer types. * Cell metabolism gene: cell metabolism genes from REACTOME (black edge), IUPHAR: drug target genes from IUPHAR (blue edge), Kinase: human kinase genes (brown edge), CGC: cancer gene census genes (orange edge), TSG: tumor suppresor genes (purple edge), Epifactor: epigenetic factors (light blue edge), TF: transcription factors (green) |
 |
| Cancer type | Gene group | Translation factor | Correlated gene | Coefficient | Pvalue |
| THYM | Cell metabolism gene | EIF4EBP1 | PMM2 | 0.802998013 | 9.61E-29 |
| THYM | Cell metabolism gene | EIF4EBP1 | SLC27A5 | 0.803290122 | 8.87E-29 |
| THYM | Cell metabolism gene | EIF4EBP1 | TOMM40 | 0.805071358 | 5.44E-29 |
| THYM | Cell metabolism gene | EIF4EBP1 | TSTA3 | 0.805341062 | 5.05E-29 |
| THYM | Cell metabolism gene | EIF4EBP1 | MTX1 | 0.807070645 | 3.13E-29 |
| THYM | Cell metabolism gene | EIF4EBP1 | ITPA | 0.80828986 | 2.22E-29 |
| THYM | Cell metabolism gene | EIF4EBP1 | NANS | 0.809060111 | 1.79E-29 |
| THYM | Cell metabolism gene | EIF4EBP1 | GEMIN7 | 0.810501911 | 1.19E-29 |
| THYM | Cell metabolism gene | EIF4EBP1 | EXOSC5 | 0.810652803 | 1.14E-29 |
| THYM | Cell metabolism gene | EIF4EBP1 | PSMB3 | 0.813259383 | 5.39E-30 |
| THYM | Cell metabolism gene | EIF4EBP1 | TIMM13 | 0.813542642 | 4.96E-30 |
| THYM | Cell metabolism gene | EIF4EBP1 | SNRPD2 | 0.813567369 | 4.93E-30 |
| THYM | Cell metabolism gene | EIF4EBP1 | TIMM10 | 0.821233516 | 5.06E-31 |
| THYM | Cell metabolism gene | EIF4EBP1 | TBCB | 0.824733015 | 1.73E-31 |
| THYM | Cell metabolism gene | EIF4EBP1 | NME1 | 0.82549921 | 1.36E-31 |
| THYM | Cell metabolism gene | EIF4EBP1 | SRM | 0.829442131 | 3.91E-32 |
| THYM | Cell metabolism gene | EIF4EBP1 | DOHH | 0.832123705 | 1.65E-32 |
| THYM | Cell metabolism gene | EIF4EBP1 | HMBS | 0.832143212 | 1.64E-32 |
| THYM | Cell metabolism gene | EIF4EBP1 | NME2 | 0.835169553 | 6.04E-33 |
| THYM | Cell metabolism gene | EIF4EBP1 | TIMM8B | 0.839153748 | 1.58E-33 |
| THYM | Cell metabolism gene | EIF4EBP1 | EXOSC4 | 0.841169533 | 7.88E-34 |
| THYM | Cell metabolism gene | EIF4EBP1 | GMPPA | 0.848756903 | 5.30E-35 |
| THYM | Cell metabolism gene | EIF4EBP1 | TIMM50 | 0.850649987 | 2.64E-35 |
| THYM | Cell metabolism gene | EIF4EBP1 | POLR2H | 0.874248455 | 1.82E-39 |
| THYM | Cell metabolism gene | EIF4EBP1 | ALG3 | 0.874698186 | 1.49E-39 |
| THYM | Epifactor | EIF4EBP1 | BRMS1 | 0.804532572 | 6.31E-29 |
| THYM | Epifactor | EIF4EBP1 | EXOSC5 | 0.810652803 | 1.14E-29 |
| THYM | Epifactor | EIF4EBP1 | FBL | 0.824149077 | 2.07E-31 |
| THYM | Epifactor | EIF4EBP1 | PRMT1 | 0.824233403 | 2.02E-31 |
| THYM | Epifactor | EIF4EBP1 | SIRT6 | 0.834970193 | 6.45E-33 |
| THYM | Epifactor | EIF4EBP1 | EXOSC4 | 0.841169533 | 7.88E-34 |
| THYM | IUPHAR | EIF4EBP1 | SLC27A5 | 0.803290122 | 8.87E-29 |
| THYM | IUPHAR | EIF4EBP1 | ECE2 | 0.804955333 | 5.62E-29 |
| THYM | IUPHAR | EIF4EBP1 | SLC39A4 | 0.816223004 | 2.27E-30 |
| THYM | IUPHAR | EIF4EBP1 | FKBP1A | 0.82422907 | 2.02E-31 |
| THYM | IUPHAR | EIF4EBP1 | PRMT1 | 0.824233403 | 2.02E-31 |
| THYM | IUPHAR | EIF4EBP1 | SIRT6 | 0.834970193 | 6.45E-33 |
| THYM | TF | EIF4EBP1 | ZNF787 | 0.807555978 | 2.73E-29 |
| THYM | TF | EIF4EBP1 | ZNF511 | 0.812742428 | 6.25E-30 |
| THYM | TF | EIF4EBP1 | NME2 | 0.835169553 | 6.04E-33 |
| THYM | TSG | EIF4EBP1 | BRMS1 | 0.804532572 | 6.31E-29 |
| THYM | TSG | EIF4EBP1 | SLC39A4 | 0.816223004 | 2.27E-30 |
| THYM | TSG | EIF4EBP1 | GADD45GIP1 | 0.821301189 | 4.96E-31 |
| THYM | TSG | EIF4EBP1 | PYCARD | 0.822713552 | 3.22E-31 |
| THYM | TSG | EIF4EBP1 | NME1 | 0.82549921 | 1.36E-31 |
| THYM | TSG | EIF4EBP1 | SIRT6 | 0.834970193 | 6.45E-33 |
| UCS | Cell metabolism gene | EIF4EBP1 | PMM2 | 0.802998013 | 9.61E-29 |
| UCS | Cell metabolism gene | EIF4EBP1 | SLC27A5 | 0.803290122 | 8.87E-29 |
| UCS | Cell metabolism gene | EIF4EBP1 | TOMM40 | 0.805071358 | 5.44E-29 |
| UCS | Cell metabolism gene | EIF4EBP1 | TSTA3 | 0.805341062 | 5.05E-29 |
| UCS | Cell metabolism gene | EIF4EBP1 | MTX1 | 0.807070645 | 3.13E-29 |
| UCS | Cell metabolism gene | EIF4EBP1 | ITPA | 0.80828986 | 2.22E-29 |
| UCS | Cell metabolism gene | EIF4EBP1 | NANS | 0.809060111 | 1.79E-29 |
| UCS | Cell metabolism gene | EIF4EBP1 | GEMIN7 | 0.810501911 | 1.19E-29 |
| UCS | Cell metabolism gene | EIF4EBP1 | EXOSC5 | 0.810652803 | 1.14E-29 |
| UCS | Cell metabolism gene | EIF4EBP1 | PSMB3 | 0.813259383 | 5.39E-30 |
| UCS | Cell metabolism gene | EIF4EBP1 | TIMM13 | 0.813542642 | 4.96E-30 |
| UCS | Cell metabolism gene | EIF4EBP1 | SNRPD2 | 0.813567369 | 4.93E-30 |
| UCS | Cell metabolism gene | EIF4EBP1 | TIMM10 | 0.821233516 | 5.06E-31 |
| UCS | Cell metabolism gene | EIF4EBP1 | TBCB | 0.824733015 | 1.73E-31 |
| UCS | Cell metabolism gene | EIF4EBP1 | NME1 | 0.82549921 | 1.36E-31 |
| UCS | Cell metabolism gene | EIF4EBP1 | SRM | 0.829442131 | 3.91E-32 |
| UCS | Cell metabolism gene | EIF4EBP1 | DOHH | 0.832123705 | 1.65E-32 |
| UCS | Cell metabolism gene | EIF4EBP1 | HMBS | 0.832143212 | 1.64E-32 |
| UCS | Cell metabolism gene | EIF4EBP1 | NME2 | 0.835169553 | 6.04E-33 |
| UCS | Cell metabolism gene | EIF4EBP1 | TIMM8B | 0.839153748 | 1.58E-33 |
| UCS | Cell metabolism gene | EIF4EBP1 | EXOSC4 | 0.841169533 | 7.88E-34 |
| UCS | Cell metabolism gene | EIF4EBP1 | GMPPA | 0.848756903 | 5.30E-35 |
| UCS | Cell metabolism gene | EIF4EBP1 | TIMM50 | 0.850649987 | 2.64E-35 |
| UCS | Cell metabolism gene | EIF4EBP1 | POLR2H | 0.874248455 | 1.82E-39 |
| UCS | Cell metabolism gene | EIF4EBP1 | ALG3 | 0.874698186 | 1.49E-39 |
| UCS | Epifactor | EIF4EBP1 | BRMS1 | 0.804532572 | 6.31E-29 |
| UCS | Epifactor | EIF4EBP1 | EXOSC5 | 0.810652803 | 1.14E-29 |
| UCS | Epifactor | EIF4EBP1 | FBL | 0.824149077 | 2.07E-31 |
| UCS | Epifactor | EIF4EBP1 | PRMT1 | 0.824233403 | 2.02E-31 |
| UCS | Epifactor | EIF4EBP1 | SIRT6 | 0.834970193 | 6.45E-33 |
| UCS | Epifactor | EIF4EBP1 | EXOSC4 | 0.841169533 | 7.88E-34 |
| UCS | IUPHAR | EIF4EBP1 | SLC27A5 | 0.803290122 | 8.87E-29 |
| UCS | IUPHAR | EIF4EBP1 | ECE2 | 0.804955333 | 5.62E-29 |
| UCS | IUPHAR | EIF4EBP1 | SLC39A4 | 0.816223004 | 2.27E-30 |
| UCS | IUPHAR | EIF4EBP1 | FKBP1A | 0.82422907 | 2.02E-31 |
| UCS | IUPHAR | EIF4EBP1 | PRMT1 | 0.824233403 | 2.02E-31 |
| UCS | IUPHAR | EIF4EBP1 | SIRT6 | 0.834970193 | 6.45E-33 |
| UCS | TF | EIF4EBP1 | ZNF787 | 0.807555978 | 2.73E-29 |
| UCS | TF | EIF4EBP1 | ZNF511 | 0.812742428 | 6.25E-30 |
| UCS | TF | EIF4EBP1 | NME2 | 0.835169553 | 6.04E-33 |
| UCS | TSG | EIF4EBP1 | BRMS1 | 0.804532572 | 6.31E-29 |
| UCS | TSG | EIF4EBP1 | SLC39A4 | 0.816223004 | 2.27E-30 |
| UCS | TSG | EIF4EBP1 | GADD45GIP1 | 0.821301189 | 4.96E-31 |
| UCS | TSG | EIF4EBP1 | PYCARD | 0.822713552 | 3.22E-31 |
| UCS | TSG | EIF4EBP1 | NME1 | 0.82549921 | 1.36E-31 |
| UCS | TSG | EIF4EBP1 | SIRT6 | 0.834970193 | 6.45E-33 |
| UVM | Cell metabolism gene | EIF4EBP1 | SLC25A1 | 0.800100445 | 5.45E-19 |
| UVM | Epifactor | EIF4EBP1 | RUVBL2 | 0.804732664 | 2.40E-19 |
| UVM | Epifactor | EIF4EBP1 | PELP1 | 0.826329817 | 3.85E-21 |
| UVM | Epifactor | EIF4EBP1 | C17orf49 | 0.830100735 | 1.77E-21 |
| UVM | IUPHAR | EIF4EBP1 | SLC25A1 | 0.800100445 | 5.45E-19 |
| UVM | IUPHAR | EIF4EBP1 | SLC25A39 | 0.803543456 | 2.97E-19 |
| UVM | IUPHAR | EIF4EBP1 | SCYL1 | 0.811115398 | 7.49E-20 |
| UVM | Kinase | EIF4EBP1 | SCYL1 | 0.811115398 | 7.49E-20 |
| UVM | TSG | EIF4EBP1 | SCYL1 | 0.811115398 | 7.49E-20 |
Top |
|
| Protein 3D structure Visit iCn3D. |
Top |
|
| Protein-protein interaction networks * Overlap between up-regulated DEGs (log2FC<-1 and adj.P<0.05) and STRING PPI network (center: Translation factor, node: DEGs, edges: weighted by -log2(adj.P)) |
 |
| Overlap between down-regulated DEGs (log2FC>1 and adj.P<0.05) and STRING PPI network (center: Translation factor, node: DEGs, edges: weighted by -log2(adj.P)) |
 |
 * Edge colors based on TCGA cancer types. |
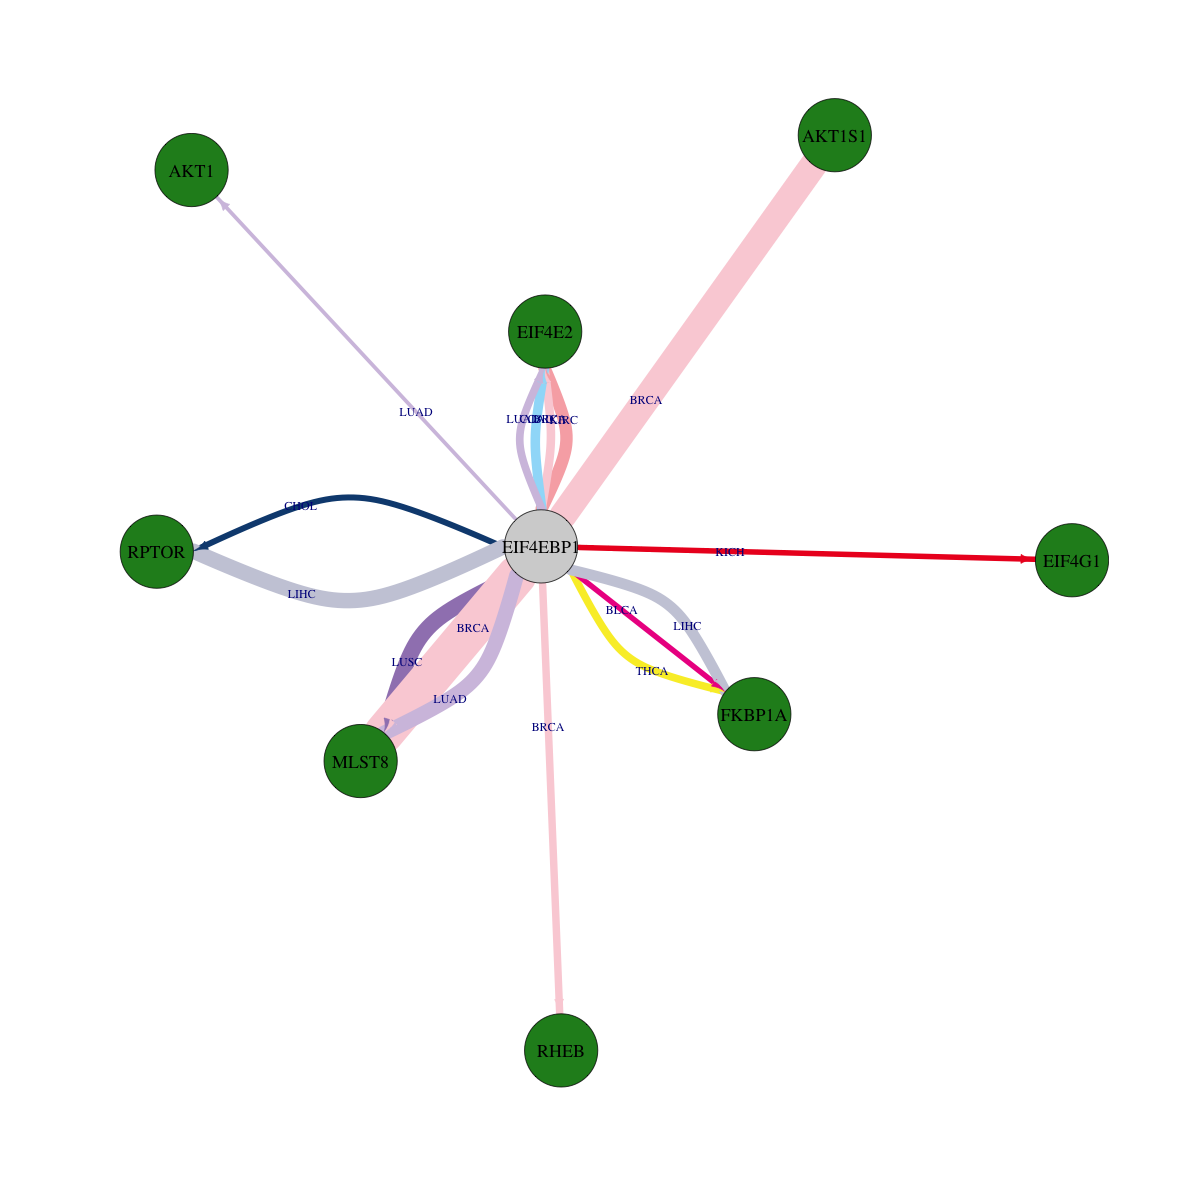
| * Overlap between DEGs (log2FC>1 and adj.P<0.05) and STRING PPI network per cancer (center: Translation factor, node: DEGs, node color: log2FC, edges: weighted by -log2(adj.P)) |
 |
| Cancer type | Translation factor | Interacting protein coding gene | FC | adj.pval |
| COAD | EIF4EBP1 | EIF4E2 | -1.6767866186069 | 0.000144809484481812 |
| BRCA | EIF4EBP1 | EIF4E2 | -1.81299600715269 | 0.000370278590179521 |
| LUAD | EIF4EBP1 | EIF4E2 | -1.75169025615215 | 0.000823732994424591 |
| THCA | EIF4EBP1 | FKBP1A | -2.88688228811274 | 0.00088455514534471 |
| BRCA | EIF4EBP1 | RHEB | -1.34423616302394 | 0.00103883851257192 |
| CHOL | EIF4EBP1 | RPTOR | -2.34317187916664 | 0.00390625 |
| KICH | EIF4EBP1 | EIF4G1 | -1.46656081150743 | 0.00612920522689819 |
| BLCA | EIF4EBP1 | FKBP1A | -2.74500958748462 | 0.0061798095703125 |
| KICH | EIF4EBP1 | RHEB | 1.83191315229171 | 0.0236499309539795 |
| LUAD | EIF4EBP1 | AKT1 | -4.53714460696341 | 0.0301695351050489 |
| LUAD | EIF4EBP1 | MLST8 | -1.0067433555627 | 1.03207777888518e-06 |
| KIRC | EIF4EBP1 | EIF4E2 | -4.19473040895577 | 1.04336657477644e-05 |
| BRCA | EIF4EBP1 | MLST8 | -1.86304443127359 | 1.06372586581501e-16 |
| BRCA | EIF4EBP1 | AKT1S1 | -1.36773925418723 | 1.24224675305145e-11 |
| LUSC | EIF4EBP1 | MLST8 | -2.07059311474544 | 3.67421243367441e-07 |
| LIHC | EIF4EBP1 | AKT1S1 | 1.82771941001661 | 4.2584580238307e-05 |
| LIHC | EIF4EBP1 | FKBP1A | -1.09181838113595 | 4.43935944712054e-05 |
| PRAD | EIF4EBP1 | RHEB | 1.54870835586921 | 4.59461327401057e-05 |
| KICH | EIF4EBP1 | EIF4E | 1.61675210562671 | 6.55651092529297e-06 |
| LIHC | EIF4EBP1 | RPTOR | -4.36362270436135 | 6.64579404273587e-07 |
| PRAD | EIF4EBP1 | MTOR | 2.45767376269894 | 8.16442831201447e-07 |
| Protein-protein interactors with this translation factor (BIOGRID-3.4.160) |
| PPI interactors with EIF4EBP1 |
| CHTF8, EIF4E, UBAC1, ATM, MTOR, LRPAP1, PPP2R2A, Mtor, RPTOR, MEC1, GSK3B, IRAK4, PRKCA, KLHL25, MAPK1, AGO2, LRRK2, MAPK14, STK3, PPP2R4, PRKDC, LATS1, SLMAP, MLST8, REL, TCF4, AKT2, AKT3, CCDC94, CHMP2A, DDX1, FLNB, GGA1, HNRNPA1, SHMT2, HNRNPAB, AKT1, BUB1, MAPKAPK5, TRIM25, TRIM14, TOR1, RICTOR, MEOX1, PICK1, POU6F2, LMO2, EIF4E2, DDIT4L, EIF4E1B, ZNF655, EIF4G1, EIF4EBP2, EIF4ENIF1, EIF4G3, EIF4A2, EIF3B, EIF3D, EIF3C, EIF3L, EIF3I, EIF3K, EIF3H, EIF3G, EIF3A, EIF3M, EIF3E, ANGEL1, RPS27L, EIF3F, CRMP1, FBXO11, CARM1, PCBP3, BTBD1, |
Top |
|
| Clinically associated variants from ClinVar. |
| Gene | Chr | Position | RefSeq | VarSeq | RefSeeq | VarType | Pathogenic | Disease | VarInfo |
| EIF4EBP1 | chr8 | 37914738 | G | A | single_nucleotide_variant | Benign | not_provided | SO:0001819|synonymous_variant | SO:0001819|synonymous_variant |
| nsSNVs with sample frequency (size of circle) from TCGA 33 cancers. |
 |
| SNVs and Indels |
| Gene | Cancer type | Chromosome | Start | End | RefSeeq | MutSeq | Mutation type | AAchange | # samples |
| EIF4EBP1 | SKCM | chr8 | 37914620 | 37914620 | G | A | Missense_Mutation | p.R56Q | 4 |
| EIF4EBP1 | HNSC | chr8 | 37914654 | 37914654 | G | T | Silent | p.V67V | 3 |
| EIF4EBP1 | SKCM | chr8 | 37914672 | 37914672 | G | A | Silent | p.R73R | 2 |
| EIF4EBP1 | ESCA | chr8 | 37914778 | 37914778 | G | A | Missense_Mutation | p.G109S | 2 |
| EIF4EBP1 | ESCA | chr8 | 37914778 | 37914778 | G | A | Missense_Mutation | 2 | |
| EIF4EBP1 | STAD | chr8 | 37914620 | 37914620 | G | A | Missense_Mutation | 2 | |
| EIF4EBP1 | ESCA | chr8 | 37914778 | 37914778 | G | A | Splice_Site | p.G109_splice | 2 |
| EIF4EBP1 | STAD | chr8 | 37914619 | 37914619 | C | T | Missense_Mutation | p.R56W | 2 |
| EIF4EBP1 | KIRP | chr8 | 37914666 | 37914666 | C | A | Silent | 2 | |
| EIF4EBP1 | BLCA | chr8 | 37914710 | 37914710 | G | A | Missense_Mutation | p.S86N | 2 |
| EIF4EBP1 | HNSC | chr8 | 37914654 | 37914654 | G | T | Silent | 1 | |
| EIF4EBP1 | STAD | chr8 | 37914773 | 37914773 | C | T | Missense_Mutation | p.A107V | 1 |
| EIF4EBP1 | HNSC | chr8 | 37914778 | 37914778 | G | T | Missense_Mutation | p.G109C | 1 |
| EIF4EBP1 | LIHC | chr8 | 37914651 | 37914651 | T | C | Silent | 1 | |
| EIF4EBP1 | LIHC | chr8 | 37914726 | 37914726 | G | - | Frame_Shift_Del | 1 | |
| EIF4EBP1 | BLCA | chr8 | 37914710 | 37914710 | G | A | Missense_Mutation | 1 | |
| EIF4EBP1 | LUSC | chr8 | 37914609 | 37914609 | C | T | Silent | p.I52I | 1 |
| Copy number variation (CNV) of EIF4EBP1 * Click on the image to open the original image in a new window. |
 |
| Fusion gene breakpoints (product of the structural variants (SVs)) across EIF4EBP1 * Click on the image to open the UCSC genome browser with custom track showing this image in a new window. |
 |
| Fusion genes with this translation factor from FusionGDB2.0. |
| FusionGDB2 ID | Disease | Sample | Hgene | Hchr | Hbp | Hstrand | Tgene | Tchr | Tbp | Tstrand |
| 102758 | LIHC | TCGA-KR-A7K8-01A | ASPH | chr8 | 62430087 | - | EIF4EBP1 | chr8 | 37914599 | + |
| 102758 | N/A | BF437073 | BAZ1B | chr7 | 72866832 | + | EIF4EBP1 | chr8 | 37914456 | - |
| 102758 | SARC | TCGA-DX-A3LS | C12orf65 | chr12 | 123718078 | + | EIF4EBP1 | chr8 | 37914598 | + |
| 102758 | SARC | TCGA-DX-A3LS-01A | C12orf65 | chr12 | 123718078 | + | EIF4EBP1 | chr8 | 37914599 | + |
| 102758 | LUSC | TCGA-85-8070-01A | DDHD2 | chr8 | 38111236 | + | EIF4EBP1 | chr8 | 37914599 | + |
| 81064 | BRCA | TCGA-C8-A1HN-01A | EIF4EBP1 | chr8 | 37888236 | + | ADAM12 | chr10 | 127734701 | - |
| 99193 | SARC | TCGA-LI-A67I-01A | EIF4EBP1 | chr8 | 37888236 | + | ADAM18 | chr8 | 39564309 | + |
| 99205 | LIHC | TCGA-XR-A8TG-01A | EIF4EBP1 | chr8 | 37914778 | + | GPR124 | chr8 | 37672414 | + |
| 89687 | BRCA | TCGA-E2-A106-01A | EIF4EBP1 | chr8 | 37888236 | + | POLR1D | chr13 | 28312844 | + |
| 99221 | HNSC | TCGA-CR-7364-01A | EIF4EBP1 | chr8 | 37888236 | + | TACC1 | chr8 | 38704217 | + |
| 71465 | N/A | BG576403 | EIF4EBP1 | chr8 | 37917883 | + | ZNF705D | chr8 | 11949437 | - |
| 102758 | BRCA | TCGA-S3-AA12 | GTF2E2 | chr8 | 30510949 | - | EIF4EBP1 | chr8 | 37914598 | + |
| 102758 | BRCA | TCGA-S3-AA12-01A | GTF2E2 | chr8 | 30510950 | - | EIF4EBP1 | chr8 | 37914599 | + |
| 102758 | LUSC | TCGA-43-2576 | HS6ST3 | chr13 | 96743823 | + | EIF4EBP1 | chr8 | 37914598 | + |
| 102758 | LUSC | TCGA-43-2576-01A | HS6ST3 | chr13 | 96743823 | + | EIF4EBP1 | chr8 | 37914599 | + |
| 102758 | BRCA | TCGA-A7-A0D9-01A | LRRC28 | chr15 | 99901716 | + | EIF4EBP1 | chr8 | 37914599 | + |
| 102758 | PRAD | TCGA-FC-A4JI | NCOA2 | chr8 | 71315934 | - | EIF4EBP1 | chr8 | 37914598 | + |
| 102758 | PRAD | TCGA-FC-A4JI-01A | NCOA2 | chr8 | 71315935 | - | EIF4EBP1 | chr8 | 37914599 | + |
| 102758 | BRCA | TCGA-AO-A0JI | PPP2R5C | chr14 | 102252520 | + | EIF4EBP1 | chr8 | 37914598 | + |
| 102758 | N/A | AX185526 | RP11-567N4.2 | chr4 | 76324594 | - | EIF4EBP1 | chr8 | 37890283 | - |
| 102758 | STAD | TCGA-CD-8530-01A | RPL7A | chr9 | 136215897 | + | EIF4EBP1 | chr8 | 37914599 | + |
| 102758 | N/A | BG575369 | RSL1D1 | chr16 | 11931212 | - | EIF4EBP1 | chr8 | 37894893 | - |
| 102758 | STAD | TCGA-CD-A486-01A | TPTEP1 | chr22 | 17083105 | + | EIF4EBP1 | chr8 | 37914599 | + |
| 102758 | PRAD | TCGA-J9-A8CP-01A | UNC5D | chr8 | 35093405 | - | EIF4EBP1 | chr8 | 37914599 | + |
| 102758 | BRCA | TCGA-AR-A5QQ | ZNF703 | chr8 | 37553740 | + | EIF4EBP1 | chr8 | 37914598 | + |
| 102758 | BRCA | TCGA-AR-A5QQ-01A | ZNF703 | chr8 | 37553739 | + | EIF4EBP1 | chr8 | 37914598 | + |
| 102758 | BRCA | TCGA-AR-A5QQ-01A | ZNF703 | chr8 | 37553740 | + | EIF4EBP1 | chr8 | 37914599 | + |
Top |
|
| Kaplan-Meier plots with logrank tests of overall survival (OS) |
 |
| Cancer type | Translation factor | Coefficent | Hazard ratio | Wald test pval | Likelihool ratio pval | Logrank test pval | # samples |
Top |
|
| Differential gene expression between female and male. (Wilcoxon test, pval<0.05) |
 |
| Cancer type | Translation factor | pval | adj.p |
| MESO | EIF4EBP1 | 0.000754324471258832 | 0.021 |
Top |
|
| Differential gene expression between young and old age groups (Wilcoxon test, pval<0.05) |
 |
| Cancer type | Translation factor | pval | adj.p |
| LUAD | EIF4EBP1 | 3.41549495983401e-05 | 0.0011 |
| SARC | EIF4EBP1 | 0.000193984789628357 | 0.0062 |
Top |
|
| Drugs targeting genes involved in this translation factor. (DrugBank Version 5.1.8 2021-05-08) |
| UniProtAcc | DrugBank ID | Drug name | Drug activity | Drug type | Drug status |
Top |
|
| Diseases associated with this translation factor. (DisGeNet 4.0) |
| Disease ID | Disease Name | # PubMeds | Disease source |
| C0022665 | Kidney Neoplasm | 1 | CTD_human |
| C0023467 | Leukemia, Myelocytic, Acute | 1 | CTD_human |
| C0026998 | Acute Myeloid Leukemia, M1 | 1 | CTD_human |
| C0282313 | Condition, Preneoplastic | 1 | CTD_human |
| C0334634 | Malignant lymphoma, lymphocytic, intermediate differentiation, diffuse | 1 | CTD_human |
| C0740457 | Malignant neoplasm of kidney | 1 | CTD_human |
| C0751958 | Lymphoma, Lymphocytic, Intermediate | 1 | CTD_human |
| C1879321 | Acute Myeloid Leukemia (AML-M2) | 1 | CTD_human |
| C4505456 | HIV Coinfection | 1 | CTD_human |
(UTHealth)
Web File Viewing | Emergency Information |Campus Carry|Site Policies